Conheça o Mercado MQL5 no YouTube, assista aos vídeos tutoriais
Como comprar um robô de negociação ou indicador?
Execute seu EA na
hospedagem virtual
hospedagem virtual
Teste indicadores/robôs de negociação antes de comprá-los
Quer ganhar dinheiro no Mercado?
Como apresentar um produto para o consumidor final?
Novos Indicadores Técnicos para MetaTrader 5 - 44

O indicador Martinware Manual Trading Helper (Auxiliar de Negociação Manual) tem por objetivo ajudar as pessoas a iniciar suas vidas na especulação manual. Ele pode ser usado para exibir tanto algumas imagens genéricas no lado direito do gráfico, onde observações operacionais personalizadas podem ser exibidas, quanto apenas um retângulo em branco que oculta o gráfico durante o backtest. Além disso, pode reproduzir periodicamente uma lista de sons. Para mostrar um retângulo em branco, deixe o pr
FREE

Essa ferramenta desenha candles em diferentes TIMEFRAME do 'padrão' exibido na tela... ...No 'Gráfico Padrão' M1, ele desenha os Candles em M15. Por exemplo: O 'Gráfico Padrão' em M1, o 'OHLC' em M15 são desenhados os Candles (caixas) de M15 por trás dos candles de M1.
Baixe a versão demo...
...veja como ele pode ajudar a observar pontos de Suporte/Resistência, bem como bons movimentos com máximas e mínimas nos 15M.

Value Chart indicator presents the Price evolution in a new form. This indicator, Price Momentum , was developed taking all the calculations presented in the book " Dynamic Trading Indicators " by Mark W. Helweg and David Stendahl (2002). The technique involves de-trended Prices from a user-defined Period of analysis and the addition of a Volatility index correction. The result is an Oscillator with 3 zones: Fair Price Value, Overbought/Oversold and Extremely Overbought/Oversold zones. Adding th
FREE

For those who hate candlesticks in lower timeframes (M1 through M15) we "invented" a clean new way to follow Price movement and displacement (volatility) called Price Trail Chart . The big "secret" is to get rid of those annoying candle wicks and draw the whole complete candle without them, this way we get a cleaner chart and a new view of the Price Path. No Open or Close markings, just LOW's and HIGH's, full body candle.
Additionaly we inserted a Volume monitor from our Best Downloaded indicat
FREE

This indicator signals significant price movements compared to the average over a defined period, making it easy to spot potential trading opportunities. It takes into account not only price movements but also the spread value of each symbol, providing a more accurate picture. You can use this indicator for multiple symbols, up to 8 pairs, as specified in the input parameters. With its flexible settings, traders can easily customize it to suit their individual preferences and trading styles. It'

The Market Momentum indicator is based on the Volume Zone Oscillator (VZO), presented by Waleed Aly Khalil in the 2009 edition of the International Federation of Technical Analysts journal, and presents a fresh view of this market valuable data that is oftenly misunderstood and neglected: VOLUME. With this new approach of "seeing" Volume data, traders can infer more properly market behavior and increase their odds in a winning trade.
"The VZO is a leading volume oscillator; its basic usefulnes

The Netsrac Correlation Trade Indicator (NCTI) was created to trade correlations between different assets. NCTI offers five different strategies to do this. Five different correlation trading strategies with two or three assets Fast access your assets with one click via asset buttons Your profit/loss at a glance Configurable alerts via screen or mobile You can use the indicator with every timeframe. Higher timeframes give fewer but better signals. If you have some questions or suggestions - plea
FREE

The Netsrac Correlation Trade Indicator (NCTI) was created to trade correlations between different assets. NCTI offers five different strategies to do this. Five different correlation trading strategies with two or three assets Fast access your assets with one click via asset buttons Your profit/loss at a glance Configurable alerts via screen or mobile You can use the indicator with every timeframe. Higher timeframes give fewer but better signals. If you have some questions or suggestions - pl

Quieres ser rentable y que un indicador haga los análisis por ti.. este es la indicado tener mas seguridad en tus operaciones si respetas los parámetros este indicador fue diseñada y modificado por mas de 6 meses, escogiendo y modificando la para tener un mejor resultado y entradas mas precisas. que te ayudara a asegurar tu entrada y poder sacarle muchas ganancias. los parametros: Entrada cuando La linea roja o verde cruce hacia arriba Puede entrar apenas comencé a cruzar Compra o venta Observa

Sistema VR não é apenas um indicador, é um sistema de negociação completo e bem equilibrado para negociação nos mercados financeiros. O sistema é construído sobre regras de negociação clássicas e uma combinação de indicadores Média Móvel e canal Donchian . O Sistema VR leva em consideração as regras para entrar no mercado, manter uma posição no mercado e as regras para sair de uma posição. Regras de negociação simples, riscos mínimos e instruções claras tornam o Sistema VR uma estratégia de nego

Um indicador que depende de liquidez e média móvel > que lhe dão 98% de decisão correta de compra e venda. e o tempo para fechar o comércio. O PREÇO aumentará de tempos em tempos > e quando o primeiro EA será lançado, esse indicador será superior a 2k. 1-quando abrir posições de compra ou venda (depende do cruzamento de duas linhas X e os cálculos de pontos dependem do Frame selecionado) (a cruz deve estar fora da área colorida) a vela deve tocar a cruz durante ou (primeira ou segunda até a quin

For those who struggle with overbloated Volume Profile/Market Profile indicators, here is a solution that contains only the Point of Control (POC) information. Super-fast and reliable, the Mini POC indicator presents this vital information visually within your chart. Totally customizable in splittable timeframes, type of Volume, calculation method, and how many days back you need.
SETTINGS Timeframe to split the POCs within the day. Volume type to use: Ticks or Real Volume. Calculation method
FREE
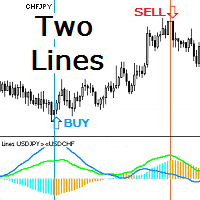
Индикатор показывает две линии динамики движения двух инструментов. Если один из коррелирующих инструментов убегает, другой будет его догонять. Этот принцип даёт точки входа в сделку по их кроссу или для синхронной покупки и продажи в парном трейдинге. Гистограмма индикатора показывает значение дистанции между линиями инструментов. При уменьшении и увеличении дистанции гистограмма принимает разные цвета. Треугольный значок показывает текущее состояние линий: расхождение ( Divergence ) или схо
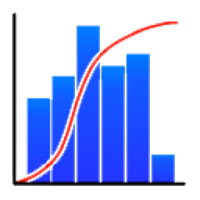
One of the most popular methods of Technical Analysis is the MACD , Moving Average Convergence Divergence, indicator. The MACD uses three exponentially smoothed averages to identify a trend reversal or a continuation of a trend. The indicator, which was developed by Gerald Appel in 1979 , reduces to two averages. The first, called the MACD1 indicator, is the difference between two exponential averages , usually a 26-day and a 12-day average.

Desbloqueie o poder da negociação de tendências com o indicador Trend Screener: sua solução definitiva de negociação de tendências, alimentada por lógica difusa e sistema de múltiplas moedas! Eleve sua negociação de tendências com o Trend Screener, o revolucionário indicador de tendências alimentado por lógica difusa. É um poderoso indicador de acompanhamento de tendências que combina mais de 13 ferramentas e recursos premium e 3 estratégias de negociação, tornando-o uma escolha versátil para to

The Inside Bar pattern is a very well known candlestick formation used widely by traders all over the world and in any marketplace. This approach is very simple and adds a little confirmation candle, so it adds a third past candlestick to the count to confirm the direction of the move (upward or downward). Obviously, there is no power on this candlestick formation if the trader has no context on what it is happening on the market he/she is operating, so this is not magic, this "radar" is only a
FREE

This indicator's formula is quoted from that [NEW MARKET TIMING TECHNIQUES] by Thomas R. DeMark It consists of setup phase & countdown phase. But not Intersection & TDST. Countdown starts from the first of setup bar. It shows setup count number under the price & countdown number above the price on charts. SETUP: For buy first of setup bar; Close(4 bars ago)> Close(current)&Close(4 bars ago)< Close(previous bar). For sell first of setup bar follows opposite process. From the second bar; Close(4 b
FREE
ECHO INDICATOR V2.2 Update
A top-quality indicator works with trend and pattern. The tool is a good assistant for the traders use various levels in trading.
When price approaches a level, the indicator produces a sound alert and (or) notifies in a pop-up message, or via push notifications. A great decision making tool for opening orders. Can be used any timeframe and can be customized
Easy to trade It implements alerts of all kinds It implements a multi-timeframe
Trade with Trend + s
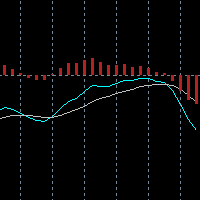
The built-in MACD does not properly display all the different aspects of a real MACD. These are: The difference between 2 moving averages A moving average of (1) A histogram of the difference between (1) and (2) With this indicator you can also tweak it as much as you want: Fast Period (default: 12) Slow Period (default: 26) Signal Period (default: 9) Fast MA type (default: exponential) Slow MA type (default: exponential) Signal MA type (default: exponential) Fast MA applied on (default: close)

Vol 2 DPOC volume vol 2 DOC-dynamic horizontal volume indicator for any time periods
Main settings of the indicator: Volume Source -selecting data for volumes (tick or real) DPOCOn -enabling / disabling the indicator DPOCFrom -calculation start date DPOCTo -settlement end date The indicator allows you to manually select areas on the chart to analyze changes in the maximum volume over time.
You can do this by using vertical lines and moving them along the chart. Or by setting specific dates

BeST_Hull MAs Directional Strategy is a Metatrader Indicator based on the corresponding Hull Moving Average.It timely locates the most likely points for Entering the Market as well as the most suitable Exit points and can be used either as a standalone Trading System or as an add-on to any Trading System for finding/confirming the most appropriate Entry or Exit points. This indicator does use only the directional slope and its turning points of Hull MAs to locate the Entry/Exit points while it

The technical indicator Wave Vision measures the relative strength of the trend movements of the price from its average values over a certain time period. The histogram shows price movement strenght relative to the zero level line. Histogram values close to zero indicate the equality of forces between buyers and sellers. Above the zero level line - bullish trend (positive values of the bar chart). Below the zero level line - bearish trend (negative values of the bar chart).
Settings:
Smoo
FREE
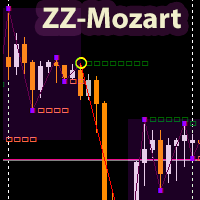
The ZigZagMozart indicator is based on the calculation of the advanced ZigZag. Displays trend break points (white squares), resulting points (yellow circles), flat zones (purple dots). The only indicator parameter: “ pivot in points ” - the minimum shoulder between the peaks of the indicator. The indicator uses market analysis based on the strategy of the famous modern trader Mozart. https://www.youtube.com/watch?v=GcXvUmvr0mY.
ZigZagMozart - works on any currency pairs. If the parameter “piv

O medidor de força monetária fornece um guia visual rápido para saber quais moedas estão fortes e quais são fracas. O medidor mede a força de todos os pares cruzados do forex e aplica cálculos sobre eles para determinar a força geral de cada moeda individual. Calculamos com base na força da moeda com base na tendência de 28 pares.
Acessando nosso Blog MQL5, você pode baixar a versão gratuita do indicador. Experimente antes de comprar, sem as restrições do Metatrader Tester: Clique aqui

This indicator displays the wave structure of the market in the form several wave levels nested in each other. For each of these levels an automatic preliminary (draft) marking of waves in Elliott's style (123..., ABC... etc.) is created. This markup is completely automatic and absolutely univocal. The indicator is especially useful for beginner wave analysts, because among all the possible versions for wave marking, it allows you to immediately take the most adequate version as a ba

The Mono Waves indicator is designed to display the wave behavior of the market on a chart. Its appearance is presented on slide 1. This indicator uses the PPPC (Point-Percent Price Channel) indicator, which can be downloaded for free from the Market . When the market moves up, the upper border of the price channel is built on High candlestick prices (for more details, see the description of the PPPC indicator at the link given above). The higher the High prices rise
FREE

A useful dashboard that shows the RSI values for multiple symbols and Time-frames. It can be easily hidden/displayed with a simple click on the X top left of the dashboard. You can input upper and lower RSI values and the colours can be set to show when above/below these values. The default values are 70 and 30. You can choose whether the dashboard is displayed on the right or left of the chart. If you want to have 2 dashboards on the same chart you must input a different name for each. The sca
FREE

Os usuários de PVRSA / PVA certamente já conhecem o indicador Dragon e seu uso. O Dragão funciona como suporte e resistência dinâmico e pode ser usado para scalper ou para seguidor de tendência. Além do Dragão temos as médias WGT (rápida) e EMA (lenta) que podem mostrar o movimento imediato e também o movimento de tendência. Fique atento para a inclinação do Dragão! O indicador pode ser usado em qualquer ativo/par de moedas e pode ser personalizado conforme o interesse do trader. Veja também meu

Diversas técnicas utilizam o volume como ponto importante no trade. Seja para indicar força, exaustão, fraqueza do pullback, entre outros.
Em principal eu cito a teoria de Richard Wyckoff, que dizia sobre a importância de olhar preço e volume.
Entretanto, são diversas as possibilidades de filtrar o que é volume que deve ser notado.
Os usuários de PVRSA / PVA utilizam um indicador com cores específicas, que auxiliam na identificação do volume e do tipo de movimento que o preço fez.
Se
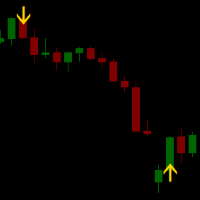
Signal RSI printa no gráfico os melhores momentos de entrada segundo o indicador RSI.
No gráfico aparecerá uma seta indicando o momento e a direção de entrada para a operação. O encerramento da operação se dá ao atingir o lucro esperado ou o stop. Se estiveres com uma operação aberta e aparecer outra seta de sentido inverso, inverta a mão e aproveite! Amplamente testado em gráficos de mini índice e mini dólar, bem como ações e FIIs.
Gráficos recomendados: 5, 10, 15 min.

This is RSI with alarm and push notification -is a indicator based on the popular Relative Strength Index (RSI) indicator with Moving Average and you can use it in Forex, Crypto, Traditional, Indices, Commodities. You can change colors to see how it fits you. Back test it, and find what works best for you. This product is an oscillator with dynamic overbought and oversold levels, while in the standard RSI, these levels are static and do not change.
This allows RSI with alarm and push notific
FREE

O Indicador TRIXs é a combinação do indicador TRIX (Triple Exponential Moving Average) com adição de um sinal tipo SMA (Simple Moving Average). Fornece sinais de continuidade de tendência e inicio de uma nova tendência. Os pontos de entrada e saída de operações ocorrem quando as curvas do indicador se cruzam. Tem melhor desempenho quando combinado com outros indicadores.
FREE

Um dos Melhores Indicadores de Volume, com a adição de uma Média Móvel para a ponderação de volume sobre a média de tempo. Se o Volume da "Vela Atual" for X% maior que o valor da média móvel, teremos um sinal de aumento de volume.
Podendo ser uma sinal de Inicio, Continuidade, Reversão ou Esgotamento do Movimento.
Totalmente configurável e todas as opções abertas, você pode colorir e setar TODOS os valores como achar mais confortável.
O 'Volume Break' mostra as barras de volumes na mesma

Combinando o melhor de Price Action , Movimento Direcional , e análise de Divergência/Convergência , o indicador Candle Color Trend is é uma forma fácil e confiável de identificar a direção da tendência. O indicador automaticamente pinta os candles de acordo com a premissa de que a tendência de alta é definida por preços que formam uma série de topos e fundos ascendentes. Por outro lado, a tendência de baixa é definido por preços que formam uma série de topos e fundos descendentes.
Color
FREE

O Indicador TRIXe é a combinação do indicador TRIX (Triple Exponential Moving Average) com adição de um sinal tipo EMA (Exponential Moving Average). Fornece sinais de continuidade de tendência e inicio de uma nova tendência. Os pontos de entrada e saída de operações ocorrem quando as curvas do indicador se cruzam. Tem melhor desempenho quando combinado com outros indicadores.
FREE

The Point-Percent Price Channel (PPPC or PP Price Channel) indicator is designed to display on the chart a channel whose width is specified both as a percentage of the current price and in points. Its appearance is presented on slide 1. When the market moves up, the upper border of the channel is built at the price of High candles. In this case, the lower boundary follows the upper one at a strictly specified distance. When the price touches the lower border of the channe
FREE

Squat bar.
One of the signals of the "Trade Chaos" system of Bill Williams.
It is calculated based on the difference in price changes and tick volume.
Strengthens the signal of the "Bearish/Bullish Divergent Bar (First Wiseman)" if it coincides with it or is nearby.
Tested in comparison with the original program "Investor's Dream".
For more effective development of the system, read and see the materials of Bill Williams.
In the settings you can choose the color of bar.

Bearish/Bullish divergent bar . One of the signals of the "Trade Chaos" system of Bill Williams. (First wiseman)
When bar moving away from the "Alligator" indicator and there is divergence on the Awesome Oscillator indicator, it shows a potential point of movement change.
It is based on the opening/closing of the bar, the position relative to the previous ones, the Alligator and AO.
When trading, the entrance is at the breakthrough of the bar(short trade - low of bar, long trade high of bar)

Benefits: A new and innovative way of looking across multiple timeframes and multiple indicators on any chart. Provides instant multi-timeframe analysis of any market. i.e. forex currency pairs, cryptocurrency pairs, commodities, etc. It offers precise indications across multiple timeframes of volatility as measured by RSI, ADX and STOCH within one chart. Helps you determine high probability trading setups. See example strategy in comments. Can see bullish/bearish volatility building across mult
Learning to trade on indicators can be a tricky process. Volatility Index indicator makes it easy by reducing visible indicators and providing signal alerts Entry and Exiting the market made possible through signal change Works well with high time frame to reduce market noise simplicity in trading guarantees success and minimal losses Our system creates confidence in trading in case of any difficulties or questions please send message

O indicador mostra (opcional): coeficiente de correlação de posto de Spearman, coeficiente de correlação linear de Pearson, coeficiente de correlação de posto de Kendall e coeficiente de correlação de sinal de Fechner. Este oscilador mostra os pontos de possível reversão do mercado quando o preço vai além dos níveis de sobrecompra e sobrevenda. Existem 4 métodos de filtragem adicional dos valores obtidos: simples, exponencial, suavizado, linearmente ponderado. Após o fechamento da barra, os val

Tabajara Rules for MT5 , baseado em Setup Tabajara do professor André Machado, indica a direção do mercado com base em médias móveis quando tem velas na mesma direção da média móvel.
O indicador contém a regra de coloração aplicada aos candles e a média móvel.
O indicador permite a alteração dos parâmetros: período e método de suavização da média móvel.
O indicador permite a alteração das cores dos candles ( contornos e preenchimento) e da média móvel.
O modelo do professor André Machado c
FREE

*Non-Repainting Indicator Bruce Webb Explains How To Use Bruce's Price Predictor In Detail And Free Forex Strategy https://youtu.be/hfoB1tZZpTo Bruce's Price Predictor is an indicator that shows precise price reversals. A great arsenal to add to any chart. Bruce's Price Predictor points price reversals with high degree of accuracy and it is great for scalping on the 1min time frame, Or swing trading on the 1hr time frame. Buy and sell arrows are shown on the chart as for entry signals. They do
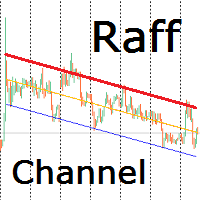
Индикатор строит канал Раффа на основе линейной регрессии. Красная линия тренда может использоваться для принятия решения о покупке или продаже внутрь канала при подходе цены к ней. Настройками можно задать ширину канала по коэффициенту отклонения от базовой линии или по максимальному и минимальному экстремуму. Так же можно включить продолжение канала вправо от текущих цен. Индикатор канала регрессии Раффа – удобный инструмент, значительно облегчающий работу современного трейдера. Он может быть

O indicador HammerStar foi projetado para procurar os padrões Martelo e Estrela Cadente no gráfico de qualquer ativo.
Martelo Tendência em baixa.
A sombra inferior não é menor do que 2 e não maior do que 3 vezes maior do que o corpo.
Não há sombra superior, ou ela é muito curta (não mais do que 10% da faixa da vela).
A cor do corpo a longo prazo não é importante, a curto prazo - martelo branco é muito mais forte do que o preto.
É sugerida uma confirmação.
Estrela Cadente Tendência em alt
FREE

Volume pressure and oscillator overbougth - oversold condition togedther. Signals appears on chart. Turnig points, trading ranges, support- resistance levels also. Change parameters in the trendscalp settings. TTF bars can be set: 8, or, 15, or 45, 150. Greather periods are very useful at strong support - resistance areas. IF ONE OF OUR FREE INDICATOR IS NICE TO YOU, FEEL FREE TO BUY AT LEAST OUR CHIEPST PRODUCT TO DONATE US. "Lots of small peace can be a mountain" ( nathan rothschild, john len
FREE

With this indicator user can determine not just pivot like turning points. User able to spot trading ranges boundaries and support-resistance levels. In a strong trend the reverse signals also gives us excellent entry points. Recommended user settings: In the Attis volume: look back period : 1 or (3) MA_Lenght 99. ( of course one can play with the settings and get tailored signals... as you need)
FREE

Multi time frame, multy currency special swing volume indicator with engulfing waves too. Simpler to use compare to Weis Wave. User don't need to adjust wave size. Just use of the basic or the upper time frames. As a multi time frame indikator user can do very complex time frame analysyses. As well as a multy currency indicator one can make market sector-segment analysyses. Use with Wckoff principles.
FREE

Sentiment Liner This is a steroidised Daily-Weakly-Monthly high-low and open, must have indicator. With this stuff user can determine the average of (daily-weakly-montly) open levels. 4 example: if you in day mode switch the average to 5, you get the 5 day sentiment. In weakly mode turn the average to 4, than you get the 4 weak sentiment,...so on. Naturally one can us as a simple day-week-month high and low indikator. S1: high S2: low Pivot: open, Average: averager
FREE
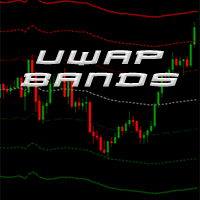
This indicator plots VWAP with 4 Standard Deviation bands. In finance, volume-weighted average price (VWAP) is the ratio of the value traded to total volume traded over a particular time horizon (usually one day). It is a measure of the average price at which a stock is traded over the trading horizon. VWAP is often used as a trading benchmark by investors who aim to be as passive as possible in their execution. Many pension funds, and some mutual funds, fall into this category. The aim of usi
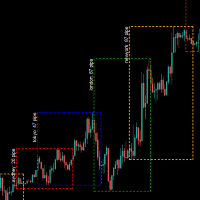
Indicadores de horário no mercado Forex, incluindo Sydney, Tóquio, Londres, Nova York 4 horários de mercado Considerando a troca de horário de verão do servidor e a troca de horário de verão em cada mercado
input ENUM_DST_ZONE InpServerDSTChangeRule = DST_ZONE_US; // Regras de troca de horário de verão no servidor De acordo com Nova York ou Europa
input int InpBackDays = 100; // máximo de dias de sorteio, por razões de desempenho
input bool InpShowTextLabel = true; // exibe rótulo de text

Market tops are characterized by Volume Climax Up bars, High Volume Churn and Low Volume Up bars (also called Testing). Market bottoms are characterized by Volume Climax Down bars, High Volume Churn and Low Volume Down bars (Testing). Pullbacks, in either up or down trends, are similar to market topping or bottoming patterns, but shorter in duration and with simpler volume patterns.
FREE
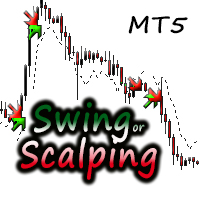
Continuous Coloured dot lines under and above price when conditions are met. Arrows Red and Green for entry Points. User can change the colours of the arrows in the colour section of the indicator. It is consider a great scalping tool on lower time-frames, while higher time frames will have fewer opportunities but trades will possibly last longer. There is an input for Alert on or off. This can be used effectively on M15/M30 Chart until up to H4 chart time. It is best if the user has some

Introduction to Fractal Moving Average Fractal Moving Average indicator was designed as part of Fractal Pattern Scanner. Inside Fractal Pattern Scanner, Fractal Moving Average Indicator was implemented as multiple of chart objects. With over thousands of chart object, we find that it was not the best and efficient ways to operate the indicator. It was computationally too heavy for the indicator. Hence, we decide to implement the indicator version of Fractal Moving Average indicator to benefit ou
FREE
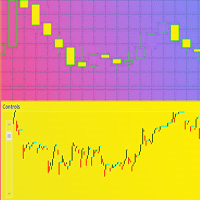
Индикатор для отображения свеч размером меньше одной минуты, вплоть до размера в одну секунду, для детализированного просмотра графика . Имеется ряд необходимых настроек для удобной визуализации. Настройка размера хранения истории ценовых данных транслируемых инструментов. Размер видимых свеч. Настройка отображения неподвижности на курсах графика. Возможность отображения на различных торговых инструментах. Удачной всем торговли.

Inspired from, Time is the most important factor in determining market movements and by studying past price records you will be able to prove to yourself history does repeat and by knowing the past you can tell the future. There is a definite relation between price and time. -William Delbert Gann Caution: It's not HolyGrail System, It's a tool to give you insight of current market structure. The decision to trade is made only with combination of economical understanding of underlying instru
This indicator improves the "DMI Trend" so that the trend signal reacts faster than before.
---The indicator allows you to simplify the interpretation of signals produced by the classical ADX indicator.
The position of the hight bars of the histogram relative to zero and the histogram coloring indicate the direction of price movement determined by the intersection of DI+ / DI-.
The position of the hight bars of the histogram relative to zero and the color indicate the strength of the pric

DYNAMIC SR TREND CHANNEL
Dynamic SR Trend Channel is a simple indicator for trend detection as well as resistance/support levels on the current timeframe. It shows you areas where to expect possible change in trend direction and trend continuation. It works with any trading system (both price action and other trading system that use indicators) and is also very good for renko charting system as well. In an uptrend, the red line (main line) serves as the support and the blue line serves as the

O indicador exibe gráficos minimizados de qualquer símbolo em qualquer período de tempo. O número máximo de gráficos exibidos é 28. Os gráficos podem ser localizados na janela principal e inferior. Dois modos de exibição: velas e barras. A quantidade de dados exibidos (barras e velas) e os tamanhos dos gráficos são ajustáveis. Para trabalhar com um minigráfico, você deve primeiro colocar o (s) indicador (es) desejado (s) em um gráfico regular, depois salvá-lo como um modelo e aplicar um modelo p
FREE

BinaWin NoTouch is an indicator that sends an alert signal when the trade is in the right position to wait for the breakdown of a side market.
It is specially designed to trade under the “No Touch” strategy of the Binary.Com platform with synthetic indexes N.10, N.25, N.50, N.75 and N.100
Similarly, trading can be done with the conventional CALL and PUT strategy of any Binary Options platform.
Requirements to use the indicator:
1. Have an account at Binary.Com
2. Configure the Binary.
FREE

Se você considera os extremos do preço diário como pontos importantes, este indicador vai ajudar nos seus trades. Agora, ao invés de traçar manualmente linhas que marcam as máximas e as mínimas diárias, você pode usar o indicador O (HL)² C Lines .
O indicador O(HL)²C Lines, plota automaticamente as linhas O (Open do dia atual), H(High do dia atual), L(Low do dia atual) e C (Close do dia anterior). Plota também a máxima e mínima do dia anterior. Assim, temos 4 linhas estáticas e duas linhas dinâ

Expert Market Edge is scalping, trending, reversal indicator, with alerts . You can use it all and fit with your strategy whatever it fits you. My recommendation is to combine with my Colored RSI , and when 2 signals are matched, and pointing same direction (for example buy on this indicator, and green on RSI, you can take a long position, stop loss should be last local low, if you want to be more conservative, add ATR. ) you can take position. If you using moving averages, that's even better i
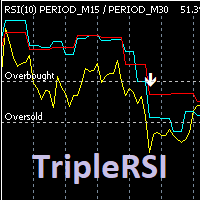
Индикатор отображает на графике данные RSI рабочего и двух старших тайм-фреймов, формирует сигналы выхода из зоны перекупленности / перепроданности кривой среднего временного периода. Опционально используется фильтр по данным старшего тайм-фрейма (расположение медленной линии выше средней для продажи и ниже средней - для покупки). Сигналы "подвального" индикатора дублируются на главном окне, отправляются сообщения во всплывающее окно, на почту и на мобильное устройство. Параметры индикатора: RSI
Pattern Finder 2 is a MULTICURRENCY indicator that scans the entire market seeking for up to 62 candlestick patterns in 15 different pairs/currencies all in one chart. It will help you to make the right decision in the right moment. You can filter the scanning following the trend by a function based on exponential moving average. You can setup parameters by an interface that appears by clicking the arrow that appear on the upperleft part of the window after you place the indicator. Parameters ar

Indicador para marcar a máxima e mínima do dia , com atualização momentânea, fechamento do dia anterior e início do dia . É possível definir quais marcações serão realizadas e também as cores para cada uma das marcações. Os valores de cada marcação são exibidos no canto superior esquerdo da tela, abaixo do painel de negociação dentro do gráfico.
Máxima e Mínima do Dia e Fechamento do Dia Anterior são marcados com uma linha horizontal, enquanto o início do dia com uma linha vertical. Pode ser us
FREE
Fractal Reverse MTF - Indicator for determining the fractal signal to change the direction of the trend for МetaТrader 5.
The signal is determined according to the rules described in the third book of B. Williams:
- In order to become a signal to BUY, the fractal must WORK ABOVE the red line
- In order to become a signal for SALE, the fractal must WORK BELOW the red line
- Signals are not redrawn/ not repainting The main idea of the indicator:
- Determine the change in the directio

This is Heiken Ashi smoothed version, where you can choose on what type smoothness you want to make your strategy base. You can choose between EMA or MA, on the period you want. And you can choose colors.
Definition:
The Heikin-Ashi technique averages price data to create a Japanese candlestick chart that filters out market noise. Heikin-Ashi charts, developed by Munehisa Homma in the 1700s, share some characteristics with standard candlestick charts but differ based on the values used to
FREE

The indicator allows you to simplify the interpretation of signals produced by the classical ADX indicator.
The position of the hight bars of the histogram relative to zero and the histogram coloring indicate the direction of price movement determined by the intersection of DI+ / DI-.
The position of the hight bars of the histogram relative to zero and the color indicate the strength of the price movement.
The indicator is a logical continuation of the series of indicators using this class
FREE

Esse indicador é a combinação do RSI (IFR) com Média Móvel Simples aplicada o RSI em um único indicador para facilitar a criação de alguma estratégia. Fiz esse indicador para que um único indicador contenha os buffer necessários para implementar alguma EA.
Descrição dos Buffers para o EA,
Buffer 0 -> Valor do RSI Buffer 1 -> Valor da média móvel aplicada ao RSI
FREE
O Mercado MetaTrader oferece um local conveniente e seguro para comprar aplicativos para a plataforma MetaTrader. Faça download de versões de demonstração gratuitas de Expert Advisors e indicadores a partir do seu terminal para testes no Testador de Estratégia.
Teste os aplicativos em diferentes modos para monitoramento do desempenho e assim fazer um pagamento para o produto que você deseja, usando o sistema de pagamento MQL5.community.
Você está perdendo oportunidades de negociação:
- Aplicativos de negociação gratuitos
- 8 000+ sinais para cópia
- Notícias econômicas para análise dos mercados financeiros
Registro
Login
Se você não tem uma conta, por favor registre-se
Para login e uso do site MQL5.com, você deve ativar o uso de cookies.
Ative esta opção no seu navegador, caso contrário você não poderá fazer login.