Conheça o Mercado MQL5 no YouTube, assista aos vídeos tutoriais
Como comprar um robô de negociação ou indicador?
Execute seu EA na
hospedagem virtual
hospedagem virtual
Teste indicadores/robôs de negociação antes de comprá-los
Quer ganhar dinheiro no Mercado?
Como apresentar um produto para o consumidor final?
Novos Indicadores Técnicos para MetaTrader 5 - 13

Ali Levels Pro is an indicator designed to identify and draw levels of interest including: Opening Range High/Low with seconds precision, Previous Session High/Low (if you are a Intraday trader who trades Indices or Commodities maybe you want to know yesterday New York Session high and low), Overnight Session High/Low, Previous Day High/Low, Previous Week High/Low, and Previous Month High/Low.
Traders use this levels as support and resistance levels. By searching for confluences between

Analise rapidamente a estrutura do mercado com esta ferramenta e tire partido dos níveis de preços importantes.
Estrutura do mercado Este indicador personalizado traça os níveis de preços importantes, que podem ser utilizados como pontos de entrada ou objectivos de lucro.
Identificar o seu intervalo de negociação Faça scalping com este indicador respeitando os pontos de viragem do mercado.
Oportunidades de negociação de breakout Utilize este indicador para detetar oportunidades de b
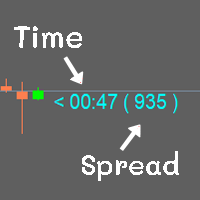
Show the time of candlesticks and spread. All data will be displayed in a rod. Can change color Can fix the size as needed
MT4 : Link https://www.mql5.com/en/market/product/102742 MT5 : Link https://www.mql5.com/en/market/product/102834
Most free code on various websites I didn't write it myself. I only do a little bit.
If you like it, please give 5 stars with it. Thank you.
FREE

Introduction
The Bounce Zone indicator is a cutting-edge non-repainting technical tool built to identify key areas on the price chart where market sentiment is likely to cause a significant price reversal. Using advanced algorithms and historical price data analysis, this indicator pinpoints potential bounce zones. Combined with other entry signal, this indicator can help forex traders place the best trades possible
Signal
A possible buy signal is generated when price is in the green zo
FREE
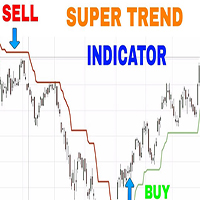
Como o nome sugere, indica a direção do movimento dos preços em um mercado que está em tendência, que está seguindo um determinado caminho. É plotado em gráficos de preços de ações para que os investidores vejam a tendência atual marcada, que é mostrada em vermelho quando os preços caíram e em verde quando os preços subiram.
Parâmetros de entrada:
Período do Indicador CCI Período do Indicador ATR Nível de ativação CCI Deslocamento horizontal das barras indicadoras De outra forma ; Você po

We value your feedback and believe that your experience with the Hull Moving Average (HMA) is essential to us and other traders. Help us continue to improve and refine our product by sharing your thoughts and insights through a review!
The Hull Moving Average (HMA) Indicator – Your Key to Smoother Trends and Profitable Trades! Are you tired of lagging and choppy moving averages that hinder your ability to spot profitable trading opportunities? Look no further! The Hull Moving Average (HMA) is
FREE

Volume Cross Over is an indicator that measure positive and negative volume flow in a financial instrument, such as a stock, commodity, or index. It is base on the idea of On-Balance Volume developed by Joseph Granville. However instead of trending lines, this indicator shows volume cross over. When the closing price of an asset is higher than the previous closing price, then the Bull volume is greater than zero and Bear volume is negative. It suggests that buying volume is dominating, and
FREE
The indicator is a bundle of EIGHT different fundamental functions required for a trader: 1] Forex Session where you can determine your own timings/highlights. 2] High low marking from 1H to 1M 3] Sweetspot 4] Spread and Candle Stick Timer 5] Background logo for branding- You can place the images at any zone of the chart you want 6] Profit and Loss 7] Days names (SUN MON TUE…) on the chart 8] High/low break notification

The indicator is created using a unique algorithm that has no analogues. Based on the calculations, the contract price itself and the percentages displayed in it are calculated, which are displayed in the indicator in the form of histograms in two drawing options, as well as in six options for displaying prices on a chart in various combinations, which allows you to accurately see the interest of all trading participants in the form of drawing levels support and resistance. Trading decisions can
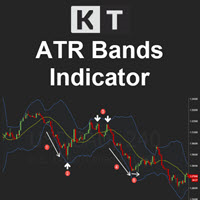
KT ATR Bands draws the volatility envelops and bands using a combination of Average True Range and Moving average. They are typically used to identify the potential reversal points and the periods of high and low volatility.
Features
Multi-Timeframe Ability: For example, you can have the atr bands from the daily timeframe on the H1 timeframe. Smart Alerts: You can turn on/off alerts for each band separately. Also, you can choose a minimum time interval between each alert to stop unnecessary,

KT DMA is a modified and advanced version of the classic Displaced Moving Averages with buy/sell crossover alerts and a Multi-Timeframe scanner that shows DMA's direction across each real-time time frame. A Displaced Moving Average is a simple moving average that moves ahead or backward in a time frame (either short-term or long-term). It also allows you to predict price movement more accurately.
Features Depicts the trend direction using the alignment of three moving averages. Buy/Sell signa
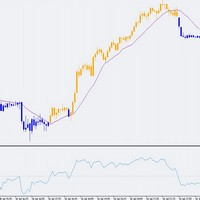
This indicator can be very useful in any trading system. Based on the 0 level of the RSI, IFR, an indicator widely used in technical analysis. It is a fact that in the financial market it is the simple that works. Help me to keep developing amazing and free tools like this one. Make a donation of any amount via PayPal: https://www.paypal.com/donate?token=rsC1blGOVvS5kQKFcp5i0Esu1ksLuPfSNFofz983tvMqYKyRceY1rje-qI-_s4N9rW7qxbcKy1-YZqL7

The Spider ZIGZAG is an algorithm to determine how critical the current peak is by spreading several lines with different parameters instead of one line between each 2 peaks. 1. The more zigzag's lines meet at a peak the higher probability the market will go for correction or change direction. 2. Usually when 3-4 zigzag's lines meet at a peak, the market enters a correction period, this don't happen instantly, it might take some time. 3. Usually when 5-6 zigzag's lines meet at a peak, th
FREE

The RSI (Relative Strength Index) scanner is a powerful technical analysis tool designed to help traders and investors identify potential trading opportunities in the forex, stocks, and cryptocurrency markets. RSI is a popular momentum oscillator that measures the speed and change of price movements and helps determine overbought or oversold conditions in an asset. The scanner takes advantage of this indicator to streamline the process of finding trading signals and opportunities. The RSI value
FREE
Alright. This indicator works on MT5 and is very easy to use. When you receive a signal from it, you wait for that candle with the signal to close and you enter your trade at the beginning of the next new candle. A red arrow means sell and a green arrow means buy. for easy identification of trade signal. Are you okay with that?
The indicator cost $500. We release new updates of the indicator every month and the updates are for free once you bought the indicator first time. This indicator was

KT Triple Top-Bottom identifies the triple top/bottom pattern with a breakout signal in the opposite direction. It is used to identify potential trend reversals.
A Triple Top pattern is formed when the price reaches a high point three times, while a Triple Bottom pattern occurs when the price comes to a low point three times.
Features The indicator detects the triple top/bottom pattern with high precision and accuracy. The indicator suggests a shift in momentum, with sellers or buyers takin
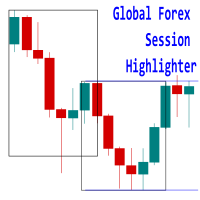
Introducing the 'Global Forex Session Highlighter' , a powerful tool designed to enhance your trading strategy by providing a visual representation of the Three major Forex trading sessions: Tokyo, London, and New York. This indicator is designed to help traders understand the dynamics of the global Forex market by highlighting the trading sessions directly on your MT5 chart. It provides a clear view of when each session starts and ends, allowing you to strategize your trades around the most act

Descubra o Canal de Regressão LT, um poderoso indicador técnico que combina elementos de análise de Fibonacci, análise de Envoltória e extrapolação de Fourier. Este indicador foi projetado para avaliar a volatilidade do mercado, ao mesmo tempo em que aprimora a precisão na identificação de níveis de sobrecompra e sobrevenda por meio da análise de Fibonacci. Ele também aproveita a extrapolação de Fourier para prever movimentos de mercado, integrando dados desses indicadores. Nossa ferramenta ver
FREE

The main objective of this indicator is to determine entry and exit points, that is why ExactArrow draws nothing but arrows showing entry and exit points. In spite of apparent simplicity of the indicator, it has complicated analytic algorithms which determine entry and exit points. The indicator generates exact and timely entry and exit signals which appear on the current candle. The indicator generates an average of 1-2 candles before its analogues do. The indicator is very easy to use. Open Bu

Este indicador é uma versão demo do My candle completo que pode ser baixado aqui: Candle Patterns Creator
com a versão completa você pode criar suas próprias regras de candle além de pode modificar um padrão de candle tradicional para ficar mais assertivo de acordo com sua estratégia
No indicador tem varias regras de candles de exemplo, mas aqui vou demostrar apenas algumas:
Pattern Rule Candle Green C > O Candle Red C < O Doji C = O Hammer (C > O and (C-O) *2 < O-L and (C-O) *0.5 > H-C) o
FREE

O indicador Smart Binary Volume é uma ferramenta versátil que combina análise de volume de negociação com machine learning. Ele pode ser aplicado em diversos mercados e estratégias, incluindo scalping e outros tipos de negociações de curto prazo. Utilizando algoritmos avançados de machine learning, o indicador identifica padrões complexos, gerando sinais de compra e venda com maior precisão. Buffer to Create EA. Buffer Line Gold = 0. Buffer Line Red = 2 Buffer AI = 3
AI Buffer >= 0 ("SI

GeoInfo5 is one of the most informative indicators, it displays basic information about a trading instrument in a compact form. The version for the Meta Trader 4 terminal has gained wide popularity among traders. The indicator is free and will always be free. The launch version is now available for MetaTrader 5 as well.
displays information about the main parameters of the tool in a brief form in the line in the upper left corner of the chart: Spread, Swap for Buy order, Swap for Sell order,
FREE

The Daily Highs and Lows Indicator is a versatile tool that combines support and resistance levels with real-time market dynamics. By incorporating previous daily highs and lows, it provides valuable insights into market psychology and identifies potential areas of price reversals or breakouts. With its ability to adapt to changing market conditions and customizable options, traders can stay ahead of trends and make informed decisions. This indicator is suitable for various trading styles and ti
FREE

Presenting the uGenesys Break of Structure and Change of Character Indicator The uGenesys Market Structure Indicator is the advanced solution designed specifically for forex traders seeking a competitive edge. This innovative tool goes beyond merely identifying Break of Structure (BoS) and Change of Character (CHoC); it also illuminates optimal entry and exit points on your forex charts, transforming your trading experience.
While the uGenesys Market Structure Indicator can reveal pivotal pa

Introducing the "Super Trend Filter Oscillator," your ultimate trading companion designed to enhance your technical analysis and help you make informed decisions in the financial markets. This innovative oscillator is crafted to provide valuable insights into market trends and price movements, assisting traders like you in identifying potential entry and exit points. Features: Trend Identification: The Super Trend Filter Oscillator excels in detecting prevailing market trends, whether they are b
FREE
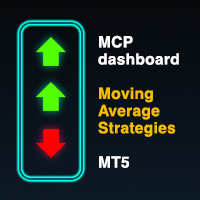
Multicurrency indicator in table format. Signals appear with confirmation, no repaints. Works on the current (open) timeframe. Notifications come for an open instrument. In the indicator settings, you can choose 1 of 4 Moving Average strategies. Strategies (represented in screenshots): Classic fast and slow moving average crossover Reverse signal of classic crossing (used for flat/sideways movement) Classic crossover relative to a slower moving average (Trend MA in settings) Price touching the f

MT4 Version Understanding market sentiment is a critical aspect of successful trading. Market sentiment refers to the overall feeling or attitude of traders and investors towards a particular financial instrument, such as a stock, currency pair, or cryptocurrency. It is a collective perception of market participants' emotions and beliefs about the asset's future price direction. Market sentiment can be bullish (positive), bearish (negative), or neutral (sideways). Knowing the market sentiment ca
ボリンジャーバンドは、価格変動を分析するためのテクニカル分析の1つのツールになります。
ボリンジャーバンドには、中心線と2つのバンドがあります。
中心線は、一般的には移動平均線(通常は20日間の単純移動平均)として計算されます。この中心線は、一定期間の価格の平均値を表しています。 ボリンジャーバンドのバンドは、中心線の上と下に等間隔で配置されます。通常は中心線から2つの標準偏差分だけ離れた位置に設定されます。 拡大(Expansion)とは、ボリンジャーバンドが広がる状態を指します。
つまり、上下のバンドが中心線から離れ、価格の変動範囲が広がっていることを示します。拡大は、相場が活発になり、価格の大幅な変動が起こりやすいことを示すことがあります。 収縮(Contraction)とは、ボリンジャーバンドが狭くなる状態を指します。
つまり、上下のバンドが中心線に近づき、価格の変動範囲が狭まっていることを示し、相場が方向感を失い、一時的に価格変動が鈍化していることを示すことがあります。 ボリンジャーバンドの収縮と拡大は、価格変動のパターンや相場の特徴を捉えるために重要な指
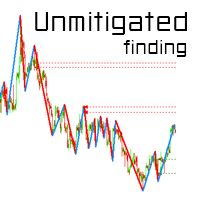
SMC Unmitigated Finding is a indicator for find unmitigated supply and demand in previous legs of price
Settings Zigzag Settings ZZDepth - by Default is 12.
ZZDeviation - by Default is 5.
ZZBackStep - by Default is 3. Horizontal Line Settings SupportColor- color for Support line.
ResistanceColor - color for Resistance line. Settings Num of Show - Number of Support & Resistance Show.

C300 SYNTHETIC INDICATOR 1MIN CHART Update V2 No repaint
*The indicator will not give a sell sign if the market conditions are not in place. *With all 3 strategy criteria in place the strategy based indicator signals 1-3 trades per day. *The drawdown can range to very high you need to place your own target profit and stop loss according to your risk management system . *The indicator is designed for only C300 and the 1min chart .
NB :Note this strategy based indicator will be free only f

Crash 500 indicator Update V2 No Repaint
This indicator works with a custom build in strategy The indicator will only give a sell sign when market conditions are in place. Only for sell. Apply own risk management target profit and stoploss. When market conditions are met the sell sign will indicate you to enter a sell position and you will have to apply your risk management system accordingly. This is only for Crash 500 market and only 1min chart
NB: Please note this indicator will be fr
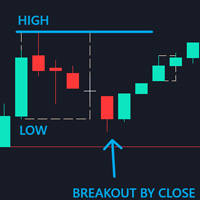
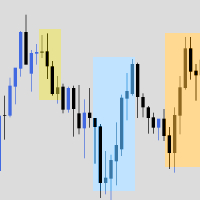
Control Candle is the candlestick which holds multiple inside bars and are in control until its high low range is broken by close of any candlestick. When control candle is broken, price may act on these control candle as support and resistance.
This indicator create rectangles on chart which will help you find control candles fast.
Control candle indicator box is customizable by color, style, width and other options in indicator settings.

3 candel indicator in 1 !!! The 3 most important candel indicator in 1 packadge. Help trader in chart visualisation, prevent reversal !!! Doji : Gravestone Doji, Long Legged Doji, Dragonfly Doji. Engulfing : Bullish, Bearish. Hammer : red hammer, green hammer. Fully parametrable indicator icon color config and alarm. Free life time update !!! Just try our demo for free.

Apresentamos o Didi Index Volume, um indicador de análise técnica desenvolvido pelo trader brasileiro Odir Aguiar, que se destaca pela sua abordagem avançada e poderosa na identificação de oportunidades no mercado financeiro. Disponível em diversas plataformas, o Didi Index Volume se tornou uma ferramenta essencial para traders em busca de insights precisos e informações valiosas para suas estratégias de negociação.
O indicador combina o conceituado Didi Index, criado por Odir Aguiar, com

Introducing the Kangaroo Hunter - Your Ultimate Edge in Forex Trading ATTENTION Forex Traders! Are you in constant pursuit of high-probability trade setups? Or maybe you're a novice trader struggling to pinpoint precise entry and exit points? Our solution, the Kangaroo Hunter, is about to revolutionize your trading journey. This meticulously designed indicator simplifies and refines the art of identifying the often elusive Kangaroo Tail patterns in the Forex market, pushing your trading strateg

Introducing the "Cybercycle Trend" Forex Oscillator, a powerful technical indicator designed to enhance your trading experience in the foreign exchange market. This innovative tool utilizes advanced algorithms to identify and analyze market trends, providing you with valuable insights and helping you make informed trading decisions.
The Cybercycle Trend Forex Oscillator is specifically designed to detect and measure cyclical price movements in the forex market. By incorporating this oscillato
FREE

To get access to MT4 version please click here . - This is the exact conversion from TradingView: "CM Super Guppy" by "FritzMurphy" - This is a light-load processing indicator. - This is a non-repaint indicator. - This is not a multi time frame indicator. - Buffers are available for the lines on chart. - You can message in private chat for further changes you need. Thanks for downloading
MT5インジケータ TC-Alerts 開発経緯:
実はFXで簡単に勝てる手法があるんです。 それは。。。 主要な(4時間足以上、4時間足、日足、週足)のレジスタンスとサポートラインの反発を狙う FXは一方向には進まず90%以上で 必ず、必ずと言っていいほど、 どこかで反発します 。そこは大抵主要なレジスタンスとサポートラインまたは主要なフィボナッチラインなのです。
なのでそこに水平線を引いて ただ待つ のです。そこに到達したら、1分足や5分足に落として
長いヒゲ、ダブルボトム、ダブルヘッド、トリプルボトム、トリプルヘッド、三尊、逆三尊などの反転の形成を確認してエントリーする。 または、こちらを使用して
https://www.mql5.com/ja/market/product/53987
強弱が弱くなってきたのを確認してエントリーすればいいのです。
これだけです。シンプルです!!
うまく行くと、長期足レベルでレジスタンスとサポートライン間、つまり頭から尻尾まで取れる可能性もありますし、リスクリワードが異常にいいです。
そのためには、チャートに主要なレジスタンスと

This indicator uses candlesticks with large real bodies to predict possible market structure shift. Displacement is a very powerful move in price action resulting in strong selling or buying pressure. Generally speaking, displacement will appear as a single or a group of candles that are all positioned in the same direction. These candles typically have large real bodies and very short wicks, suggesting very little disagreement between buyers and sellers. Often, a displacement will occur just af

Calculates the price change on each timeframe: floating or last closed bars.
My #1 Utility : includes 65+ functions | Contact me if you have any questions | MT4 version You can select the shift of the calculated basr: Floating (current) bars; The last closed (previous) bars; The type of price value can be selected using the blue switch on the top row: Pips; Market points; Percentage value (%); Price value; The method of calculating the bar size can be selected using the b
Market screener: Spread and Swap, for selected Symbols. You can customize the list: set only the Symbols (currency pairs) that are needed. The number of Symbols is unlimited. The list can be sorted in ascending or descending order (Symbol name). The panel can be moved to any place on the chart. You can also minimize the panel. Displayed values: Current market price (BID); Spread size; Swap, for Long positions; Swap, for Short positions; Overall P/L of the entire account; My #1 Utility : includ
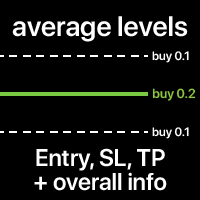
The average Entry, SL and TP levels of all trades on the Symbol. The levels can be calculated together, or separately for Buy and Sell trades. You can optionally display additional info: Level price, total Lot size, floating P/L. The styles and colors of the levels are customizable. My #1 Utility : includes 65+ functions | Contact me if you have any questions | MT4 version In the settings of the indicator, you can configure: Average Entry level: on/off; Average SL level: on/off; Average

Meet the Tweezer Hunter, an essential tool for every Forex trader looking to make accurate, trend-following trades. This powerful, intuitive indicator helps traders spot potential trend reversals before they happen, providing a significant advantage in the fast-paced world of Forex trading. The Tweezer Hunter is more than your average tweezer candle indicator; it's designed with a built-in trend identification feature that accurately detects whether the market is bearish or bullish. By integrat

ICT, SMC, Smart Money Concept, Suporte e Resistência, Análise de Tendências, Ação do Preço, Estrutura de Mercado, Blocos de Ordens, Blocos de Rompimento, Mudança de Momentum, Desbalanceamento Forte, HH/LL/HL/LH, Gap de Valor Justo, FVG, Zonas de Prêmio e Desconto, Retração de Fibonacci, OTE, Liquidez Compradora, Liquidez Vendedora, Vazios de Liquidez, Sessões de Mercado, NDOG, NWOG, Bala de Prata, modelo ICT.
No mercado financeiro, uma análise de mercado precisa é crucial para os investidores

The indicator displays a renko chart and a supertrend indicator in real time. After installing the indicator, the window will display the Renko chart and the supertrend indicator in the same window. This allows you to more clearly and visually see the entry and exit points when a trend reversal occurs. The signal to open a position is the intersection of the Renko candlestick of the supertrend indicator point and the appearance of the opposite signal of the supertrend indicator.
The indicator
FREE

The Game-Changing Engulfing Candle Hunter - Your Guide to Profitable Trend Trading
Step into the realm of trading possibilities with our revolutionary product - The Engulfing Hunter. Designed by traders for traders, this dynamic indicator combines the potency of engulfing candlestick patterns and the versatility of proprietary trend detection system, offering a trading edge unlike any other. Engulfing candlestick patterns have always been a revered tool in the arsenal of seasoned traders. Acti

To test the adviser, do you open a separate account for each of them? this is very inconvenient, but thanks to this indicator, this is no longer a problem!
Do not be too lazy to read the full description and do not close the page ahead of time, this indicator is needed by almost every trader, no matter if he trades with his hands or uses advisors.
Buying this indicator as a gift you will receive an adviser with not bad results.. if you have already received a gift from me from othe

Easy to use buy and sell signals with arrows. Non Repainting indicator. Non Lagging indicator. Down Arrows indicate sell and up arrows indicate buys. Works on any market and on any time frames. Arrow colors can be changed to match chart colors. Audible alerts. Periods can be changed to phase out false signals. Please remember to follow the trend like with any indicator.
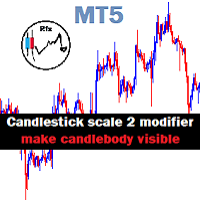
Chart Candlestick scale 2 zoom will visible instead of just a tiny unrecognized line make it look neat and tidy Instruction.
If you don't like the candles colors, you can do so by changing color. read below:
-Colors must be changed in the indicator setting.
-It won't change through the Chart properties to modify.
-After changing the color, save it as template so it wont change the colors to default value.
FREE

Smart Currency Strength is a powerful yet simple indicator that measures the strength of individual currencies.
It features a graphic panel that lists the main currencies and their strength in each timeframe, ranging from 0 (most oversold) to 100 (most overbought). The strength for all currencies in the current timeframe is also shown in a separate window as a multi-line graph, where each currency is represented with a different color, this allows you to monitor the evolution of strength tre

SourcePoint是一个很好的中长线交易指示器,他能独立使用,也可以去其他趋势型指标独立使用,可以很好的指出最佳的buy和sell位置,指标不含有未来函数,不会重新绘制,不仅能够应用到自己的手动交易过程中,还能完全可以写入到自己的EA中。建议配合BS TrendLine( https://www.mql5.com/zh/market/product/96476?source=Site+Market+My+Products+Page ) 一起使用。 (如果你感觉到这个指标能够帮助你进行更准确的交易,请帮忙给个好评,希望我的作品能够帮助更多有需要的人) ===================参数列表===================== fastP: 12 slowP:26 avgP:9 =================参考使用方法=================== 此指标可以适用于任何交易品种,能够用在任何周期。 每次形成一个交点,就是一个交易机会,同时也是一个持仓平仓点位。建议配合大小周期一起使用,这样更容易让你找到更精准的入场位置和出场位置

Moving Average Crossover Indicator. Add this Easy Indicator to your charts. The indicator indicates when to buy and when to sell. When the line is orange that is a sell signal. When the line is green that is a buy signal. Easy to use and colors can be changed so suit your charts. Easy to use. Follow the indicator and enter your buy and sell signals. Work on any market and on any timeframe.
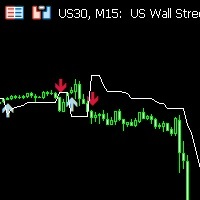
**Features:**
1. **Innovative Trend Tracking:** The UT BOT Simple Indicator leverages the power of the Average True Range (ATR), a renowned volatility measure, to calculate precise trailing stop values, providing unparalleled insights into market trends.
2. **Customizable Settings:** Flexibility is paramount in any trading strategy. With this in mind, our indicator allows you to adjust the ATR periods and other key parameters to tailor the tool to your trading style and strategy.
3. **Rea

Fechamento do Dia Anterior e Deslocamento de Barras para o MetaTrader! O Indicador de Fechamento do Dia Anterior e Deslocamento de Barras é uma ferramenta projetada para aprimorar a análise técnica e a tomada de decisões no trading. Com esse indicador, você terá acesso a informações detalhadas sobre os níveis de abertura, máxima, mínima e fechamento de qualquer barra, permitindo uma análise precisa e abrangente dos movimentos do mercado. Imagine ter a capacidade de colocar um timeframe dentro do
FREE

Estatísticas do painel da conta
É uma ferramenta que vai te ajudar a ter uma visão focada para saber os ganhos e perdas da sua conta, para que você possa acompanhar, também traz uma análise de rebaixamento para saber o risco obtido também Depois de baixá-lo e ativá-lo em sua conta, você deve anexá-lo a qualquer símbolo por exemplo EURUSD H1, a partir deste momento a ferramenta começará a monitorar suas estatísticas
o painel é completamente avançado, você pode ocultá-lo e movê-lo para onde q
FREE

Introducing our latest innovation in MetaTrader 5 indicators, designed to dramatically improve your trading workflow with high functionality and ease-of-use. It features a robust collection of features designed to help you streamline chart analysis and make the most of your trading decisions. Here's a quick rundown of its incredible features: Fast Drawing of Objects : Save precious time with the quick draw feature. With just a click of a button, you can create various trading objects on your ch

AI Channel, uma poderosa ferramenta que utiliza inteligência artificial para análise de canais de preço no mercado financeiro. Nesta sessão, vamos explorar como esse indicador revolucionário pode auxiliar investidores e traders na tomada de decisões mais informadas e estratégicas. Vamos lá! I. O que é o indicador AI Channel? O AI Channel é um indicador desenvolvido com base em avançados algoritmos de inteligência artificial. Ele utiliza dados históricos de preços de ativos financeiros para ident
FREE
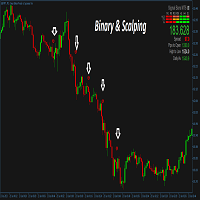
This is a trend following system for Binary options traders and forex scalpers. It is carefully crafted and recognizes periods of WATERFALL in the market and gives the trader the advantage and opportunity of riding with the momentum. It works on all timeframes and currency pairs especially high liquidity pairs. Avoid news events 15mins before and after. Always have your money management script or system in place. Tested on Deriv synthetics as well, please check screenshots. The mt4 version can b

JCAutoStm 简繁塞壬模型 1.Zigzag3浪,大中小三浪代表市场潮流、趋势、涟漪。 2.自动识别当前三浪的走势,命名每一种结构形态。 Zig123下跌3浪5浪7浪:D3/D5/D7,下跌中继形态:DRF1/DRF2/DRF3,底部反转形态:BRP1,BRP2,BRP3,特殊结构下跌5浪后底部反转结构Zig123D5BRP1/2 Zig123上涨3浪5浪7浪:U3/U5/U7,上涨中继形态:URF1/URF2/URF3,顶部反转形态:TRP1,TRP2,TRP3,特殊结构上涨5浪顶部反转结构Zig123U5TRP1/2 3.趋势线绘制,分别以大中小三浪相邻的高低点进行绘制。 绘制的原则是,收敛形态。 4.三浪有效SR,F3,F6,F12,F15,绘制水平线。 MACD背离线
FREE

Creating an Index: Importance, Customization, and Weighting Options for MT5 Trading Indicator Designing your index is crucial for efficient symbol tracking in the world of trading. With a powerful MT5 trading indicator, you gain the flexibility to construct an index that suits your preferences, whether it's an equal weighted or custom weighted one. Unlike widely-known indexes like the S&P 500, which heavily favor certain winners, this indicator empowers you to curate a basket of symbols and assi
The Scalper v2 will give you accurate guidance to trade with. It has indications with arrows and it sends notifications. This software was built based on the RSI,MACD,Martingale, Ema 50 and 200, Aligator, SMA 30,50, ADX, Volumes percent range, variable dynamics and fibonacci levels. all of these indicators have something in common, it allows analysis, support and resistance, accurate signals for buy and sell, overbought and oversold market analysis. I have combined all of these indicators into o
The Adaptive EMA consists of 3 lines: Yellow, Blue and Red If a yellow line appears, it means the market is entering Consolidation, Range, Contraction and no opportunities are available. If a Blue line appears, It means prices are accumulating, and now being marked up, so you are now entering a buy market with a strong Bullish trend. If a Red line appears, it means prices are now being marked down, price distribution is underway, so you are now entering a Sell market with a strong Bearish trend.

Bem-vindo ao Indicador Provlepsis
"Provlepsis" é um indicador altamente avançado projetado para o Mercado MQL. Ao analisar barras anteriores no mesmo horário do dia, ele calcula com precisão o potencial intervalo de movimento do mercado, fornecendo informações valiosas sobre futuras flutuações de preço. Ao contrário do indicador ATR tradicional, "Provlepsis" leva em consideração o fator tempo, resultando em uma ferramenta mais poderosa que se adapta às diferentes condições de mercado. Durante a
FREE

Super Trend Plus is a trading system that uses four Supertrends set with different parameters. The idea behind this system is that when three Supertrends move in the same direction, there is a strong trend confirmation, but entry occurs only when the fourth Supertrend also moves in the same direction as the other three. For example, the first Supertrend could be used with a volatility multiplier of 3 and a period of 10, the second Supertrend with a volatility multiplier of 3 and a period of 12,

This indicator uses the Zigzag indicator to identify swing highs and swing lows in the price chart. Once it has identified the swing highs and swing lows, it can use them to determine potential support and resistance levels. A support level is formed when the price drops and bounces back up from a swing low, indicating that there is buying pressure at that level. A resistance level is formed when the price rises and reverses downward from a swing high, suggesting selling pressure at that level.
FREE

O RFOC Symbol Background foi criado para exibir no fundo do gráfico o nome do ativo e o timeframe corrente.
A exibição do nome do ativo no fundo do gráfico é muito utilizada por traders que estão projetando a tela para espectadores, facilitando a identificação do ativo e o timeframe durante uma aula, por exemplo.
Está disponível para o usuário selecionar o tamanho da fonte (pequena, média ou grande) e selecionar a cor para melhor visualização de acordo com a cor do fundo do gráfico de forma
FREE

Smart Drawing Assist PRO MT5. Buttons will appears next to the selected object. The buttons are straightforward and amazingly easy to use. Features are as follow: Draw zigzag . Enabling you to draw patterns, draw zigzag, and draw shapes. All you have to do is click the button and start clicking point to point and it will draw automatically. Change object color . Rectangle/Trendline/HLine/Vline/Text/Price Arrow/Arrowed Line/ and your suggestion please. Flatten trendline . make a perfect flat line

O Indicador Técnico Graphic Alignment Context (GAC) mede a diferença vertical da média simples do preço de um instrumento financeiro no contexto de três diferentes tempos gráficos determinados por um número definido de barras ou velas (períodos) para determinar a força da tendência de compra ou venda. Preços médios ascendentes indicam força compradora (1), preços médios descendentes indicam força Vendedora (-1) e qualquer cenário diferente das duas condições anteriores indicam Neutralidade (0).
FREE

O Indicador Técnico Available Range Bands desenha no gráfico duas linhas indicando os limites (bandas) máximos previstos para compra e venda do período (vela) corrente. Estes limites podem ser acessados pelos buffers 0 e 1 respectivamente. Além disso, exibe no canto inferior direito os valores correntes da média da volatilidade real, o último preço, a faixa de movimento prevista disponível para compra (% e pontos) e a faixa de movimento prevista disponível para venda (% e pontos). O cálculo é si
FREE
The Volatility Proper Index indicator displays the volatility index of a trading symbol in a separate window.
To calculate volatility, the calculation of price deviations from the moving average is used.
Indicator parameters:
Period - the number of recent bars for which the volatility index is calculated.
MinThreshold - the minimum price deviation from the moving average, at which this deviation is taken into account in the calculations.
AveragePeriod - moving average period,
Saiba como comprar um robô de negociação na AppStore do MetaTrader, a loja de aplicativos para a plataforma MetaTrader.
O Sistema de Pagamento MQL5.community permite transações através WebMoney, PayPay, ePayments e sistemas de pagamento populares. Nós recomendamos que você teste o robô de negociação antes de comprá-lo para uma melhor experiência como cliente.
Você está perdendo oportunidades de negociação:
- Aplicativos de negociação gratuitos
- 8 000+ sinais para cópia
- Notícias econômicas para análise dos mercados financeiros
Registro
Login
Se você não tem uma conta, por favor registre-se
Para login e uso do site MQL5.com, você deve ativar o uso de cookies.
Ative esta opção no seu navegador, caso contrário você não poderá fazer login.