Conheça o Mercado MQL5 no YouTube, assista aos vídeos tutoriais
Como comprar um robô de negociação ou indicador?
Execute seu EA na
hospedagem virtual
hospedagem virtual
Teste indicadores/robôs de negociação antes de comprá-los
Quer ganhar dinheiro no Mercado?
Como apresentar um produto para o consumidor final?
Pagamento de Expert Advisors e Indicadores para MetaTrader 4 - 225

The Signal MACD product is an indicator that works with the standard MACD indicator. This indicator is designed to do signal trading using the objective MACD indicator and a set of algorithms. This indicator can be used both as an oscillator and as a signal producing product. So you can use this indicator in two goal. When the indicator finds a signal, it shows arrow marks on the oscillator. These arrows allow investors to trade.
Trade Rules "Buy" action when you see a green arrow and receive

A powerful assistant for manual trading. Execute a deal with one click and manage the trade volume, stop loss and take profit, according to your trading strategy, without being distracted from the chart. The product can also visually preview your levels of entry into the market, stop loss and take profit before placing an order.
Advantages easy and intuitive interface the control panel in real time 3 modes of setting the order volume 6 stop loss setting modes 5 profit take setting modes calcul

This EA is the 28-common-pairs Scanner in the Forex Market. It based on the theory of 123 Pattern with a set of SMAs, Heiken Ashi for detecting Trade signals. You can choose any time frame to scan as you like.
123 Pattern Theory Buy Condition: Fast MA is above Slow MA (Uptrend confirmed) while Heiken Ashi pull back and begin to continue going up with the trend. Sell Condition: Fast MA is below Slow MA (Downtrend confirmed) while Heiken Ashi pull back and begin to continue the downtrend. (Attac

Este indicador de vários símbolos e períodos de tempo verifica os seguintes padrões de velas (por favor, veja a captura de tela para uma explicação dos padrões): Três soldados brancos (reversão> padrão de continuação) Três corvos negros (reversão> padrão de continuação) Greve de três linhas de alta e baixa (padrão de reversão) Os padrões não aparecem com muita frequência em períodos de tempo mais altos quando a opção restrita nas configurações do indicador está habilitada. Mas quando o fazem, é

MIRA is an Expert Advisor built according to the principles of indicator-less short-term trading based on martingale with different protection levels and customization. It provides methods for reducing risks by fixing a part of profit by trailing stop, smoothing out the gaps by means of dynamic locking, automatic recovering from drawdowns, buying out losing positions. A strict risk management system allows setting a limit on the allowed drawdown both as a percentage and in the deposit currency.

The indicator operates based on a unique candlestick pattern. When the indicator generates a signal, there is a high probability of price reversal, and we can use it in trading.
Indicator use strategy Market entry should be performed at the closure of the signal candlestick. Stop Loss should be set behind the signal cloud. We will have two take profits, the first one is equal to the stop loss value, 50% of lot amount should be closed at this level, and stop loss should be moved to breakeven. T

Signal Lock Scalper is a signal-based scalper with locking of unprofitable orders , followed by subsequent transfer to breakeven using profitable orders . The EA trades the trend strategy with the use of original built-in indicator for opening and closing orders. To protect the deposit from unexpected circumstances, the EA provides the ability to either lock all orders when reaching the specified drawdown levels, as well as setting a fixed stop order as an oppositely directed pending order. Ther

Samurai Scalping Indy is indicator signal strategy trading with Heiken Ashi, Smoothed Moving Average, and Ichimoku. It'll alert signal with an audio or pop up on the chart for Entry BUY/SELL and Exit BUY/SELL alert signal. Helpful for your system trading. Its easy use to filter major trend and help for scalping strategy to follow the trend. You can ON/OFF audio alert signal on the chart, Notifications alert on mobile, Email message alert. (Setting the alert on Mobile/Email in MT4. Go to Tools >>

Multiple RSI indicator works based on the standard RSI indicator. This indicator will display the RSI indicator from different timeframes on one screen. You will see the RSI indicator for all timeframes on one screen. This indicator saves you from constantly changing charts. At the same time you can analyze the operations of other graphs relative to each other.
Features This indicator shows the RSI graph of the timeframe you are working on and the upper timeframe graphs. For example, if you ru
Introduction to Double Harmonic Volatility Indicator Use of the Fibonacci analysis for financial trading can nearly go back to 85 years from today since the birth of Elliott Wave Theory by R. N. Elliott. Until now, traders use the Fibonacci analysis to identify the patterns in the price series. Yet, we could not find any one attempted to use Fibonacci analysis for the Volatility. Harmonic Volatility Indicator was the first technical analysis applying the Fibonacci analysis to the financial Volat

It is a simple indicator showing the moments of intersection of two Moving Averages, and it can be an indefensible tool for use in some trading systems. When the MAs intersect, the indicator draws arrows in accordance with the crossover direction and generates and alert.
Indicator parameters Period Fast MA - fast Moving Average period; Period Slow MA - slow Moving Average period; Method MA - Moving Average method; Apply to - price used for MA calculation; Alert - alert; Number of history bars
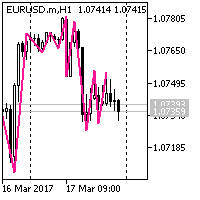
The ZigZag works as follows: On the left part of the chart, it finds a pivot point with the NumderOfBars parameter, which is a bottom. If the price action draws a top with the NumderOfBars parameter after this bottom, then the ZigZag draws a line from the bottom to the top. If the price action makes a new deeper Low, without forming a top, then the ZigZag extends the descending line to the new bottom. If the pivot point with the NumderOfBars parameter on the left side of the chart is a top, the
Ultimate Pips Recovery ( UPR ) is a unique, high quality and affordable trading tool, which is easy to use because knowledge of Forex trading is not much required to use this Expert Adviser. UPR does not require a specific time frame because it uses the technique that at every point, market will either go bearish or bullish. It opens a trade(say a buy trade) and immediately opens a sell stop position with a higher calculated lot size whose take profit is the same as stop loss of the previous ope
Price Line EA is an utility designed for manual trading. This expert advisor offers the ability to trade in automatic on your favorites levels. Default levels are created on chart when you upload the expert and after you can move them to your selected levels. When the market reaches the price levels, it opens orders. This algorithm allows an increase on risk management to grow your exposure. The utility opens operations with stop and reverse strategy, so place the levels on an important market r
Saint Volume Trader EA consists of the two sets of strategy. When "read volume" parameter is on, the EA trades with special build-in software to extract volume data from the data provider. Data provider updates real time data for every two minutes. When "read volume" set to false , the EA trade with standard MetaTrader 4 volume indicator. Both strategies have the same concept to read aggregated volume figures from the standard MetaTrader 4 volume indicator or data provider on a certain timeframe

The trading panel (EA) is intended for the fast and convenient closing of orders in the MetaTrader 4 terminal. It is a trader's assistant allowing to automate routine actions. The "Close" button closes all orders on the symbol of the chart, on which the EA is running. The "Close all" button closes all orders (on all symbols) which are open in the terminal. The EA does not work with pending orders. If closing fails, the EA displays the full error information on the screen. Also the EA shows the t
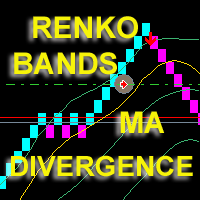
The Expert Advisor displays on a chart renko bars, Bollinger Bands and Moving Average indicators drawn based on Close prices. The EA opens and maintains trades based on divergence. Price peaks are determined when renko bars exit outside the Bollinger bands and move back. A sell trade is opened when the next price peak exists the borders of the upper Bollinger band and is higher than the previous one, and the divergence between the middle Bollinger line and the moving average is less than the poi
This is a risk management tool for your account. It shows the drawdown information on the chart. You can change the size and color of the text on the chart. You can install it on many charts at the same time. Please contact me if you have any problems with it and you can request some other essential features. Version for MetaTrader 5: https://www.mql5.com/en/market/product/23781
Parameters Size - Size font. Color - Color char.

Este é um indicador de alerta de barra Pin de vários períodos de tempo. Você pode usar apenas o período atual ou todos os períodos de 1 minuto até o mensal.
Ao escolher todos os prazos, você recebe um alerta sobre o prazo atual em que seu gráfico está aberto e os prazos acima.
Há alertas pop-up, e-mail e notificação push para cada período escolhido separadamente.
O indicador coloca uma seta no gráfico de preços. Para a barra de alta/Long Pin está abaixo da linha de preço, para a barra de
Gann Grid O indicador exibe as linhas de Gann para um dia. Funciona apenas em períodos menos diários. Descrição das configurações do indicador: Count_Bars - o número de barras diárias para exibir as linhas de Gann. Se = 0, é exibido em todo o histórico da barra disponível. scaleGann1 - escala para a linha # 1 (número de pontos por barra) clrGann1 - cor da linha # 1 styleGann1 - estilo de linha # 1 widthGann1 - largura da linha # 1 scaleGann2 - escala para a linha # 2 clrGann2 - cor da linha #

O ChartChanger é uma ótima ferramenta utilitária para reduzir o número de gráficos abertos em seu terminal. Há três seções: Símbolos, Prazos e Modelos. Você precisa apenas de um gráfico para ser aberto e ainda assim pode rolar até vários. Símbolos: Com o apertar de um botão você pode mudar de um símbolo para outro, e seus indicadores aplicados permanecerão no próximo gráfico. Para os símbolos existe um modo de detecção automática, ou você pode inserir manualmente os desejados. Você pode usar tod

The EA "Opposite" is a full automated trading expert. The EA uses the hedging strategy as follows: He opens a buy and a sell position at one moment and closes one of the positions after reaching the take profit. Then he opens again two orders in two directions, but in one direction the lot size is bigger than in the other one. Thus one has two possibilities: Either one takes the profit in the direction with less lot size or one takes the profit in the direction with bigger lot size. In the last

Future Candle Two Candle is an arrow indicator of candlestick patterns, based on the calculation of historical statistics. It identifies and calculates patterns consisting of two candles.
Advantages of the indicator Gives information about the next candle right now; The indicator values are based on statistical data on the history of the current instrument; Forecasts and displays the result of trading based on its signals; The colors of the indicator have been selected for a comfortable operat

Future Candle One Candle is an arrow indicator of candlestick patterns, based on the calculation of historical statistics. It identifies and calculates patterns consisting of one candle.
Advantages of the indicator Gives information about the next candle right now; The indicator values are based on statistical data on the history of the current instrument; Forecasts and displays the result of trading based on its signals; The colors of the indicator have been selected for a comfortable operati

Future Candle Three Candle is an arrow indicator of candlestick patterns, based on the calculation of historical statistics. It identifies and calculates patterns consisting of three candles.
Advantages of the indicator Gives information about the next candle right now; The indicator values are based on statistical data on the history of the current instrument; Forecasts and displays the result of trading based on its signals; The colors of the indicator have been selected for a comfortable op

Este indicador de vários períodos de tempo e vários símbolos pode identificar as 5 cruzes a seguir: quando uma média de movimento rápido cruza uma linha de média de movimento lento. quando o preço atingiu uma única média móvel (fechado acima / abaixo ou saltou). quando uma formação de média móvel tripla apareceu (todos os 3 MA: s em alinhamento consecutivo). quando a linha principal MACD cruza a linha de sinal. quando a linha de sinal cruza a linha MACD zero (0). Combinado com suas próprias regr

Requirement for the EA use: the EA needs a low spread (recommended spread value is 2) and minimum slippage! The EA is a system that trades the signals generated by the following indicators: Bollinger Bands, Stochastic and Moving Average. The EA works from 00:05 to 08:00, terminal time. By default, all orders are closed at 23:59 (can be modified). Important!!! The EA operation start time should match the American trading session close time, while the operation end time should coincide with the E

This long-term trading system works on 10 pairs and M5 timeframe. It uses various trading systems, such as trend trading, countertrend trading and others. This increases the chances of sustained growth and reduces exposure to a single pair or individual operations. The risk is very controlled. The settings are very simple, there is no need to change them. Optimization is not required as well. Realistic management of internal adjustments. Instead of trying to find the exact values that fit the h

Price Action Breakout is one of the most popular trading strategy. This Price Action Breakout indicator is designed using several indicators combined to be one strategy. It is very useful for traders that trade based on the breakout strategy. It will make it easier to identify the support and resistance levels. This Price action indicator will draw the support and resistance levels on the chart, so it will make it easier to identify the support and resistance levels. It will inform about the sup

The Effort and Result indicator is based on the work of Karthik Marar; a volume spread analysis trader. It compares a price change (Result) to the volume size (Effort) for a certain period. By comparing the effort and result, we can get more information about the future price movement. Both values are normalized and converted to a scale of 0 - 100 % based on a selectable look-back period.
This indicator is also known as the Effort Index.
The law of effort and result The law of effort v

This Script Shows your Account & Symbol information which you use on your graphics. These are: Account Information Number Name Currency Server Leverage Stop Out Level Balance Information Balance Equity Margin Free Margin Symbol Information Symbol Lot Size Min.Lot Lot Step Max.Lot Tick Value Tick Size Spread Stop Loss Level Swap Long Swap Short Initial Margin Maint.Margin Required Margin Trade Allowed

The Avato is one of our standalone tools. (A Signal based on it will also be provided on Mt4 Market in the future). It is designed around a combined form of hedging and martingale techniques and uses sophisticated algorithms and filters to place the trades. It uses Stop loss and Take profit levels while Lot size is calculated automatically following the according multiplier settings. We consider it a toolbox for every seasoned trader. Made with Gold market in mind, it can be tested in other inst

Area 51 EA generates signals on different strategies. Has different money management strategies and dynamic lot size function. When a position is opened, it is equipped with a take profit and a stop loss. If the position becomes profitable, a dynamic stop loss based on the specified values (TrailingStep and DistanceStep) will be set for it and constantly trailed. This allows you to always close positions in profit. If you want, that your manual opened positions will be handled by the EA, so you

The program is designed for copying your successful orders. The price is often fluctuates within a channel. But there is no time to monitor the terminal and place the next orders, especially if it happens at night. Place an order, when it closed with profit, the program repeats your order as a pending limit order. This will continue until the order closes with a loss, or the price goes too far away and the pending order will not trigger. An offset is provided for inclined channels. The order wil

SRP (Strong Retracement/Reversal Points) is a powerful and unique support and resistance indicator. It displays the closest important levels which we expect the price retracement/reversal! If all level are broken from one side, it recalculates and draws new support and resistance levels, so the levels might be valid for several days depending on the market!
Key Features You can use it in all time-frames smaller than daily! Displays closest significant support and resistance levels Update the l

Djinn EA is a fully automated trading robot. Djinn expert system analyzes situation on the market and opens positions in a trend direction. The EA is optimized for GBPUSD pair. When used on H1 chart it is prepared to gain profit in long-term period. Recommended charts are M1 and H1.
Settings Lot - volume of the opened position MaxTrades - maximum number of opened buy or sell trades Maxspread - maximum allowed spread Global_TakeProfit - set to True if you want to automatically close orders when

The indicator allows you to quickly switch from one instrument to another, from one time period to another using the keyboard or buttons on the monitor. Each command can be assigned a hot key from 0-9, a-Z (case-insensitive) and VK_OEM_COMMA ("<" on the keyboard) and VK_OEM_PERIOD (">" on the keyboard). This can help you to operate the maximum number of instruments that are available at your broker, analyze more instruments/periods in less time. This product cannot be tested in the tester , beca

Pivot trend indicator is a trend indicator that uses standard pivot calculation and some indicators. The purpose of the indicator is to calculate the possible trends using the pivot point. And to give the user an idea about trend direction. You can use this display as a trend indicator. Or with other indicators suitable for your strategy.
Features The green bar represents the upward trend. The red bar represents the downward trend. The blue pivot point represents the upward trend. The yellow p
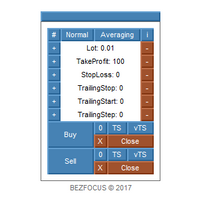
Trading panel for scalping.
Features Two languages (English, Russian). Adjustable panel scale. Two color schemes. Virtual trailing stop. Trailing stop. Averaging.
Parameters Lot - lot size. Lot Button Step - step for changing the lot size using buttons. Take Profit - take profit. Take Profit Button Step - step for changing the take profit using buttons. Stop Loss - stop loss. Stop Loss Button Step - step for changing the stop loss using buttons. Trailing Stop - trailing stop. Trailing Stop B

The YFX Symbol Watermark indicator is used to display a watermark on your chart, which makes it easy to see at a glance the symbol information for any chart. The displayed information includes: Symbol Name and Timeframe on the chart Description of the currencies Tag line, which can contain any user-defined information All the information can be displayed on the chart so that it can be easily read. The indicator also has parameters that can be set to customize which information is displayed. Para

MACD ColorBars paints bar frames according to a trend, as well as changes the histogram color when MACD bars are rising or falling (if Color Bars is enabled in the inputs window). The growth of bars indicates a divergence between the fast and slow moving averages, while the decrease indicates their convergence.
Parameters
Fast Moving Average - period of the fast moving average; Slow Moving Average - period of the slow moving average; MA method - moving average smoothing method (simple, expone

Measures the length of the selected movement in points, shows the duration of the movement, as well as the speed of movement. Outputs the average value of each dimension.
It is designed to calculate the expected target based on typical market movements.
The intended goal will provide information about the ratio of the stop size to the possible profit and will allow you not to open positions with a small expected profit.
It will also help you determine the point at which it is more logical t

Twins RSI Oscilador baseado no indicador RSI. Definições: Preço - o preço usado. Pode ser um dos seguintes valores: PRICE_CLOSE - preço de fechamento; PRICE_OPEN - preço de abertura; PRICE_HIGH - o preço máximo para o período; PRICE_LOW - preço mínimo do período; PRICE_MEDIAN - preço médio, (alto + baixo) / 2; PRICE_TYPICAL - preço típico, (máximo + mínimo + fechamento) / 3; PRICE_WEIGHTED - preço de fechamento ponderado, (máximo + mínimo + fechamento + fechamento) / 4. RSI_PERIOD - período mé
YTG cci Oscilador com níveis dinâmicos baseados no indicador CCI. Definições: CciPeriod - período médio para cálculo do indicador. Preço - o preço usado. AvgPeriod - período médio para calcular a suavização do indicador. AvgMethod - método de média para calcular a suavização do indicador. MinMaxPeriod - período para calcular os níveis dinâmicos. _levelUp é o valor de nível superior. _levelDown é o valor de nível inferior.
Eureka OpgtsFx is a Custom Indicator created to alert the trader when there is a cut-across trend correlations from Daily (D1) to Monthly (MN) Time frames with the belief that the major trend dominates the market and also save the traders from being eaten for breakfast by the big dogs in the financial industry. This indicator is suitable for both the Swing and the Long term Traders due to their peculiar styles of trading and waiting for days, weeks or probably months before taking their profits

The PriceAction_Helper indicator automatically recognizes Japanese candlestick patterns on charts. The indicator marks the location of a candle pattern and indicates the most likely price direction based on that pattern.
Who can use the indicator If you are a novice in trading Japanese candlesticks, PriceAction_Helper will help you detect patterns, demonstrate how they work and enable you to memorize candle pattern types and names. If you are an experienced trader familiar with Price Action, t
Auto-closing a trade using candle Сlose price based on a timeframe opened.
No need to set TP/SL point Make sure connection and PC are always ON (I recommend using 99.9% up-time VPS) Only support for one direction ticket only, if buy and sell ticket exist at the same time, the EA will not activate The EA will automatically activate if the conditions are met
Input NumberOfTry - number of retries if order trigger failed
Condition For Buy Ticket Blue line must be ABOVE the current price Blue l

The trend beads indicator is software that does not include trend indicators such as moving average, Bollinger bands. This indicator works entirely with price and bar movements. The purpose of the indicator is to calculate the most likely trends. To assist the user in determining trend trends. The user determines the trend direction with the colors on the screen. You can use this indicator alone as a trend indicator. Or with other indicators suitable for your strategy.
Trade Rules Rising trend

Golden Monowave is monowave indicator, the monowave theory is one of Elliott wave approach and one of most complicate and accurate method. Golden Monowave can shortcut many major steps to identify and describe the monowave. It works on any timeframe and with any trading instrument, including currencies, indices, futures, etc.
Input Parameters initial_Bars - set the initial number of bars to calculate. wave_color - select the color of the wave. label_color - select the color of labels. temp_lab
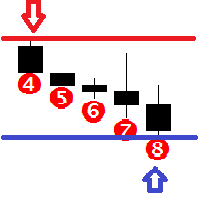
Features This indicator determines consecutive bullish and bearish bars; Determines the High and Low for the last N bars (N can be changed in the settings); It shows the Buy and Sell signals based on the values of other indicators, such as Bollinger Bands, Stochastic and MACD; It graphically displays from 4 to 12 consecutive bullish and bearish bars with an alert; It is possible to disable the alert and unnecessary graphical elements; It is also possible to adjust the number of bars in history,

Super Trend Bars is a trend finding indicator. It tries to find the trends that are most likely to trend. A set of indicators and a set of algorithms. Trend probability changes color when it finds a high trend. The red color represents the declining trend. The lime color represents the upward trend. Super Trend Bar changes color when it finds a trend.
Features This indicator is a trend indicator by itself. It can operate without the need for additional indicators. When you see the first lime c

Background It only needs a small initial deposit. Suitable for multi-currency trading. Real account monitoring: https://www.mql5.com/en/signals/294440
Operation Principle The EA opens orders based on a built-in indicator. The EA determines the order with the greatest negative profit each tick. Then the determines the total profit of Buy and Sell orders on each currency pair. If the total profit of Buy or Sell orders on each currency pair plus the amount of the order with the greatest negative
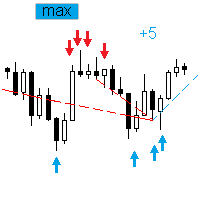
The Expert Advisor trades the signals from an artificial neural network with one hidden layer. Presence of a signal is checked at the closing of the specified period. MAIN PARAMETERS Net option - setting the order grid. When placing a market (not pending, Pending order offset=0 ) order according to a signal, the grid order is set. The following direction are available: follow the trend , against the treand and both directions . The number of placed orders is taken from the ...maximum deals with
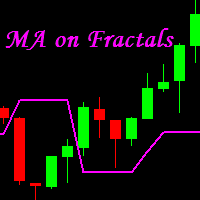
MA on Fractals is a professional trend-following indicator for MetaTrader 4 . It builds a moving average using Bill Williams' fractals. We believe that MA on Fractals is much more efficient than a standard moving average. Its combination with other indicators allows receiving more accurate trading signals. It is most suitable for M15, M30, H1 and H4.
Advantages Unique indicator. Generates minimum false signals. Suitable for beginners and experienced traders. Simple and easy indicator configur

The EA consists of multiple virtual Prototype-1 robots (up to 100 strategies depending on the currency pair). Each strategy has different settings. Once the lot sizes for all strategies are calculated, the EA obtains the resulting trading lot. The operation principle is trading within a corridor. When leaving the corridor, the EA closes the positions and saves them for opening in the future. The best condition for trading is a flat, the worst condition is a long trend without rollbacks. Recommen

The Expert Advisor of the Forex Fraus family, the system is designed for scalping and adapted for the accounts with fast execution of orders.
Operation Principle It buys and sells based on the values of the internal indicator; When a signal is received, the orders are opened by injection, using tick data; Always sets a stop loss; Positions are closed by Trailing Stop; Not closed positions are closed at the opposite trade; Built-in adjustable risk management block. Depending on the balance, it

"The Niffler is a fluffy, black and long-snouted beast. This burrowing creature has a predilection for anything glittery. Nifflers are often kept by goblins to burrow deep into the earth for treasure." Newt Scamander, "Fantastic Beasts and Where to Find Them". Niffler is a multicurrency trend trading Expert Advisor based on moving averages. A classic seasoned with the magic of modern technology. Niffler uses SMA, EMA, LMA, SWMA, HMA, AMA, TMA, EPMA and RMA on the timeframes M15, M20, H1, H3, H6,

The super oscillator trading system is a trend finding tool. This system consists of a few indicators and a few algorithms. The aim of this indicator is to direct the investor to find healthy trends.
Trade Rules This indicator has two channel lines. These channels are red lines below zero and above zero. There is a line in two places to process. These are blue lines. There is one trend line, the yellow line. Up trend rules Rule 1 - the yellow trend line should close below the red line below th

The EMA Trend indicator is a trend indicator using two moving averages. These two moving average is the main trend indicator with 89 EMA. 89 EMA is generally regarded as a trend in the Forex market. The second moving average is 49 EMA. A trend was created using two moving averages. You can use this display alone as a trend indicator. Or with other indicators suitable for your strategy. This indicator sends a warning every new trend starts.
Features You can select and edit the periods. Time fra

Range bands works the same way as Bollinger bands except that they are self adapting, with range trading in mind. Unless you are familiar with Bollinger bands, it is a standard deviation indicator that is based around the concept that when price deviates to quickly from the average, it's going to encounter resistance. This is true for all period settings, since standard deviation 2 or 3 is an extreme on any data. This indicator automatically chooses the period that is currently most suitable for

Olofofo Fx Scanner is a Custom Indicator created to scan through the currency pair it is being attached to in the market on ALL time frames simultaneously from a Minute to Monthly looking for just 3 things that make Forex trading exciting and worthwhile to invest in. Once these are found, it alerts the User immediately for a timely action on the part of the Trader. This is a self-fulfilling prophecy of the market, meaning that even if you are a newbie, by the time you see the graphical display o

This simple indicator helps defining the most probable trend direction, its duration and intensity, as well as estimate the possible range of price fluctuations. You can see at a glance, at which direction the price is moving, how long the trend lasts and how powerful it is. All this makes the indicator an easy-to-use trend trading system both for novice and experienced traders.
Parameters
Period - averaging period for the indicator calculation. Deviation - indicator deviation. Lag - calculat
Drawdown Control (DC) is a helpful utility that can be used like an EA to limit the drawdown of any MT4 account . You can choose between different, fully customizable options of how DC must react if the drawdown reaches critical levels. To utilize the symbol with the most ticks per minute it is highly recommended to put the product on a EURUSD-M1 chart.
Input Parameters Equity / Balance in % to stop trading (0 = disabled) : 85.0 [etc.] Current Balance / Initial BalanceHW in % (0 = disabled) :

Real Trend Lines is an indicator that calculates trends using a set of channels and using a set of algorithms. This indicator helps to find trend return points. It generally represents an oscillator. This trend tracking system helps the investor to understand small or large trends and determines the direction according to it.
Trending features Up trend Rule 1 - yellow trend line should be below zero level. Rule 2 - the yellow trend line should be in the green and orange channel. Rule 3 - the t

Ideally, this is we hope : The good numbers on news should make the related currency become stronger, and the bad numbers on news should make the related currency become weaker. But the fact is: The good numbers on news that has been written on the economic news calendar could not always instantly make the related currency become stronger. and vice versa, the bad numbers could not always instantly make the related currency become weaker. Before placing new position: We need to know which actuall

This tool is developed to make your trading risk and profit management easier. It is able to move all of your opened transaction's take profit and stop loss on to one similar price.
How to use Draw a trend line/horizontal line and name it to "tp_" as the take profit line and "sl_" as the stop loss line. The EA will modify all of your orders' and pending orders' take profit and stop loss to the given line. You can drag the gray box to drag the line. You can see the risk in the account currency

If you would like to trade reversals and retracements, this indicator is for you. The huge advantage is that the indicator does not have input parameters. So, you will not waste your time and will not struggle to change them for different timeframes and symbols. This indicator is universal. The green triangle represents a possibility to go long. The red triangle represents a possibility to go short. The yellow dash represents a "non-trading" situation. This indicator could be used on M1, M5, M15
This is a fully automated multi-currency Expert Advisor with unlimited number of currency pairs using MACD and Envelopes indicators. You can specify how the EA should work with each currency pair. You can add orders manually. The free version is available here .
Parameters Common TradeObjectsDelete : delete trade objects. OrderPanel : display the panel for opening orders. TradeToBalance : target balance to stop trading. The parameter is triggered only after all trades are closed. Otherwise, i

Descrição do software Este indicador pode exibir 1 ou 2 indicadores MACD em diferentes intervalos de tempo e configurações. Existe uma versão GRATUITA que utiliza a EMA para cálculo. Esta versão Pro usa todos os 4 tipos de média móvel para cálculo: simples, exponencial, suavizada e linear ponderada. Os indicadores ativos podem fornecer alerta pop-up, sonoro, push ou por e-mail. O alerta da versão gratuita apenas no cruzamento de nível zero, este alerta da versão Pro pode ser definido como cruza

This is the multi-time frame Fisher Divergence indicator for MetaTrader 4, with signal arrows and a Signals panel which is freely movable showing the last signals and their time in color. The indicator draws some lines based on signal time. On the time frames below H4, the indicator scans for H4 divergence signals and draws it on chart with thick trend lines, and also it draws arrows for them. And also it scans the current time frame and draws a line at divergence location and places signal arro
O mercado MetaTrader é um espaço, sem precedentes, para negociar robôs e indicadores técnicos.
Leia o artigo Manual do usuário da MQL5.community para saber mais sobre os serviços exclusivos que oferecemos aos traders: cópia de sinais de negociação, aplicativos personalizados desenvolvidos por freelances, pagamentos automáticos através de sistema de pagamento e a rede em nuvem MQL5.
Você está perdendo oportunidades de negociação:
- Aplicativos de negociação gratuitos
- 8 000+ sinais para cópia
- Notícias econômicas para análise dos mercados financeiros
Registro
Login
Se você não tem uma conta, por favor registre-se
Para login e uso do site MQL5.com, você deve ativar o uso de cookies.
Ative esta opção no seu navegador, caso contrário você não poderá fazer login.