Conheça o Mercado MQL5 no YouTube, assista aos vídeos tutoriais
Como comprar um robô de negociação ou indicador?
Execute seu EA na
hospedagem virtual
hospedagem virtual
Teste indicadores/robôs de negociação antes de comprá-los
Quer ganhar dinheiro no Mercado?
Como apresentar um produto para o consumidor final?
Expert Advisors e Indicadores para MetaTrader 4 - 297

Introducing the Trading Masterpiece: Vikopo Grid ADX Designed by the World's Top Traders :
With 15 years of trading experience in global financial markets , our team has created this robot for both professional and beginner traders. Vikopo Grid ADX offers excellent performance and unique features, making it a powerful tool for your success. Why Choose Vikopo Grid ADX? 1️⃣ Guaranteed and Sustainable Profitability : Over 300% profitability in the past year with a reasonable 10% r

Seu Companheiro Definitivo no Mercado Forex. Focado exclusivamente no par de negociação GBP , QuadroFX aproveita o poder de M15 , o intervalo de tempo otimizado, para navegar pelas complexidades do mercado. Ele é meticulosamente projetado para embarcar em negociações de intervalo, mergulhando profundamente nas intricâncias dos movimentos e padrões do mercado. Estratégia QuadroFX: embora não possamos compartilhar detalhes exatos, aqui estão os fundamentos: QuadroFX aproveita a divergência do MAC

Finding a REAL profitable trading strategy online is like searching for a needle in a haystack. There are simply too many pitfalls in backtesting to “decorate” a good result. We are a team of proficient traders and engineers who have built this trading system to deliver consistent profitability in live trading . We use this system to trade REAL money for ourselves and our clients. Proven Performance : Over the past year, this strategy has achieved a 70+% gain on a LIVE account with a 10,000 init

"Aurus Gold" is a program capable of automatically analyzing and trading on the currency market (Forex) without human intervention. This innovative tool for decisions on buying or selling currency pairs.
The main task of Aurus Gold is to maximize profits and minimize risks for investors. It is capable of working around the clock, based on pre-set parameters and trading rules.
The main advantages of using a currency robot include:
1. Automation of trading: The ability to carry out transactions
This is the Super Trend Dashboard MT4. This dashboard will scan multiple timeframes in MT4 platform, from M1 chart to D1 chart. It will send the buy/sell signals by alert on the platform or sending notification to your phone or message you via a email.
The buy signal is generated when the super trend line flip from SELL to BUY. The sell signal is is generated when the super trend line flip from BUY to SELL.
The up trend color will be displayed depending on the current Super Trend value.
Индикатор LiquidityDWM отображает на графике не перекрытую дневную, недельную, месячную ликвидность и предназначен для определения предрасположенности направления ценового движения. В концепции движения цены рынок всегда стремиться в сторону ликвидности для ее снятия, поэтому для торговли очень важно знать рыночную предрасположенность движения цены. Индикатор LiquidityDWM покажет вам самые важные уровни ближайшей ликвидности, куда стремиться рынок в первую очередь. Знание первоочередной цели д

DCA FIFO
Com base no Dollar Cost Averaging (DCA) aplicado no mercado dos EUA com o FIFO (First In - First Out)
Característica:
Gama flexível: gama fixa, gama de expansão automática
Método do volume: volume fixo, volume múltiplo, volume como entradas
Posição de saída (SL e TP) por passo FIFO, entrada primeiro -> saída primeiro, entrada por último - saída por último
TP automático por preço oculto, NÃO enviar o preço TP como preço pendente para o servidor
Auto Trailing Stop, Trailing hidden

Welcome to PPulse EA, an advanced auto trading expert advisor designed to enhance your trading strategy with precision and efficiency. PPulse EA leverages sophisticated algorithms and essential filters to ensure you make informed and profitable trades, specifically optimized for trading Gold (XAUUSD) on the M5 time frame. Live Trade PPulse EA at MQL5: here Group Support: MQL5 - PPulse EA Key Features: Single Entry Trading Style : PPulse EA focuses on single entry trades, either buy or sell, ba
This is the Heiken Ashi Dashboard MT4. This dashboard will scan multiple timeframes and symbols in MT4 platform, from M1 chart to D1 chart. It will send the buy/sell signals by alert on the platform or sending notification to your phone or message you via a email.
The buy signal is generated when the heiken ashi bar changes its color from red to white. The sell signal is is generated when the heiken ashi bar changes its color from white to red. The up/down trend color will be displayed depend

Trading Robot "Donald V3.0" for MT4 Introduction Product Name: Donald Platform: MetaTrader 4 (MT4) For Sale: MQL4 Market Robot Characteristics Key Parameters TimeFrame: M15 (trading time frame) RiskPercent: 3.0% (percentage risk of the deposit for each trade) FixedLots: 0.0 (fixed lot size if not using percentages) ATRPeriod: 14 (ATR indicator period) StopLoss: 10 (Stop Loss value in ATR units) TakeProfit: 30 (Take Profit value in ATR units) TrailingStop: 20 (Trailing Stop value in ATR units) Tr
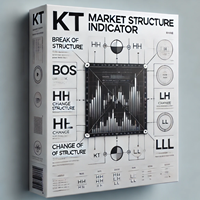
The KT Market Structure intelligently detects and displays Break of Structure (BOS) , Change of Character (CHoCH) , Equal Highs/Lows (EQL) , and various significant swing high/low points using our proprietary algorithm for accurate pattern detection. It also offers advanced pattern analysis by effectively demonstrating the captured profit for each pattern. A fully automated EA based on this indicator is available here: KT Market Structure EA MT4
Features
Accurate Pattern Detection: Our advance

This indicator combines several functionalities: Value Zone Displays two exponential moving averages (EMAs): 13-period EMA in red. 22-period EMA in blue. Impulse System (based on Dr. Alexander Elder's methodology) Candles are color-coded to indicate trade restrictions: Red candles prohibit buying. Green candles prohibit selling. Blue candles allow both buying and selling. Recommended for use on two timeframes for enhanced analysis. 3x ATR Channel A channel based on 3 times the ATR (Average True
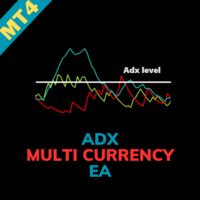
ADX Multi Currency EA MT4 implementa estratégias robustas baseadas no Índice Direcional Médio (ADX), extensivamente testadas em múltiplos pares de moedas e períodos de tempo. O robô oferece capacidades completas de negociação, incluindo recuperação em grade, opções de hedge e estratégias de martingale (configuráveis, mas desativadas por padrão). Ele possui métodos de entrada precisos (rompimentos, reversões, seguimento de tendência) e regras de saída flexíveis (baseadas em indicadores, tempo ou
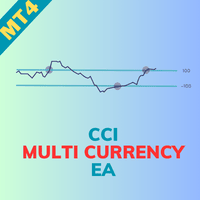
CCI Multi-Currency EA MT4 implementa estratégias robustas do Índice de Canal de Commodities (CCI), extensivamente testadas em vários pares de moedas e períodos de tempo. O robô oferece capacidades completas de negociação, incluindo recuperação em grade, opções de hedge e estratégias de martingale (configuráveis, mas desativadas por padrão). Ele possui métodos de entrada precisos (rompimentos, reversões, seguimento de tendência) e regras de saída flexíveis (baseadas em indicadores, tempo ou lucro
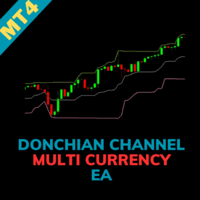
Donchian Channel Multicurrency EA MT4 implementa estratégias robustas de Canal de Donchian que foram amplamente testadas em vários pares de moedas e períodos de tempo. O robô oferece capacidades completas de negociação, incluindo recuperação em grade, opções de hedge e estratégias de martingale (configuráveis, mas desativadas por padrão). Ele possui métodos de entrada precisos (rompimentos, reversões, seguimento de tendência) e regras de saída flexíveis (baseadas em indicadores, tempo ou lucro),

RSI Grid Trading System with Doji Filter - Trading Strategy Description Core Trading Logic: Entry Conditions: Primary entry based on RSI(14) signals Buy signal: RSI crosses below 30 Sell signal: RSI crosses above 70 Must have sufficient account margin Initial lot size: 0.01 standard lot Grid Management System: Grid spacing: 20 pips between positions Maximum grid positions: 5 levels Lot size plus per level Additional grid entry requirements: Must form Doji candlestick pattern Doji confirmation:

Ichimoku Multi-Currency EA MT4 implementa estratégias robustas de Ichimoku que foram amplamente testadas em vários pares de moedas e períodos de tempo. O robô oferece capacidades completas de negociação, incluindo recuperação em grade, opções de hedge e estratégias de martingale (configuráveis, mas desativadas por padrão). Ele possui métodos de entrada precisos (rompimentos, reversões, seguimento de tendência) e regras de saída flexíveis (baseadas em indicadores, tempo ou lucro), além de funcion

THIS EA WILL PROTECT YOUR ACCOUNT IN MANY WAYS KEY FEATURES ARE : 1. CLOSE ALL TRADES IN ONE CLICK. 2. CLOSE ALL TRADES WHEN INPUT MENTIONED LOSS LIMIT REACH. 3. CLOSE ALL TRADES WHEN INPUT MENTIONED PROFIT LIMIT REACH. 4. IF REVERSE MODE IS ON THIS EA WILL TAKE OPPOSITE TRADES IF YOUR OTHERS EA MAKES LOSS OR MANUAL TRADING ALSO IF YOU ARE GETTING ALWAYS LOSS THEN YOU CAN SWITCH ON REVERSE MODE SO IT WILL TAKE OPPOSITE TRADES WHENEVER ANY TRADES PLACED IN YOUR ACCOUNTS. 5. FIX LOT SIZE 6. STOP
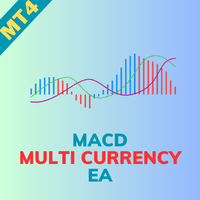
Consultor Especialista Multimoeda MACD MT4 implementa uma estratégia robusta de duas Médias Móveis, amplamente testada em vários pares de moedas e períodos de tempo. O robô oferece capacidades completas de negociação, incluindo recuperação em grade, opções de hedge e estratégias de martingale (configuráveis, mas desativadas por padrão). Ele possui métodos de entrada precisos (rompimentos, reversões, seguimento de tendência) e regras de saída flexíveis (baseadas em indicadores, tempo ou lucro),

The Gold Angel MT4 Expert Advisor is designed for automated gold trading on the MetaTrader 4 platform, providing traders with unique tools and strategies to achieve maximum profit. Using complex algorithms for analyzing market data, this advisor is able to identify profitable entry and exit points, which significantly reduces risks and increases the chances of successful trading.
Gold Angel MT4 offers an intuitive interface that allows both experienced traders and beginners to easily customize
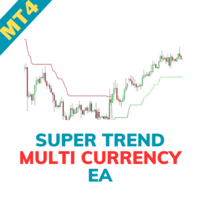
Supertrend Consultor Especialista Multimoeda MT4 implementa uma estratégia robusta com o indicador Supertrend, amplamente testada em vários pares de moedas e períodos de tempo. O robô oferece capacidades completas de negociação, incluindo recuperação em grade, opções de hedge e estratégias de martingale (configuráveis, mas desativadas por padrão). Ele possui métodos de entrada precisos (rompimentos, reversões, seguimento de tendência) e regras de saída flexíveis (baseadas em indicadores, tempo
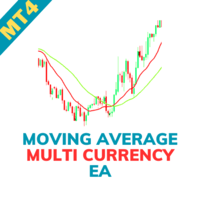
Moving Average Multi-Currency EA MT4 implementa uma estratégia robusta de duas Médias Móveis, amplamente testada em vários pares de moedas e períodos de tempo. O robô oferece capacidades completas de negociação, incluindo recuperação em grade, opções de hedge e estratégias de martingale (configuráveis, mas desativadas por padrão). Ele possui métodos de entrada precisos (rompimentos, reversões, seguimento de tendência) e regras de saída flexíveis (baseadas em indicadores, tempo ou lucro), além de

London Breakout Master: Dominate Gold Trading with Precision Unlock the true potential of gold trading with the London Breakout Master , the ultimate EA designed to capitalize on London session breakouts. Which considers trading ranges that forms during asian sessions . Engineered with advanced algorithms, this EA delivers stellar performance and unmatched accuracy. With extensive backtesting showcasing impressive results, the London Breakout Master ensures you're always ahead of the market. K

MarketEcho Signals is a powerful and innovative technical analysis tool designed to identify high-probability buy and sell signals in the financial markets. By combining trend-following indicators with price action patterns, this indicator helps traders navigate volatile markets with ease. It is based on a 25-period Exponential Moving Average (EMA) to filter trends, ensuring that trades are taken in the direction of the overall market momentum. Key Features : Trend Filter with EMA :
The MarketEc

High, Low, Open, and Close of Candles: Utilizing the Bombafkan Indicator Tool With the Bombafkan Indicator, you can easily view the high, low, open, and close of candles and analyze this price information across different timeframes. This feature helps you perform more accurate analyses and optimize your trading strategies with a comprehensive view of price movements. Additionally, the Bombafkan Strategy includes a setup called the "Candle-Side Signal," which allows you to easily take bu

My Live Signals: : Access: Click here .
The price of this robot will soon increase to 3000 USD ! Don't miss the opportunity to get it at its current price.
Hello! Are you a trader looking for an EA with an investing-style strategy? If yes, this EA is for you! The MultiSync Trade System is an EA that follows an investing-style strategy. Yes, it trades slowly, but when it does trade, it guarantees profitability and provides steady income every month, as well as returns on your acc

“ Active Impulse ” - это высокоточный индикатор появления активного импульса (АИ), который является важным элементом современных торговых систем, разработанных на основе теории импульсного равновесия. Индикатор позволяет кардинально снизить время нахождения трейдера у монитора - просто установите индикатор на группу графиков и не нужно будет часами сидеть у монитора, так как индикатор в потоке информации мгновенно находит активные импульсы с определёнными параметрами и при их появлении на график

The expert advisor is designed to perform extremely powerfully and aims to double the capital. It includes a wide range of available options that subscribers can switch between and select according to their preference. Additionally, it can operate with the default settings, which are the ones we personally use. You can test it and witness its strength through backtesting on Gold and USDJPY, where it shows remarkable performance. You have the flexibility to adjust the lot size, increase the lot,

Charts Dominator: Pure Price Action Mastery Unlock the power of trend-following trading with Charts Dominator, the ultimate Expert Advisor designed for serious traders. This EA uses pure price action to make smart, data-driven decisions, ensuring you're always aligned with the market’s true direction. No more relying on complicated indicators—just the simplicity and accuracy of price movement.
Why Charts Dominator is a Game-Changer Whether you’re a beginner or an experienced trader, Char

"Niguru Amazing Gold" is an EA specifically for Gold. This EA works in single shot, and does not use martingale or grid.
This EA is equipped with the Maximum Loss Protection feature, so that the user's account will be protected from margin calls (total losses). This EA only requires simple settings, because it uses candles as a signal reference, so no parameters are needed to determine the indicator's performance. Although equipped with input parameters for TP (take profit) and SL (stop loss),
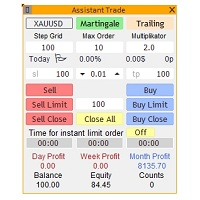
O consultor de negociação, que é um painel de negociação intuitivo, foi criado para simplificar o processo de negociação nos mercados financeiros e aumentar a eficiência da negociação. Esta poderosa ferramenta permite que os traders abram operações com apenas alguns cliques, reduzindo significativamente o tempo necessário para completar as transações. Join our cozy Discord server ️
️ https://discord.gg/JSFt2xKTau
Utilizando o sistema martingale integrado, o painel de negociação ger

Crazy Gold Expert Advisor for Gold Trading in MetaTrader 4 (MT4) is an automated trading system specifically designed for trading gold (XAU/USD). Such Expert Advisors typically use algorithms to execute trades based on technical analysis and other market data.
Key features and functions of Expert Advisors:
Automated trading: The Expert Advisor can automatically open and close positions, minimizing the need for manual management.
Trading strategies: Many Expert Advisors use different strategie

**Golden Scalper** é um sistema de negociação automatizado avançado, projetado meticulosamente para as dinâmicas multimoedas sendo completamente adaptável as suas necessidades. Utilizando análises técnicas avançadas, o robô avalia dados históricos e em tempo real para identificar tendências potenciais, níveis chave de suporte e resistência, e outros sinais relevantes do mercado.
O robô abre posições todos os dias, de segunda a sexta-feira, e todas as posições são protegidas com **Take Profit

Enhance your trading with visual clarity — identify trends instantly with dynamic EMA ribbons! Description:
The DMI Dynamic EMA Ribbon is an advanced indicator designed to help traders visualize trend direction and strength using two dynamic exponential moving averages (EMAs). With customizable parameters, this tool enhances your ability to make informed trading decisions by clearly indicating bullish and bearish trends. Key Parameters: Customizable timeframe for moving averages. Period for the

Dynamic Trailing Stop Distance Logic Base Trailing Distance : Define a minimum trailing distance for small profits. Profit-Dependent Distance : Scale the trailing stop distance based on the current profit level. Cap Distance (Optional) : Optionally, limit the maximum trailing stop distance to avoid overly large values. Input Parameters MagicNumber : Filters trades by their magic number. BaseTrailingStop : Minimum trailing stop distance (in points). ActivationThreshold : Profit threshold in pips
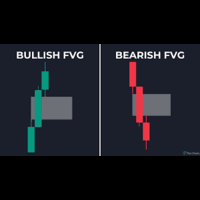
It identifies fair value gaps which are currently valid. Settings: Bullish FVG Color: To set the color of bearish FVGs. Bearish FVG Color: To set the color of bearish FVGs. Minimum Size: For filtering the signals. The restricts a minimum size for the FVG to be considered valid. For custom additions you can reach out to developer here MT5 Version available here

Esta releitura do indicador Value Chart introduz novos parâmetros na forma como o indicador é calculado. O objetivo principal é analisar o range atual e tentar prever a direção do candle em andamento, emitindo uma seta que indica para onde se acredita que o candle irá se movimentar. A estrutura de cálculo se baseia nos últimos 1.000 candles. Primeiro, uma média ponderada é calculada para cada candle. Em seguida, é aplicado o cálculo do Value Chart modificado para determinar o range e a força do

CashFlowFellows Grid Guru is an advanced Expert Advisor (EA) crafted to elevate grid trading strategies in the Forex market. Powered by state-of-the-art algorithms, this EA blends precision, flexibility, and risk management to deliver consistent results in dynamic market conditions.
10 copies left for Current price $175 : Done. Net price > $750 . Price now
Key Features: Dynamic Grid Trading Implements an optimized grid system to leverage market volatility effectively. Adjustable grid spaci

---
Infinity Sniper: The Ultimate Trend Master Introducing Infinity Sniper, the most powerful and reliable Expert Advisor I have ever developed. This EA takes your trading to the next level, combining pure price action with smart money management and innovative trade strategies. It’s designed for traders who want consistent profits and long-term growth, with a proven track record of success.
Why Infinity Sniper is a Game-Changer Infinity Sniper doesn’t just follow the trend—it masters i

Midas Gold MT4 is a fully automated MetaTrader robot that contains several trading systems based on various default indicators. Each trading system has it own entry with fixed stop loss and take profit. This expert advisor can be used for all pairs and timeframes, but it is specifically designed for XAUUSD (Gold) H1 .
Main Features: No Martingale. No Grid No Averaging. Setting Parameters: Expert Name - EA name and trades comment. Magic Number - EA identification number to identif
DMI Smoothed CCI plus: Track Market Trends and Reversals Across Multiple Timeframes The DMI Smoothed CCI plus is a powerful tool for traders, designed to analyze market trends and potential reversals using the Commodity Channel Index (CCI) across multiple timeframes. Ideal for trend-following strategies, this indicator helps you spot overbought and oversold conditions, providing real-time insights that are crucial for optimizing your market entries and exits. Key Features: Multi-Timeframe Analy

Pares de Moedas Suportados AUDCAD AUDNZD NZDCAD Características Configuração em Um Gráfico : Anexe o EA a apenas um gráfico M15, preferencialmente AUDCAD. Suporte a Múltiplas Moedas : Opera em vários pares sem a necessidade de gráficos separados. Desempenho Robusto : Resultados confiáveis em backtests e negociações ao vivo. Configuração Simples : Configurações internas eliminam a necessidade de arquivos .set externos. Filtro de Notícias : Requer acesso a recursos externos para filtragem de notíc

Por que o EA Project Oreon Golden é o Melhor Amigo dos Iniciantes Trading Automatizado de Ouro : Deixe a análise complexa e a tomada de decisão por conta do EA. Ele executa trades de forma especializada com base em estratégias testadas, minimizando a necessidade de intervenção manual constante. Gestão Estratégica de Riscos : O Gold Rush Pro EA utiliza inteligentemente uma combinação de estratégias martingale e grid, ajustando-se dinamicamente às condições de mercado para ajudar a gerenciar risc

Introdução ao Turbo Trend Bot para Meta Trader 4 Visão Geral
O Turbo Trend Bot é um poderoso Expert Advisor baseado no indicador Turbo Trend , projetado para seguir tendências de mercado de forma eficaz. Este EA utiliza uma estratégia de trading segura, evitando métodos arriscados como martingale, grid ou scalping. Ele prioriza a gestão de riscos por meio de stop-loss, take-profit, ajustes da relação risco-retorno e um recurso inovador de fechamento parcial para garantir lucros. Baixe gratuita

What are Fair Value Gaps (FVG)? Fair Value Gaps occur when price moves so quickly that it creates an imbalance between buyers and sellers. These gaps represent areas where price "skipped" levels, creating potential zones for price to return and "fill the gap". Think of it as unfinished business in the market that often gets revisited. They are also considered a support or resistance area because it represents a zone on a chart where there is a significant imbalance between supply and demand, ca

Hello Sellers here is my EA Sell Scalper trader it can be used on any open window but look out and play with the parameters !!
Limited time for 45$ then i go to the retail price of 299$ Leave a comment and review 5 stars means you like it :)
Make me happy
Please see video: https://youtu.be/yE3GF4ku36Q
Introducing Expert Advisor designed to trade in combination to my EA BULL Scalper delivering me consistent profits over the long run. This advanced algorithmic trading system operates sea

MT4 Telegram Control Pro is an advanced trading bot designed to integrate seamlessly with MetaTrader 4, enabling efficient and flexible trading management directly through Telegram.
With intuitive command-based operations, this bot allows traders of all levels to execute orders, manage positions, monitor market conditions, and automate strategies in real-time. Whether you're a novice or a seasoned trader, MT4 Telegram Control Pro provides a powerful, user-friendly tool to streamline and en

The Gold Lady Expert Advisor for gold trading in the MetaTrader 4 (MT4) platform is an automated trading system specifically designed for gold (XAU/USD) trading. Such advisors typically use algorithms to execute trades based on technical analysis and other market data.
The advisor employs neural networks to analyze market data in real time, skillfully adapting to changing conditions and issuing highly accurate signals for entering and exiting a trade. This sophisticated creation, easy to use an

EA CREATED WITH THE AIM TO HELP SIMPLIFY AND SPEED UP IN TRADING ANALYSIS. This EA is based on SNR Breakout, This EA works Multitimeframe This EA can accurately identify Support & Resistance, accurately identify SnR Breakouts. provides alerts when there is a Breakout on All TimeFrames. The EA has an Information Dashboard that makes it easy for traders to see the current market conditions. The Dashboard displays the status of the last Breakout in each TimeFrame and the history of the setup that

My Expert Advisor trade Gold (XAUUSD) on M15 time frame, Base on hedging and scalping strategy. stop loss 1.450 usd/0.01 lot take profit 3.300 usd/0.01 lot Live signal: https://www.mql5.com/en/signals/2274689 Recommend broker: Exness (Zero account, spread = 0) and use VPS Min deposit: from 200 usd - From 200 usd to 3900 usd after 7 months (backtest but worthy to try) Input Setting to test my EA: - Stoploss: 1450 (1.450 usd/0.01 lot) (adjust to the correct ratio and do not change) - T
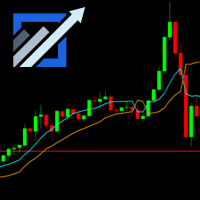
Boost your trading accuracy with the SSL Channel Indicator , designed to identify trends and precise entry points. This dynamic tool adapts to all trading instruments and timeframes. Perfect for scalpers, day traders, and swing traders, the SSL Channel Indicator simplifies market analysis, helping you trade confidently and effectively. Unlock your trading potential today! MT5 Link- https://www.mql5.com/en/market/product/127492

Consigue retornos masivos con un EA específico para el mercado alcista de Bitcoin, con pruebas robustas y soporte constante. El concepto de BitcoinRIDER es capturar estos movimientos parabólicos y capitalizar la volatilidad y las tendencias que definen los mercados alcistas. [ Guía de configuración | Grupo de soporte | Versión MT5 - MT4 ]
Quedan 10 copias a $99 y luego a $149 . Después de la compra, envíenos un mensaje privado para recibir el segundo conjunto de archivos.
Estrategia detrás Bit

Indicador Crypto_Forex "Índice de Força com zonas dinâmicas de Sobrevenda/Sobrecompra" para MT4, sem repintura.
- O índice de força é um dos principais indicadores que combina dados de preço e volume num único valor. - É ótimo fazer negociações de venda na zona dinâmica de sobrecompra e negociações de compra na zona dinâmica de sobrevenda. - Este indicador é excelente para a negociação de momentum na direção da tendência. - Zona de sobrecompra dinâmica - acima da linha amarela. - Zona de sobre
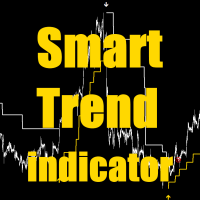
SmartTrend é um indicador que utiliza algoritmos de inteligência artificial para otimizar a negociação no mercado Forex. Oferece aos traders oportunidades para adaptar suas estratégias às condições do mercado. Principais Recursos do SmartTrend: 1. Cálculo Automático de StopLoss : o O indicador determina os níveis de StopLoss com base na volatilidade atual, ajudando a minimizar riscos. 2. Função de StopLoss de Emergência : o Ativada quando as tendências de mercado mudam, propor

Everyone has heard that 95% of traders lose money, well join the 5% profitable one with 'The 5 Percent.
The 5 Percent Indicator: Join the Elite 5% of Traders. Manage risk and stay in the game by following the trends. Tired of being part of the 95% who lose money? The 5 Percent Indicator is your key to unlocking consistent profitability. This powerful tool provides clear, actionable signals, helping you make informed trading decisions and maximize your returns. Don't miss out on your chance to j

DepositBooster — это продвинутый торговый советник для валютных пар EUR/USD, GBP/USD, USD/CAD, AUD/USD на таймфрейме M5. Этот советник подходит для любых депозитов и поддерживает два режима торговли, что делает его гибким инструментом как для начинающих, так и для опытных трейдеров. Ключевые особенности DepositBooster Торговля по индикаторам: Входы в рынок происходят по сигналам от Stochastic и MA, что обеспечивает точное определение моментов для входа. Удобная панель управления: Простой и понят
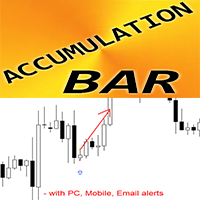
Padrão de barras de acumulação do indicador Crypto_Forex para MT4.
- O indicador "Accumulation Bar" é um indicador muito poderoso focado em ruturas para a negociação de Price Action. - O indicador deteta a acumulação de preço em área estreita durante 1 barra e mostra: direção de rutura, ordem pendente e localizações de SL. - Barra de acumulação de alta - Sinal de seta azul no gráfico (ver imagens). - Barra de acumulação de baixa - Sinal de seta vermelha no gráfico (ver imagens). - Sem repintur

If you ever wanted to know your local time (or NY time) at any bar on the chart without needing to waste time with mental calculations, look no further.
This indicator creates a crosshair which you can drag anywhere on the chart and will show you the local time in a label on top of the time axis.
Press the "c" key to show/hide the crosshair. Left click it to pick it up and drag anywhere, left click again let it go.
You can't hide the crosshair without letting it go first.
Time setting inputs

HFT ZONE MOMENTUM RECOVERY
EA_Name ค่า: HFT MTRADER ใช้สำหรับระบุชื่อของ EA เพื่อให้ง่ายต่อการจัดการหรือตรวจสอบในประวัติการเทรด (History) Lot_fix ค่า: 0.02 ใช้กำหนดขนาดของล็อตคงที่ (Fixed Lot Size) ที่ EA จะเปิดในแต่ละคำสั่งเทรด โดยไม่ขึ้นอยู่กับเงื่อนไขอื่น ๆ Lots_X ค่า: 1.5 ตัวคูณล็อต (Lot Multiplier) ซึ่งมักใช้ในการเพิ่มขนาดล็อตในลักษณะการ Martingale หรือ Hedging โดยเมื่อขาดทุนหรือเปิดคำสั่งถัดไป ระบบจะเพิ่มล็อตตามค่าที่กำหนดไว้ High_Low_end_candle ค่า: 10 จำนวนแท่งเทียนที่ใช้ในการคำนวณระ
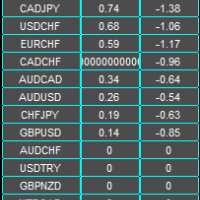
Abbeyfx Swap Dashboard displays your broker swap/interest rate. The implied swap/interest rate differential is for all currency pairs you have in your market watch.
Interest rate differential: The key factor traders consider is the difference in interest rates between two currencies involved in a pair, known as the "interest rate differential
Impact on currency value: A higher interest rate typically makes a currency more attractive, causing its value to rise relative to other currencies with
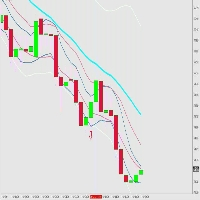
Signal Entry BBMA Low Risk High Reward Entry Friendly Use Using Fibo for TP 1, TP 2 , TP 3 , TP 4, TP 5, TP 6 , TP 7 , TP 8 , TP 9 , TP 10 Entry Low MA or Entry High MA Pair GOLD is The Best Pair EURUSD, GBPUSD, USDJPY Is Good Pair BTCUSD id Good Risk Manajemen only 1% entry and you get Profit 2-10% Recommended Broker https://one.exnesstrack.org/a/yyatk129ng If you want FullMargin Is Good but I recommended using Manajemen your Money

Please contact me after your full purchase for great bonuses.
Adaptive Reversal Star Expert Advisor and an additional indicator as a gift Info Panel are waiting for you. Adaptive Reversal Star is a new generation indicator with an advanced Adaptive algorithm , which additionally tracks potential reversal points and compares the values of the current market volatility when forming the main signals

️ EA Close Order Time (Code by ThangTruong)
- Automatically close orders by time (day + hour) - Close orders by currency pair installed EA or all currency pairs - Close all BUY orders by time - Close all SELL orders by time - Close all PROFIT orders by time - Close all LOSS orders by time
Details at: https://discord.gg/J87vyRUJCj

Lucky Bot: The Ultimate USD/JPY Trend-Following Solution Version: 1.07
Category: Trend-Following EA
Timeframe: 1 Hour (H1)
Supported Pair: USD/JPY Description Lucky Bot is an advanced Expert Advisor (EA) designed to trade exclusively on the USD/JPY pair on H1 charts . This bot leverages advanced trend-following strategies to maximize profits while managing risks effectively. It is ideal for traders seeking a reliable, fully automated solution with proven results. Backtest Results (2024.06.11 –
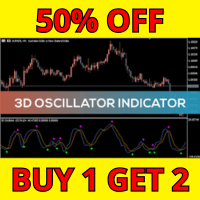
Os 7 Benefícios do 3D Oscillator: Tripla Perspectiva para o Mercado: O nome "3D Oscillator" não é por acaso. Ele integra três indicadores consagrados (RSI, Estocástico e CCI) em um único painel. Essa combinação oferece uma visão tridimensional do mercado, ajudando você a enxergar tendências ocultas e evitar armadilhas. Configuração Personalizável: Com parâmetros ajustáveis, como D1RSIPer , D2StochPer , e D3tunnelPer , o indicador se adapta a qualquer estilo de trading, seja você um scalper agres
The work of this Expert Advisor is similar to fishing, when you use several fishing rods. This Expert Advisor works on the channel indicator, the work of which you can see in the screenshots. This indicator is effective on any TM, so it can be used in all types of trading, including scalping for 5 and 15 minutes, intraday or full automatic trading of several instruments simultaneously on D1. This expert advisor is ideal for working both on a flat and during sharp or protracted trend movements
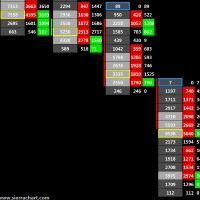
Indicador de Volume Cluster para MetaTrader 4: Análise Avançada de Suporte, Resistência e Dinâmica de Mercado O Indicador de Volume Cluster para MetaTrader 4 é uma ferramenta poderosa desenvolvida para traders que desejam obter uma compreensão profunda sobre a dinâmica do mercado. Ele fornece insights detalhados sobre o comportamento do volume dentro de cada candle, destacando níveis onde o volume está "super precificado" e regiões de fraqueza, permitindo a identificação precisa de zonas de supo

* Super Assistant is an useful management tool that helps traders perform management tasks on MT4/MT5 account remotely via Telegram such as: - Get info (account, details of positions, pending orders, floating PL, price, economic news, etc) - Open trade (open instantly with preset parameters) - Manage trade (set SLTP automatically, break-even mode, max risk, close time every day, etc) - Close trade (close all, buy, sell, win positions by one click, set awaiting close by PL, time) - Set up no

This expert use grid and advanced DCA and martingale strategy. The strategy used by Fund Manager by our country. Use only pair AUDCAD, with timeframe H4 it can survive 2015-Nov 2024. For the last 2 years timeframe M30 have lowest drawdown. You can use it on M5.
It works well in other Pairs in H4 : EURNZD, EURGBP , EURCAD
Use proper money management, use money that you can loose, withdraw your profit. This strategy can make good profit if you use good money management. Use the balanc
DMI Timeframe Switcher: Quickly Switch Timeframes with Interactive Buttons or with keyboard shortcuts The DMI Timeframe Switcher indicator is an ideal solution for traders who want to quickly switch between timeframes using interactive buttons or keyboard shortcuts. With this feature, you can easily navigate between different periods without manually adjusting chart settings. Perfect for fast and accurate market analysis. Features: Timeframe Switching: Change the timeframe by clicking the button
Você sabe por que o mercado MetaTrader é o melhor lugar para vender as estratégias de negociação e indicadores técnicos? Não há necessidade de propaganda ou software de proteção, muito menos problemas de pagamentos. Tudo é providenciado no mercado MetaTrader.
Você está perdendo oportunidades de negociação:
- Aplicativos de negociação gratuitos
- 8 000+ sinais para cópia
- Notícias econômicas para análise dos mercados financeiros
Registro
Login
Se você não tem uma conta, por favor registre-se
Para login e uso do site MQL5.com, você deve ativar o uso de cookies.
Ative esta opção no seu navegador, caso contrário você não poderá fazer login.