Conheça o Mercado MQL5 no YouTube, assista aos vídeos tutoriais
Como comprar um robô de negociação ou indicador?
Execute seu EA na
hospedagem virtual
hospedagem virtual
Teste indicadores/robôs de negociação antes de comprá-los
Quer ganhar dinheiro no Mercado?
Como apresentar um produto para o consumidor final?
Expert Advisors e Indicadores para MetaTrader 4 - 122

The CCI Dashboard is an information panel which allows you to have a global market vision through a Commodity Channel Index. CCI Dashboard analyzes and tracks all the actives you want to invest in. Take advantage of this useful dashboard where you can open in a few seconds the chart and quickly invest on it.
Main Features of CCI Dashboard Graphic panel that allows you to know the situation of many assets. 7 Different Commodity Channel Index situations to discover when an asset is overbought or
Description: - Chart Time + Indicator is very simple and easy, but it can be very important to control the time before opening any manual trade. This indicator shows the time in a panel between 3 different options. Can be possible to move the panel with mouse or with fixed coordinates on the chart. Input Parameters: - Local Time : Enable Local Time if you want to show it (Personal Computer Time). - Server Time : Enable Server Time if you want to show it (Broker Time). - GMT Time
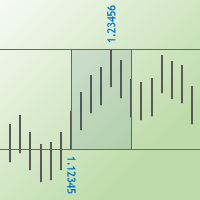
The Max Min Prices One indicator determines the maximum and minimum prices between two candles and shows them as rectangle on the price chart. You may also show the price values and their levels as horizontal lines.
Parameters Start bar time – time of the start candle End bar time – time of the end candle Rectangle filling - fill the rectangle with color Is show max and min prices - show labels of the maximum and minimum prices Is show horizontal lines - show levels of the maximum and minimum p

>>> MEGA SALE: 40% OFF! - Promo price: $77 / Regular price $129 <<< - The promotion will end soon!
Smart Impulse Trader is an automated forex trading robot. The main idea behind this strategy is to detect the impulse and to open two trades at the same time and in the same direction. There are separate take profits for both trades: First_Trade_TP and Second_Trade_TP. When the first trade is closed with profit, then the robot sets take profit value to the second trade. The distance is equal to

Este indicador / oscilador múltiplo (doravante indicador), quadro de tempo múltiplo e indicador de símbolo múltiplo identifica quando ocorre uma divergência entre o preço e um, dois ou três indicadores. Ele identifica divergências regulares / clássicas (reversão da tendência) e ocultas (continuação da tendência). Possui opções de filtro de tendência RSI e MA, o que torna possível filtrar apenas as configurações mais fortes. Combinado com suas próprias regras e técnicas, este indicador permitirá

O Fibo Scalper Pro Expert Advisor é uma ferramenta poderosa projetada para automatizar as populares estratégias de negociação de Fibonacci . Ele simplifica o processo de negociação desenhando e ajustando automaticamente os níveis de Fibonacci no gráfico. Esse recurso oferece conveniência e precisão para os traders que utilizam retrações e extensões de Fibonacci em suas análises.
Uma das principais características do Fibo Scalper Pro é sua facilidade de personalização. Ele permite que o

Harmonic Trading is now much easy than ever before with Harmonic Master Scanner Pro you can now scan time frames from 5m to 1w for 17 harmonic patterns on all bares at the same time. Harmonic Master Scanner Pro works based on original MetaTrader4 Zigzag indicator and the standard harmonic patterns elements. This software send alert and email to you when a harmonic pattern is detected on any charts. If you want the scanner to draw the pattern just switch the time frame to the alert time frame. Th

If you want to test the functionality of this tool, you can do it trough a DEMO version, that is restricted to work only on EURUSD and USDJPY currency pairs. To obtain it, please visit the following link: https://www.mql5.com/en/market/product/29594 This EA was originally coded as a back up tool for my personal trades as all of us (Or at least the ones who have left an order open and went to sleep) have experienced the frustration that involves waking up, check the trades and see that in some o

This indicator shows the latest untouched support and resistance as horizontal lines. The indicator can show support/resistance from higher timeframes. With this indicator you can e.g. easily see the support/resistance of the timeframes H4, D1 and W1 on a H1 chart, which can be a big advantage while time your entry on H1. This is the FULL version of the indicator: Support Resistance Multi Time Frame FREE
Parameters referenceTF: the timeframe from which the support/resistance is calculated candl

The OnixPoint indicator efficiently detects the most appropriate entry in trend with the shorter stoploss. It is based on finding patterns of tasset trend change with respect to future price estimate. It works for any currency pair. The indicator is designed to facilitate decision-making at position entries. The development team is constantly improving the functionality of the indicator.
Benefits of the Indicator Does not repaint. Works on all currencies. Works on all timeframes. It's easy to u

MTSBSPanel is a multifunctional trading panel with an integrated risk manager.
Main features of the trading panel Placement of pending orders directly from the chart with the ability to divide a position into multiple orders Opening by market in one click with the ability to divide a position into multiple orders Risk management: risk per trade and per day Dynamically calculated lot depending on the specified risk per trade Brief information on the account, result of trades for the day, week, m

Fully automated, which does not use grid strategies, martingale, averaging positions, waiting out a loss, etc. All positions have a fixed Stop Loss. The expert trades in a calm market, at the end of the American session. Deposit: from 100 units of deposit. Example of currency pairs: EURCHF, AUDCAD, USDCHF, GBPUSD, AUDCHF. Chart period: any. Accounts: You should use ECN-ECN Pro. with five-digit quotes with a moderate size (spread). Testing-optimization:
All recommended currency pairs are normally
The oscillator shows reversal points and the movement strength very well. It can be used on any symbol and any timeframe. It has a parameter of the level when the signal reaches the required power. The indicator is very easy to setup. Indicator bars are not redrawn.
Description of the Parameters PeriodPower - signal power calculation period LevelPower - the required level of the signal power
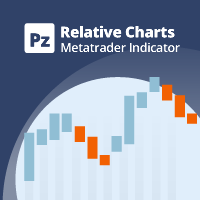
This creates a mean-reversion chart using a moving average as a reference, detaching ourselves from the changing value of fiat currencies. [ Installation Guide | Update Guide | Troubleshooting | FAQ | All Products ] Get a mean-based view of the market Find real overbought/oversold situations easily Isolate your perception from the changing value of fiat currencies The center line represents the moving average Your imagination is the limit with this indicator Customizable chart period and Bolling

Triple gives you three great indicators in one: Commodity Chanel Index (CCI) Exponential Moving Averages (EMA's) x 3 Relative Strength Index (RSI)
How the indicator works The indicator works by displaying a grid of 3 different indicators and puts them on a scale from red (bearish) to dark green (bullish). With a clear and easy to read display metric of 5 separate colours across each indicator. Dark Green - Strong Bullish Light Green - Bullish Yellow - Indifference Orange - Bearish Red - Strong

This is a multi-strategy EA. In the night scalping mode, the filters filter a trend-free range market environment and trades are placed in the opposite direction at the edges of the range. With an additional main trend filter in the trend-following mode, you can also trade pull-backs during longer trends on same houers or days. A detailed description of SpotLight EA can be found in the SpotLightBlog and a live monitoring here: If you have any question about the product, please contact me.
It is a tool for technical analysis. It allows you to make measurements: Fibo, including the search for clusters Fibo levels (by the DiNapoli method) Overbalance Trend line Selecting S/D levels
Input parameters Trend_Color - color of the trend line Trend_Width - width of the trend line Trend_info - if true, along with the trend line additional information is displayed (low, high, medium of the trend line) Trend_info_color_up_dn - color of the text describing the trend line Trend_info_font_up_dn

Viper Trend indicator is an indicator designed to find trends. It uses a moving average, a set of candle combinations and High/Low levels to find trends. This indicator is a complete trading system. You can trade with this indicator as you like.
Features and Recommendations You can use this indicator on all pairs except for the volatile pairs. It is recommended to use it on M15 and over charts. The most important element in this indicator are alerts. Do not open orders unless you receive an ale

Genio Scalp is an Expert Advisor that follows the trend. It uses some simple setting. This EA analyzes the trend using the Moving Average indicator on multiple timeframes, combined with mathematical functions. If the main trend on the market is "buy" and the trigger signal also recommends to "buy", then the EA will execute the "buy transaction". And vice versa. Furthermore, this EA can also use Autolot calculation. By default, as protection, the Stop Loss is set in a tight points. This EA is rec

Grid Primordial O Expert Advisor usa as leituras de dois indicadores RSI e Média Móvel como sinais para entrar no mercado. O mercado é inserido com uma posição de mercado e uma grade de ordens pendentes Buy Stop ou Sell Stop. Pedidos e posições têm níveis físicos de lucros e perdas. O EA implementa o método de bloqueio de posições que não atingiram o nível de limitação de perda, enquanto usa o segundo nível de lucro especificado na moeda de depósito.
Descrição das configurações RSIPeriod - pe

Spread Costs refers to the amount of the loss caused by the spread, and Swap Benefits refers to the amount of the income gained by overnight positions. Spread Costs is an important indicator for short-term traders, especially for scalping traders, and Swap Benefits is an important indicator for long-term traders. Since the spreads and swaps on the MetaTrader 4 platform are all expressed in points, we need to convert it into the amount expressed in the account currency. This tool can display the

The scalper uses the model of a quantum set of algorithms, applying a unique multi-level system of supportive orders. There is no need to optimize the EA, it is already fully configured for work. Signal: EUR/USD Key points Passes the test from 1999 to the current time (20 years). No need to close the robot during news releases; It works with 4 and 5-digit quotes; Uses a medium model of a quantum set .
Operation parameters Currency pair : EURUSD; Timeframe : M5; Broker: any; Торговые счета: l

One Click Trading Panel
One Click Trading Pad Panel is a control panel for managing basic orders in МT4,
such as buy, sell, buystop, buylimit, sellstop, selllimit, Reverse, trailing stop. And signal .
The panel consists of 3 tabs.
- CMP-Current Market price , buy, sell trailing stop. And signal
- Pending Order buystop, buylimit, sellstop, selllimit
- CLPM Close Lost, Profit management -----------------------------------------------------------
One Click Trading Panel
- Works on
This candlestick indicator searches for candlesticks, at which the direction on all selected timeframes coincides (M1, M5, M15, M30, H1, H4, D1, W1, MN). For example, if the candlestick on all timeframes is rising (bullish) or falling (bearish). You can: Turn off the display of unnecessary arrows and leave, for example, only those showing changes in signal direction, i.e. only the first arrow in each direction. Set the candlestick for the signal: the zero candlestick or a completely formed one.

Indicator enabling the analysis of the relationship between two derivatives. There are different methods of presentation relationship. The attached video shows all the functionality of the indicator.
Input parameters Anchor_mode - sets the end of the measurement to the current candle. Follow_mode - if true, the beginning of the measurement (START line) follows a fixed distance after its end (END line). Follow_distance - distance, (in candles) between the beginning and the end of the measurement

We-Point is an indicator for MT4 that help trader to read charts and research the point of Accelerator of the trend.
We-Point indicator is a useful tool for traders who want to study the direction of an underlying. We-Point indicator uses a mathematical formula that generates points in Red (which indicate bearish trend) and in Green (which indicate uptrend trend). When a Green (or Red) point will appear on the chart the trader will receive an alert (pop-up or push). We-Point indicator can be us

The central strategy of the EA is based on the Elliott Wave Theory. When the second wave is a correction, you can open order in the direction of a trendline and use the fluctuations of the third wave to take profit. Stop loss will be set at the highest or the lowest price in the past. Each order has a stop loss. The EA is not Martingale, so the risk is controllable.
Parameters StoplossParameter: Actual stop loss = Theoretical stop loss multiplied by the stop loss factor, and the value range is

Arrow indicator utilizing variable Parabolic SAR and EMA for trending markets . Will show trend being established and trend continuation , allowing you to ride long trends or scalp. Designed for: Scalping Intraday trading Long-term trading Effective for: Currency Pairs Indices Oil Silver Gold Crypto Recommended timeframes: H1 H4 Daily Weekly Monthly For shorter timeframes, please adjust fully customizable settings. Test to find the optimum settings to suit your trading style. Function
Arrow is

This Expert Advisor's main strategy is based on the usage of two kind of indicators: two built-in shifted MFI (Money Flow Index) to measure the asset prices oscillations and two Moving Averages calculated over Open Prices and Close Prices to confirm the trends. It combines these indicators signals in order to get stronger signals and ensure the EA will do good trading operations. The second strategy consists of sending a new opposite order against a losing order since it reaches the minimum nega

Asia Balance is a multi-currency night trading robot, which only trades during the calm market period. The monitoring of the demo account is available now. Monitoring : www.mql5.com/en/signals/425078 (started on 2018.05.07) The Expert Advisor determines the range of the night corridor of the price movement and enters a trade when a signal emerges. A fixed StopLoss is used. TakeProfit is floating , it is set at the opposite border of the volatility channel. The EA has a built-in algorithm for ear

ForexGumpUltra is a new and more advanced indicator of the ForexGump series. This indicator easily determines the price direction on any currency pair and any timeframe. The indicator draws its signals on the zero bar and does not redraw them (see the video). In the 34th second of the video it can be seen that this indicator uses new filters to determine the changes in price movement direction without delay, despite the market noise present at the moment (see the video on the 34th second). Once

NC Night EA is an ultra-short-term EA system based on moving average during the night swing market, supporting single currency or multi-currency operations. Short-term operation when oscillating at night. According to the average movement of the swing period, judge the timing of entry. Set the stop loss range by yourself and the risk is more controllable The risk level can be flexibly set. Of course, risk and profit are often proportional too.
Parameters MoneyManagementType: Fund management mod
The MA Grid Expert Advisor trades a grid of orders using moving averages to determine market entries. Take Profit is used for exits. You can limit the number of open orders in the grid and also limit the loss in the deposit currency. Autolot calculation can be used (Autolot = Balance/Autolot Step*Lot). The EA is based on the averaging principle, but it can also be configured to work with loss fixing.
Inputs Lot - fixed lot value if Autolot is disabled; Autolot - enable automated lot calculation

PivotSupportResistance This indicator plots horizontal lines at daily pivot levels R3, R2, R1, Pivot, S1, S2, S3, where R means Resistance and S means Support. This indicator can be applied to any chart period, although daily pivots on charts with long periods are meaningless (if you switch your chart timeframe greater than daily chart, you will get alert and indicator will not work). Labels are shown for the most recent day's levels. There are no external inputs, so it is easy to use. Please re

T Dog is a fully automatic trading robot which is the result of more than 10 years of the market study and programming expert advisors. You could run on all Forex, Indexes and Commodities. It uses a multiple indicators to determine the market entry with an advanced exit-algorithms. T Dog build-in News filter which able to stop trading during the news releases. It also possible to enable the trailing stop to secure your profits. No Grid No Martingale No Hedging No Arbitrage It is advised to use a

Expert Advisor for night scalping. It works at the end of the American session and at the beginning of the Asian session. The working timeframe is M15 and M5.
The Expert Advisor trades in a channel. It uses standard MetaTrader 4 indicators for market entries and exits. A stop loss is assigned to each order. The EA does not use toxic trading methods, such as averaging or martingale. Set files will be provided in the Comments section for the traded currency pairs. The EA features a news filter, w

The We-Spread mt4 indicator is a spread trading tools and it is suitable for those who want to study the markets with a different approach to the contents that are normally available in online trading bookstores. I think the Spread Trading strategy is one of the best I've ever used in the last few years. This is a unique indicator for spread trading because allow you to study till 3 spreads in one time. What is Spread Trading on forex The Spread Trading is the study of the strength of 2 currency

Risk controller is a tool allowing you to automatically control orders, losses and emotionally motivated actions.
Main advantages Limitation of the total account loss. When the MinimalDepo value is reached, any trade will be closed. Limitation of losses per day. Limitation of losses in each trade. If a trade is accidentally opened with a large volume, the excessive volume is closed. Set the maximum number of trades opened at a time. Set the number of consecutive unprofitable trades. Set the max
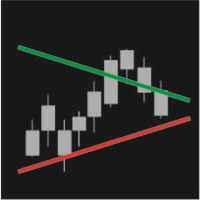
IntradayTrack displays daily support and resistance lines based on the average symbol volatility for a certain period. You can tilt the line to a certain angle both at the beginning and the end of a trading period.
Parameters Track period - the period of drawing lines (day, week, month) Avg price range – number of days the average volatility is considered for
Start value (Avg %) – distance between the lines at the beginning of a trading day in % of the average volatility for a selected period E

The Easy Strategy Builder (ESB) is a " Do It Yourself " solution that allows you to create a wide range of the automated trading strategies without any line of codes. This is the world’s easiest method to automate your strategies that can be used in STP, ECN and FIFO brokers. No drag and drop is needed. Just by set conditions of your trading strategy and change settings on desired values and let it work in your account. ESB has hundreds of modules to define unlimited possibilities of strategi
The Expert Advisor algorithm determines on daily charts those candlestick patterns, which set the intraday trading direction. The trading EA determines how long the price is moving in overbought/oversold zones and starts working in the direction of the expected trend movement. Each position is accompanied with a tight stop loss and take profit. Only one active position can be open in the market. The EA was developed and tested using 99% quality quotes. The Expert Advisor has a built-in news filt
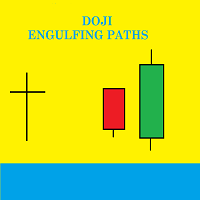
Presentation Doji Engulfing Paths enables to get signals and data about the doji and the engulfing patterns on charts. It makes it possible to get opportunities from trends, and to follow the directional moves to get some profits on the forex and stocks markets. It is a good advantage to take all the appearing opportunities with reversal signals and direct signals in order to obtain some profits on the forex market.
System features With fast execution, it allows to register directly the informa

Algorithmic Robot is a fully automated EA that works on USDCAD pair and uses built-in algorithms (flexibility algorithms plus loop and star algorithms) to trade on the medium-term period. It has passed more than 5 years of backtest on real tick data with 99.9% accuracy (check screenshots section). Also it has protection against severe market moves and spread fluctuations. Minimum deposit: $1000 for standard accounts or $10 for micro accounts.
Parameters Algorithm_1_Flexibility - represent the f

This indicator displays Bollinger Bands signals for multiple symbols and multiple time frames. The signals are created as a simple ratios which represent the distance between the current price and the moving average measured in standard deviations. This way we create a very versatile and easy to use indicator which helps us to identify not only the strongest trends but also the most overbought and oversold conditions.
Features Accurate signals in real time for multiple time frames and multiple
Fibo Martingale System is martingale grid Expert Advisor, that is specially tailored for EURJPY. It trades long and short positions in the same time using its lot size progression on every grid level. The timeframe is not important, it does not trade on bar close. The most important think to respect is - for 0,01 starting lot you need an account of 25 000 $ at least - using smaller account is at your own risk. The default settings are ready to go, you do not need to change anything. By default t

The Analytic Trade indicator is a complete trading system. It consists of 4 parts: The first part is the arrows showing the most optimal points for opening and closing orders. The up arrow is a buy signal, the down arrow is a sell one. The second part is the information panel in the upper right corner. The current price is shown in a larger font, above it are: the daily High, distance from the current price to the daily High, and the difference between the High and Low (in points). Below it are:

Trend-Scanner is an indicator for MetaTrader 4 that allows you to view 3 types of trends and signals on the charts. Trend-Scanner searches for 3 types of trading signals on all the underlying assets listed in the settings (and can be customized by the trader). If there are conditions that allow you to identify reliable trends then a pop-up alert will be displayed, a sound notification and a push notification will be sent. Trend-Scanner constantly searches for signals deriving from patterns devel
The indicator enables measurement and analysis of accumulated volume (tick), in any chosen swing. The user's task is to mark individual measuring sections with the help of a "crayon's". The indicator automatically sums the volumes of individual candles. Volume analysis is a basic element of the VSA (volume spread analysis) technique. A method of using an indicator is shown on the film.
Parameters description Anchor_mode - If true, one end of the measuring line is always hooked on the current ca

This product is a product completed by combining Bollinger band and RSI. Usage is as follows. There is no indicator parameter, so there is no need to change it.
Explanation It shows RSI in the Bollinger Bands. The market is stable when both indicators are located between 30 to 70. You can use this indicator for the contrarian when the market continues to be quiet.

This indicator is based on the Bollinger Bands on one or more timeframes and on any Currency Cross Pair. The indicator generates an alert message when it detects a buy or sell signal. It also draws a vertical bar on the price chart: green for buy or red for sell, white if flat. Alert messages and Vertical bars for BUY or SELL, are generated when the Bollinger Bands is consistent for all chosen timeframes else a FLAT signal is generated. In addition, the Multi TimeFrames Bollinger Bands Signals i

PriceChannel is designed for trend detection without the effect of accidental price leaps. It uses Price Series and a few moving averages for noise reduction. It works on multiple timeframes, even M1. To increase effectiveness, it is recommended to use 3 instances of PriceChannel with different parameters on one chart (see screenshots). You can use the following settings (for M1 charts): PriceChannel(10,2,30) Gold colour. PriceChannel(10,5,30) Blue colour. PriceChannel(21,8,13) Gray colour. Exa
The principle of this indicator is very simple: detecting the trend with Moving Average, then monitoring the return point of graph by using the crossing of Stochastic Oscillator and finally predicting BUY and SELL signal with arrows, alerts and notifications. The parameters are fixed and automatically calculated on each time frame. Example:
If you install indicator on EURUSD, timeframe M5: the indicator will detect the main trend with the Moving Average on this timeframe (for example the Moving

Introduction to Athekros The development team has a finance and risk management background and for this reason the EA exploits main financial theories in order to trade. The trading system has been built with a primary goal: replicate the strategies of investment funds exploiting the accessibility of retail trading systems. For this reason performance are designed for longer time horizons. You do not need any knowledge, use default settings and no pre-optimization needed since optimization is no
This product combines Stochastic Oscillator and RSI. Usage is as follows. This indicator works with M1 and M5 timeframes. This indicator uses Stochastic oscillator and RSI. The picture shows Stochastic x1 (Red) and RSI x2. You can open a short position when each Stochastic, RSI (Blue) and RSI (Yellow) become more than 95, 70, and 70, or a long position at values less than 5, 30, and 30, respectively.
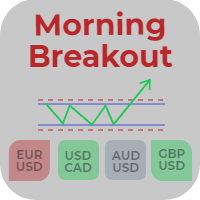
Morning Breakout is an indicator that calculates the morning range where a symbol has been moving in a period of time. It also displays that levels in the current symbol. Through this indicator you can analyze and track all the symbols you want to invest in. It also includes alerts, mails and notifications that enables the possibility to look for new market opportunities. Main Features of Morning Breakout Track all the symbols you want to invest in or the symbols in your market watch. Apply a co

Introducing the revolutionary 3 Peaks indicator on MQL5 – your ultimate trend-spotting companion! As an experienced trader and dedicated seller, I am thrilled to offer you a powerful tool that brings unprecedented accuracy and reliability to your trading endeavors. The 3 Peaks indicator boasts an impressive capability: it identifies and alerts you on-screen whenever three consecutive peaks are detected. No matter the representation chart, time-frame, or currency pair/commodity you're trading, t

The CSM System is currently fully automated with all the special features and functions, controlled and regularly monitored. Its evolution, parameters and the individual algorithms are professionally evaluated and optimized by experienced development group of programmers who are developing new updated versions of system. Unlike the other systems, we focused to create the system where the backtesting successful results matching the real life situation. Our core lies in identification of these bi

The indicator helps you trade following the VSA (Volume Spread Analysis) and PRICE ACTION methods, as well as study these methods from a perspective. The indicator searches for VSA and PRICE ACTION patterns considering the current trend. It is possible to view the patterns of the higher timeframe on the current timeframe chart. The custom mode allows you to find your patterns based on VSA method. Also, there is a volume histogram that automatically configures the width and visual horizontal leve

Folding rule of 4 trend lines The indicator has been created based on the "Folding rule" trading strategy. It shows four pairs of inclined resistance and support lines. These lines are plotted based on the nearest High and Low of the ZigZag technical indicator with four given input parameters. The indicator draws dots above and below the price extremums that have been used for plotting the trend lines. The indicator of trend lines facilitates the plotting of trend lines, channels and technical p

This Expert Advisor is based on the "Ilan 1.6 Dynamic" Advisor with full preservation of the idea and input parameters. The "Ilan 1.6 Dynamic" advisor is the predecessor of all Ilans and the most recognizable Martingale method Forex advisor. The number of titles given to this development can hardly be counted. In fact, the Advisor uses a simple trading strategy based on two standard technical indicators - RSI (Relative Strength Index) and CCI (Commodity Channel Index) . The first one is used to

Endeavor EA does not use indicators. It trades the strategy based on trading by hours and the breakout of support and resistance levels. Logic of the EA: it trades during the active phases of the Asian, European and American sessions and allows you to capture almost all the daily trend. It analyzes the history and places pending orders to follow the market direction in case of a breakout. The EA provides the options to close orders by profit or by time. When the price moves in the favorable dire

BinaryScalping is a professional indicator for trading binary options and scalping. The algorithm of the indicator is based on the calculation of pivot points for each time period separately, the location of the price of the trading instrument relative to the pivot points is analyzed and the probability of a trading operation is calculated. The indicator has a built-in filter of trading signals based on the global trend. The indicator is installed in the usual way and works with any trading inst

This is indicator signals entry buy or sell for trader. It notification price entry to trader and price Stop Loss and price Take Profit. Indicator price for entry orders Pending Limit.
Input Parameters On Alert - true/false (Displays a message in a separate window.) On Send Notification - false/true. (Sends push notifications to the mobile terminals, whose Meta Quotes IDs are specified in the "Notifications" tab. (Strict use restrictions are set for the SendNotification() function: no more than
" MONALISA (acronym of MON itor A nd LIS t A ll) Stochastic" is an indicator based on the Stochastic Oscillator on all timeframes of any Currency Cross Pair. The indicator shows all Timeframes (from M1 to MN1) and colors in GREEN or RED that Timeframe that results in BUY or SELL based on the Stochastic Oscillator. This indicator is useful because it allows you to have a complete view of all Timeframes at the same time.
Features Easy flexible settings: Detection of the Stochastic signal for all

This is an automatic 24-hour trading system based on the algorithm of collective behavior of adaptive automata (a kind of algorithms of self-learning of artificial intelligence) that does not require manual intervention and does not use any indicators or well-known trading methods. The principle of the EA is to remember and analyze each step. A step is a price movement for a certain number (BaseStep) of points up or down. The depth of memory (how many steps to remember and analyze) is determined

ForexAurum Fibonacci indicator is a useful tool for traders who are using Fibonacci combined with the ZigZag indicators. It uses the real-time calculation of the levels for all the timeframes and displays the results for you. In addition, you can setup RSI, ADX and Stochastic indicators to confirm entries.
How to use it Just drag and drop the indicator on an 1 minute chart of any symbol. Then you can switch to a higher timeframe at anytime after the initialization.
Recommendation Always drag a
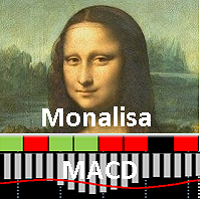
" MONALISA (acronym of MON itor A nd LIS t A ll) MACD" is an indicator based on the MACD Oscillator on all timeframes of any Currency Cross Pair. The indicator shows all Timeframes (from M1 to MN1) and colors in GREEN or RED that Timeframe that results in BUY or SELL based on the MACD Oscillator. This indicator is useful because it allows you to have a complete view of all Timeframes at the same time.
Features Easy flexible settings: Detection of the MACD signal for all timeframes No setting le

Value History is a very convenient indicator that returns the movement information both in terms of pips or points and in percentage terms. This indicator is useful for making historical analyzes and verifying previous movements in order to look for recurrences of volatility. Percentage values are returned based on the closing price of the previous movement while the point value can also be calculated on the minimum and maximum of the previous movement. Personally, I use this indicator to evalua

MCTC is the most advanced multicurrency strength indicator for day trading, that does NOT use moving averages. This versatile strength meter has many settings that can be customized to suit the day traders needs. With up to 12 customization time periods, automatic calculation and graph plotting of previous period high/low values, 2 side meters showing currency strength, pair strength, points movement, points movement from previous periods, percentage, and pressure. Clickable chart for fast switc
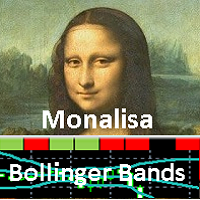
" MONALISA (acronym of MON itor A nd LIS t A ll) Bollinger Bands" is an indicator based on the Bollinger Bands indicator on all timeframes of any Currency Cross Pair. The indicator shows all Timeframes (from M1 to MN1) and colors in GREEN or RED that Timeframe that results in BUY or SELL based on the Bollinger Bands indicator. In addition, this indicator measures the " POWER " of the Trend that is highlighted on the middle line of the Bollinger Bands (SMA line) and in the table of Timeframes wit
O Mercado MetaTrader é o melhor lugar para vender robôs de negociação e indicadores técnicos.
Você apenas precisa desenvolver um aplicativo para a plataforma MetaTrader com um design atraente e uma boa descrição. Nós vamos explicar como publicar o seu produto no Mercado e oferecer a milhões de usuários MetaTrader.
Você está perdendo oportunidades de negociação:
- Aplicativos de negociação gratuitos
- 8 000+ sinais para cópia
- Notícias econômicas para análise dos mercados financeiros
Registro
Login
Se você não tem uma conta, por favor registre-se
Para login e uso do site MQL5.com, você deve ativar o uso de cookies.
Ative esta opção no seu navegador, caso contrário você não poderá fazer login.