Conheça o Mercado MQL5 no YouTube, assista aos vídeos tutoriais
Como comprar um robô de negociação ou indicador?
Execute seu EA na
hospedagem virtual
hospedagem virtual
Teste indicadores/robôs de negociação antes de comprá-los
Quer ganhar dinheiro no Mercado?
Como apresentar um produto para o consumidor final?
Novos Expert Advisors e Indicadores para MetaTrader 4 - 283
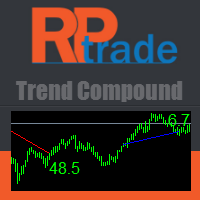
Trend Compound is a trend indicator using a mix of 3 internal other indicators. Please have a look at "how to test in the tester" at the bottom of this page before to test. It's designed to be used by anyone, even the complete newbie in trading can use it. Trend Compound does not repaint . Indications are given from close to close. Trend Compound can be used alone , no other indicators are required.
Trend Compound indicates Where to open your trades. When to close them. The potential quantity o

The indicator is based on a single Moving Average of a user-defined period. By analyzing the price movement of the price relative to this MA, and also by tracking all updates of the price Highs and Lows over the same period as the MA period, the indicator draws its own picture of the trend, avoiding the ever-breaking MA lines. Therefore, if the trend goes up, the line will also point upwards and will not change its direction even on small retracements, allowing to capture almost the entire trend
FREE

Free RSI expert advisor is a completely free expert advisor that trades using rsi level crosses. You can set which levels the Ea should use to open and close trades. The various settings are explained below. NOTE: The default settings are just place holders and not necessarily the best. Use the settings that best suites you or your strategy. Lots - This is the lot size of the EAs trades. 0.1 is the default setting. AllowBuy - Set to true to allow buy trades. This setting is true by default. Allo
FREE

This indicator shows the value of returns in the selected time frame .
They are calculated as logarithm of returns , rather than price or raw returns. For small returns, arithmetic and logarithmic returns will be similar. The benefit of using returns, versus prices, is normalization. It is possible measures all variables in a comparable metric despite originating from price series of unequal values.
Inputs You can display data both as a Histogram or a Line It's also possible to display th
FREE

This Currency Meter Calculates Strength Using a currency basket of 28 pairs? This Currency Meter uses a basket of 28 currency pair to define strength. This is very important because it gives an wholesome view of the strength of a currency by considering its reaction to all major currencies paired with it.
This Currency Meter is Multi-timeframe!!! Majority of the currency strength indicators around the market today only has a single time frame view. Even with the so called multi-timeframe versi

MMMBollingerXRSI EA strategy: The robot keeps checking RSI and Bollinger Bands all the time and does a calculation to determine the prices trends. If the currency pair's prices breaks the RSI upper line and also breaks the Bollinger Bands upper line, it sends a sell order. If the currency pair's price breaks the RSI lower line and also breaks the Bollinger Bands lower line, it sends a buy order. It will not send an order unless the calculations determines a good trend of profit; Like all MMM pro

Multicurrency scalper, works at night time, performing short trades during low volatility. For trading to be profitable, a broker with low night spreads is required. Working timeframe: M15 Working on a real account:
Type2 https://www.mql5.com/en/signals/245053 Mix https://www.mql5.com/en/signals/363093
Recovery Mix https://www.mql5.com/en/signals/493519 set files - see signal description
Installation instruction https://www.mql5.com/ru/blogs/post/721443
Input parameters MagicNumber – magi

The Expert Advisor looks for the bars followed by price rises or falls. It analyzes how often rises and falls occur after similar bars and makes trades based on that analysis. The market changes frequently but the EA is able to adapt to the changes performing analysis right during trading.
Input Parameters Lots - lot size (if 0, a lot is calculated based on the percentage of account free margin); Percentage of free money - the percentage of free margin to open each new trade (applicable when Lo

This utility binds each created graphical object to the chart symbol. Binding is performed by adding a symbol prefix to a graphical object name. Later, after you change the symbol on the chart, it provides displaying only the objects binded to the current symbol and all other objects become hidden.
Parameters Ignore objects with prefix - the indicator will skip graphical objects with the specified prefix in their names. Note: demo version from the market is limited to strategy tester and cannot
FREE

Semi Automated EA for working as your trading assistant.
Overview Trading planner will make you act like professional traders in real markets. Before entering markets, they make a plan for their trades, screening out all opportunities in all time frames. Trading Planner can be used for all Time Frames (M1 ~ MN). Simply draw trendline as a trend and Support/Resistance . At this version , market opportunities will be taken by trendline using strategy of 1, 2, 3 . Simply draw the trendline by defin

The trade copier is designed for a fast and accurate copying of orders between the MetaTrader 4 terminals. The trade copier copies trades from the Master account to the Slave account by writing information to the total file, which is located in the common directory of the MetaTrader 4 terminals. This allows the trade copier to either customize various schemes for receiving and transmitting trade signals by changing the file name. Reading and writing the copier file is performed by timer. The tra

The EasyTrend is a seemingly simple but quite powerful trend indicator. Everyone has probably come across indicators or Expert Advisors that contain numerous input parameters that are difficult to understand. Here you will not see dozens of input parameters, the purpose of which is only clear to the developer. Instead, an artificial neural network handles the configuration of the parameters.
Input Parameters The indicator is as simple as possible, so there are only 2 input parameters: Alert - i
如果产品有任何问题或者您需要在此产品上添加功能,请联系我 Contact/message me if you encounter any issue using the product or need extra feature to add on the base version.
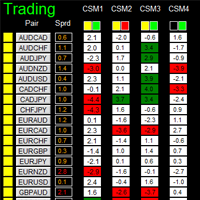
There is a Demo version of this panel Dashboard Currency Strength Meter AdvancedDemo in my product list, please try it out to get familiar with all functionalities free, LINK . The Dashboard Currency Strength Meter Advanced gives you a quick visual guide to which currencies are strong, and which ones are weak over the customized 4 time-frames and period.
如果产品有任何问题或者您需要在此产品上添加功能,请联系我 Contact/message me if you encounter any issue using the product or need extra feature to add on the base version.
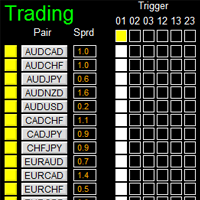
There is Demo version of this panel Dashboard Super Three MA Demo in my product list, please try it out to get familiar with all functionalities free, LINK . This system basically utilizes PA and three adjustable Moving Average as the main indicator set to generate trading signal. With the feature that all MA_timeframe, MA_period, MA_applied_price are ad
如果产品有任何问题或者您需要在此产品上添加功能,请联系我 Contact/message me if you encounter any issue using the product or need extra feature to add on the base version.
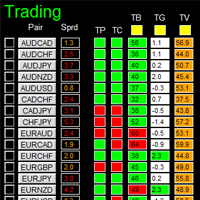
There is Demo version of this panel Dashboard Timeframe 15 Demo in my product list, please try it out to get familiar with all functionalities free, LINK . This system basically utilizes TDI as the core indicator to generate trading signal mainly on time-frame M15. The signal will be further filtered and trimmed by 1) 200 EMA and Price; 2) 10 EMA and Hei
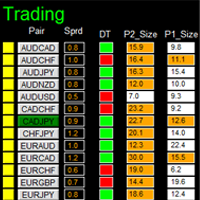
如果产品有任何问题或者您需要在此产品上添加功能,请联系我 Contact/message me if you encounter any issue using the product or need extra feature to add on the base version.
DIBS = Daily Inside Bar Setup This system basically utilizes the popular candle pattern Inside Bar to generate trading signal mainly on time-frame H1. To facilitate you to understand and trade this system quickly and effectively, the collection of PDF manuals and tips are provided in my latest comment of this product. For who cannot access Google Drive,
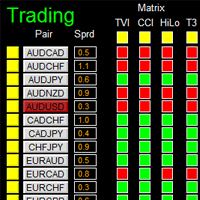
如果产品有任何问题或者您需要在此产品上添加功能,请联系我 Contact/message me if you encounter any issue using the product or need extra feature to add on the base version.
There is Demo version of this panel Dashboard Genesis Matrix Trading Demo in my product list, please try it out to get familiar with all functionalities free, LINK . This system basically utilizes Genesis Indi Set (TVI, CCI, GannHilo, and T3) as the core indicators to generate trading signal mainly on time-frame M15. The signal will be further filtered a
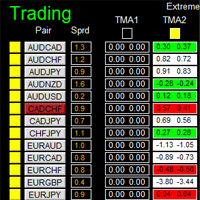
如果产品有任何问题或者您需要在此产品上添加功能,请联系我 Contact/message me if you encounter any issue using the product or need extra feature to add on the base version.
There is Demo version of this panel Dashboard Extreme TMA System Demo in my product list, please try it out to get familiar with all functionalities free, LINK . This system basically utilizes 4 TMA (Triangular Moving Average) slope indicators on 4 time-frame and TMA Band as the core indicators to generate trading signal mainly on time-frame M15. The sig

The indicator displays Renko bars on the chart, plots a channel based on that data and generates buy/sell signals. Renko is a non-trivial price display method, in which a bar within a time interval is shown on the chart only if the price has moved a certain number of points. Renko bars do not depend on a time interval, therefore the indicator works on any timeframe without losing its efficiency. The channel is defined as the upper and lower boundaries of the price movement over the specified per

This semaphore indicator is based in the standard RSI, which is applied over the Envelopes indicator that shows an envelope or envelope fluctuation borders. This is a version of RSI vs Envelopes Graph drawn in a separate window . A sell signal emerges when the upper envelope/border is broken by the RSI indicator from top to bottom. A buy signal emerges when the lower envelope/border is broken by the RSI indicator from bottom upwards. The indicator can draw arrows on the indicator, draw vertical
FREE

This semaphore indicator is based in the standard RSI, which is applied over the Envelopes indicator that shows an envelope or envelope fluctuation borders. This is a version of RSI vs Envelopes drawn in the symbol window . A sell signal emerges when the upper envelope/border is broken by the RSI indicator from top to bottom. A buy signal emerges when the lower envelope/border is broken by the RSI indicator from bottom upwards. The indicator can draw arrows on the indicator, draw vertical lines
FREE

The Golden scalper Pro is an Expert Advisor that uses the scalping tactics. However, apart from using the classic application methods for these tactics, it uses numerous functions responsible for high-quality analysis of the current market situation and filtering false signals. This provides an excellent trading result. The EA uses price channel for trading. When the price crosses the channel, a deal is opened in a certain direction, with consideration of all rules for filtering false signals. T
MetaTrader 5 ported version is available here: Lot Calculator Tool MT5 . This tool helps you to automatically calculate and manage risk, conveniently place orders visually, schedule orders, trail stops, move them to break-even, manually test strategies and more.
Features Place market or pending orders using draggable lines Schedule orders Calculate and limit risk using various methods See current spread See time till next candle Set custom order comments Trail stops Move stops to break-even S

The Super scalper universal is a fully automated scalping Expert Advisor, which uses five indicators. Each open position is protected by a hidden stop order managed by an advanced modification algorithm. When searching for the suitable signals, the EA uses the integrated indicator in conjunction with the trend and time filters, as well as the volatility filter. It use dynamic position closure, which considers the location where the order had been opened and the subsequent price action. Profit is

O Telegram Publisher Agent é um complemento que permite que os traders enviem sinais para seus canais e grupos do Telegram em tempo real. Com mensagens personalizáveis, capturas de tela de gráficos e outros recursos, a ferramenta ajuda os traders a compartilhar suas ideias e estratégias de negociação com seus seguidores. A ferramenta também apresenta um belo design com alternância de tema claro e escuro, proporcionando aos usuários uma experiência de negociação estética e funcional. O Telegram

Bar Boss O Expert Advisor usa o indicador FletBoxPush para analisar o mercado e determinar os sinais de negociação. O indicador é integrado ao Expert Advisor e sua instalação adicional no gráfico não é necessária. A negociação ocorre no rompimento dos níveis definidos como os limites do apartamento. Limitação de perdas é usada.
Descrição das configurações do consultor TimeFrames - período do gráfico, configuração para o indicador color - a cor da área de preço definida como plana, configura

This utility allows to switch among symbols. You have to insert in the input your favorite tickers. it is possible to customize up to 5 symbols
Shortcut Keys : Switch among Symbols : A -Forward D -Backward
Inputs You can setup your favorite keys to switch among symbols.
You can customize the color of background and the edge of the buttons .
You can customize the labels : dimension and font.
FREE

The indicator calculates the angle between the Highs, Lows and Closes of neighboring bars. The angle can be measured in degrees or radians. A linear chart or a histogram is drawn in a subwindow. You can set the scale for the calculation — floating or fixed. For use in the EA, you need to specify a fixed scale.
Parameters Angular measure — degrees or radians. Scale mode for calculation — scaling mode. Free scale — free transformation, the indicator will calculate values each time the chart scale
FREE
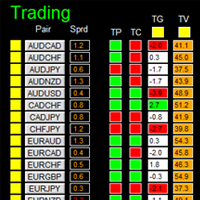
Contact/message me if you encounter any issue using the product or need extra feature to add on the base version.
There is a demo version of this panel Dashboard Trading Made Simple Demo in my product list, please try it out to get familiar with all functionalities free, LINK . This system basically utilizes TDI as the main indicator to generate trading signal mainly on H1 and H4 timeframes. The signal will be further filtered and trimmed.
Stochastic; Heiken Ashi candle direction and candle siz
SAAD TrendTracker is a fully automated EA. It is based on mathematical algorithms Trend Tracker indicator and SAADScalper. The EA scalps pips by its strong Entry strategy based on SAADScalper. Trades that are not successful to scalp are handled in a different way of uniquely designed algorithm based on Trend Tracker indicator. EA is designed for M1, M5, M15 and M30. It consults daily chart for successful trading accuracy. It consults H1 to handle unsuccessful trades using Trend Tracker Indicator
FREE

The indicator displays Renko bars on the chart, uses their data to calculate and display the Bollinger Bands, MACD oscillator and generates buy/sell signals. Renko is a non-trivial price display method, in which a bar within a time interval is shown on the chart only if the price has moved a certain number of points. Renko bars do not depend on a time interval, therefore the indicator works on any timeframe without losing its efficiency. When attached to a chart, the indicator checks for presenc

ATR Volatility plots the ATR-based volatility, and triggers alerts when it crosses user-defined upper and lower thresholds (purple and tan lines, please see screenshots). Circles are painted when ATR volatility crosses either above the upper threshold, or below the lower threshold. This is a small tool custom-built by our group, by specific request of one of our customers. We hope you enjoy! Do you have an indicator you would like to see designed? Feel free to send us a message! Click here for m
FREE

This robot combines three ways of trading and for all uses the same successful money management. All three ways of trading can be used simultaneously or separately. Auto search and trading SR levels and their breakout. News trading - at a specified time placed pending orders for BUY and SELL. Manual opening trades using buttons in the chart. For these your trades will use the same money management as for automated trading.
Is recommended ECN broker with minimal spread and with minimal slip and

The BG Unda Expert Advisor trades based on the Bollinger Bands indicator. The default settings are designed for trading on the M15 timeframe. With these settings, the EA operates in the classic night scalper mode. Description changed 05.11.2019: all old set files are not suitable for working on real accounts.
Actual settings can be downloaded in the "Discussion" (post 852). https://www.mql5.com/en/market/product/19091#!tab=tab_p_comments&comment=13307140&page=43 Live signal - https://www.mql5.

Did you ever wish if you can control how to auto close multiple trades in your account that are opened by multiple/different EA's ? Well.. Good news.. You're at the right place because now you can do this with MagicClose. Below are the inputs of MagicClose, going through them will give you a detailed idea what this handy EA is capable of: Chart timeframe: any
Parameters Settings to control the Buys open trades: Enable Buys monitoring - true/false Buys Magics to monitor - Enter magic number foll

Padrões harmônicos , Scanner e comerciante se você preferir ver isso em um gráfico ao vivo em vez de ler a descrição, você pode baixar instantaneamente uma demonstração gratuita aqui. Padrões incluídos:
Padrão ABCD Padrão Gartley Padrão de morcego Padrão de cifra 3Padrão de acionamentos Padrão Cisne Negro Padrão de cisne branco Padrão Quasimodo ou padrão Over Under Padrão de morcego alternativo Padrão de borboleta Padrão de caranguejo profundo Padrão de caranguejo Padrão de tubarão Padrão de ci
FREE

"The trend is your friend" is one of the best known sayings in investing, because capturing large trendy price movements can be extremely profitable. However, trading with the trend is often easier said than done, because many indicators are based on price reversals not trends. These aren't very effective at identifying trendy periods, or predicting whether trends will continue. We developed the Trendiness Index to help address this problem by indicating the strength and direction of price trend

AnyChart is a multifunctional tool allowing you to work with non-standard charts in MetaTrader 4. It includes collector of ticks and generator of charts for trading (hst files) and testing (fxt files). Supported chart types are second, tick and renko ones.
Settings Starting Date - start date for chart plotting. Ending Date - end date for chart plotting. Chart Type - chart type: Time - time chart, each bar contains a certain time interval; Tick - volume chart, each bar contains a certain number

Medium-term trading system that tries to profit during the price rollbacks after significant movements. The EA is effective on the EURJPY pair. It was backtested using real ticks with 99.9% quality. The Expert Advisor has successfully passed testing with conditions approximated to the real market conditions, and it has a minimum of parameters for optimization, which eliminates the possibility of curve fitting. It is possible to trade in manual mode using a simple on-screen panel or in fully auto
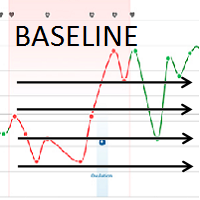
The Baseline Balance tool shows multiple pivot lines for short, mid and long time market cycles. Thus trader can easy identify local or global S/R (support/resistance) levels for better timing of investments and entries to the market. Due to the multifunctional menu directly on chart the settings is fast and accurate. Pivot lines are generated for H1, H4, Daily, Weekly, Monthly, Yearly timeshares. Menu on chart shows following settings: Line Display Settings Middle_Lines – shows middle calculati

MetaCOT 2 CFTC ToolBox Demo is a special demo version of a full-featured library MetaCOT 2 CFTC ToolBox MT4 . The demo version does not have any limitations, but it outputs data with a delay in contrast to the full version. The library provides access to the CFTC reports (U.S. Commodity Futures Trading Commission) reports straight from the MetaTrader terminal. The library includes all indicators that are based on these reports. With this library you do not need to purchase each MetaCOT indicator
FREE
This is the famous FX Sniper's T3 CCI indicator. It is a fixed version additionally containing search for classical and reverse (hidden) divergence. The classical divergence is displayed as a solid line, the reverse divergence is shown as a dotted line. Divergences are drawn in the indicator and on the chart (if you select the appropriate options).
Parameters
CCI Period — Commodity Channel Index indicator period CCI Type of price — price used for indicator calculation T3 Period — Sniper period
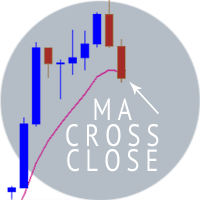
Managing risk is crucial if you want to be successful in trading the Forex market. The purpose of the Moving Average Cross Close is to close your trade automatically once price closes above your choice of moving average time period, in a short trade or below the moving average in a long trade. Having the ability to automatically close open trades under these conditions, gives you the discipline to close trades that are beginning to move against you. As we all know, it is often difficult to close

ALT is a fully automated trading Expert Advisor designed for the EURUSD pair. It trades on the M15 timeframe (not tested on other timeframes or pairs). The trading volume used to open a position is defined by the Expert Advisor, it does not depend on the result of the previous trades.
Features The EA uses automated settings, no need to additionally tune it, except for the stop loss setting . Resistant to a temporary loss of connection or a short-term computer shutdown. After starting the comput
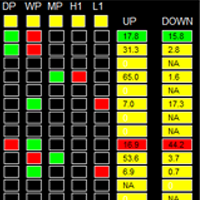
如果产品有任何问题或者您需要在此产品上添加功能,请联系我 Contact/message me if you encounter any issue using the product or need extra feature to add on the base version.
Please re-direct to LINK for free demo version. There are two critical components in a profitable trading system, one is entry (place an order), and another one is exit (close an order). You can exit by time: closing order after London Close for example. You can also exit by position: closing an order when price reaches a certain support/resistance level

A ready-made trading system based on automatic construction and maintenance of Fibonacci levels for buying and selling on any instrument (symbol) and on any period of the chart. Determination of trend direction (14 indicators). The display of the trend strength and the values of the indicators that make up the direction of the trend. Construction of horizontal levels, support and resistance lines, channels. Choosing a variant for calculating Fibonacci levels (six different methods). Alert system

如果产品有任何问题或者您需要在此产品上添加功能,请联系我 Contact/message me if you encounter any issue using the product or need extra feature to add on the base version.
To access the free demo version, please re-direct to this LINK . To access the single pair version, please re-direct to this LINK . Price is likely to pullback or breakout at important support and/or resistance. This dashboard is designed to help you monitor these critical support and resistance area. Once price moves close to these important support and
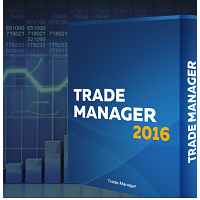
A new way of managing your trades – efficiently, automatically and with no emotions. Control various markets and manage many different trades at one moment. Grasp your competitive advantage and ultimately find out what profitable trading looks like! Trademanager is a piece of software developed for MT4 platforms. This tool enables you to completely set up all parameters for many different trades on many different markets – at one time and with no emotions as psychological obstacles. Must-need to

"The VIX Fix is a powerful indicator that detects market bottoms for any asset " The VIX (volatility index) is a ticker symbol of implied volatility of the S&P 500, calculated by the Chicago Board Options Exchange. VIX is a popular measure of market risk, and is one of the best measures of market bottoms that currently exists. Unfortunately, it only exists for the S&P 500... The VIX Fix was published by Larry Williams in 2007, and it synthesizes a VIX volatility index for any asset (not just the

The main objective of the indicator is an accurate forecast of short-term trends. A rising channel is usually broken downwards and replaced with a falling one when confirmed by tick volumes, while a falling one is usually broken upwards and replaced with a rising one again when confirmed by tick volumes. Sometimes, upward and downward channels are replaced with flats. A channel width and duration are defined by the market situation and market phase (bullish or bearish). In our case, tick volumes
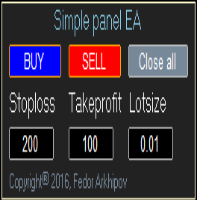
This is a simple panel EA for one-click trading. Unlike the standard panel, it features the Close all button for closing all orders on the current symbol, as well as the ability to enter the stop loss and take profit values before opening an order. The EA distinguishes its orders from others, therefore, the magic number must be specified in the panel settings. The panel is able to take screenshots when opening and closing deals to allow further analysis of the signals for opening/closing orders.
FREE

This utility provides the ability to use hot keys in manual trading instantly responding to the current market situation. You can assign hot keys to open/close positions by their type, close all positions on the current chart and remove all orders on the current chart. You can also assign hot keys for five predefined trade volumes and switch between them if necessary with no need to change the volume manually from time to time. It is also possible to set the auto calculation of a trade volume in
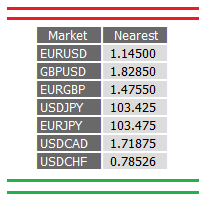
Price level alert is a software that gives you an overview of your all drawn levels (supports and resistances) for more than 10 markets in only one elegant table which you can see right in your chart. Price alert is not only this, it also sends you notification (alert) when a market has reached one of your predefined levels. Therefore, this is a must-have tool for all traders who want to cut the time sitting in front of a computer significantly and not to miss any trade.
Settings (inputs) Symbo
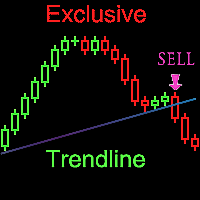
Every experienced trader knows that the trend lines should be paid attention in Forex trading. But plotting trend lines takes time, and there can be many of them on the chart as well... Yikes!!! Do you want to know how to easily and simply automate this process? Then read on. There is a solution - a smart and reliable indicator of trend lines - the Exclusive Trendline . All you need to do is attach the indicator to the chart, and it will draw all possible trend lines for you. You just have to ad

The EW oscillator is an indicator for the MetaTrader 4 based on mathematical calculations on the price chart.
Distinctive features Generates minimum false signals. Excellent for identifying trend reversals. Perfect for scalping. Simple and easy indicator configuration. Suitable for working on the smaller timeframes (up to H4). Works on any financial instrument.
Recommended symbols EURUSD, EURGBP, USDCHF, AUDNZD, AUDCAD, GOLD.
Recommendations on usage The buy signal is formed when the level 20

FletBoxPush O indicador determina as áreas planas de movimento de preço de acordo com os parâmetros especificados. Definições:
TimeFrames - seleção do período do gráfico. FlatPips - limite em pontos para determinar um plano FlatBars - limitação no número de barras para determinar um flat CountBars - o número de barras no histórico para analisar o movimento do preço, em 0 todas as barras no histórico são analisadas Cor - a cor do segmento de preço definido como plano PriceTag - desenho adiciona

Professional Trend Convergence/Divergence Indicator TCD indicator is based on the Convergence/Divergence of Trend and shows you " up trend " (when trend grows) and " down trend " (when trend is falling).
In the middle is an adjustable "stop area" on which you cannot trade.
Briefly, the TCD shows you when to start or stop buy/sell .
TCD indicator can run many instances, for all time frames and includes all 0 lag MAs . (Please see MAi indicator code section)
With TCD your trading becomes more pre

MetaCOT 2 CFTC ToolBox is a special library that provides access to CFTC (U.S. Commodity Futures Trading Commission) reports straight from the MetaTrader terminal. The library includes all indicators that are based on these reports. With this library you do not need to purchase each MetaCOT indicator separately. Instead, you can obtain a single set of all 34 indicators including additional indicators that are not available as separate versions. The library supports all types of reports, and prov
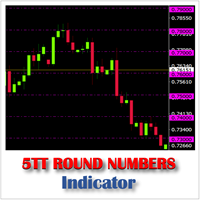
Like Support and Resistance levels, Round Numbers refer to price levels ending in one or more zeros, such as 125.00, 1.0350, 0.8750, 74.50, etc. These are psychological levels where financial institutions and traders expect price to either stall, retrace or breakthrough. On a price chart these figures are generally considered to rule off levels at the 50 and 100 mark. 5TT Round Numbers Indicator makes it absolutely easy for the trader to identify these levels on the chart without the laborious a

RSI EA Revolutionize Your Trading with Our Cutting-Edge RSI E Expert Advisor Tired of spending countless hours analyzing charts? Our advanced Expert Advisor, powered by the robust RSI E indicator and equipped with a sophisticated trailing stop loss feature, offers a fully automated solution to your trading needs. Key Features: * Fully Automated Trading : Set it and forget it! Our EA executes trades based on precise signals generated by the RSI E indicator. * Advanced Risk Management : Protect yo
Operation principles The Expert Advisor works on any timeframe and symbol. The main idea: flat is always followed by a strong movement. The EA determines when the price is located within a particular Delta_Range price range for a certain amount of time set in Time_Minus_Minut . Both parameters are customizable. The robot sets two BUYSTOP and SELLSTOP pending orders for a specified delta_stop_run time period on a Set_Delta_Price_Stop distance from the previous price range with the specified Set_T

AMD Trend Risk Reward is an indicator which belongs to the group of trend indicators. It provides the possibility to take the correct decisions about timely market entrances or exits. Trend horizontal can cause a lot of headaches to the traders and can be the reason of money loss. By automatic optimizing the settings of our AMD Trend Risk Reward indicator you can avoid most of them and save your money. How to choose the best chart? Press the button [O] on the chart. Indicator automatically optim

WaveTrend Momentum Oscillator is an upgrade to the popular and easy-to-use WaveTrend Oscillator. The WaveTrend Momentum Oscillator adds a momentum component to the original WaveTrend calculation, in order to provide faster and more accurate entry points during trendy market conditions. Do you prefer the original WaveTrend Oscillator? The WaveTrend Momentum Oscillator allows you to switch between momentum and original WT versions. Both provide valuable information depending on the market conditio

Indicator for collecting and storing ticks from the real market. Ticks are available in offline mode. The tick chart works like the standard time charts in MetaTrader 4. All indicators work on the tick chart. It is good for finding "pins" and spikes before the news releases. The indicator is good for scalpers and scalper systems. Templates also work. Settings: Period. - number of the period for collecting ticks. Default value is 2. You cannot use the standard minutes 1, 5, 15, 30, 60(hour), 240(

The "Irisha" is an Expert Advisor, in which we attempted to implement the ability of trading on smaller timeframes (1-15 minutes). The main idea lies in opening frequent trades and in the ability to "cover" losing trades with profitable ones. However, we had to resort to the Martingale strategy to implement the idea. Due to this, it is recommended to have a large deposit and/or cent account for using this EA. Operation of the EA on a live account can be evaluated here: https://www.mql5.com/en/si

This is a simple and efficient indicator based on market logic. The indicator creates a range chosen by a trader. Trader selects only two parameters. The first one is the number of candles that define the frame. The second one is the number of candles needed for confirmation frame. The indicator shows all situations in history and works with the actual movement of the market. The indicator works on all timeframes . You are not limited by use of different timeframes, the indicator is able to adap
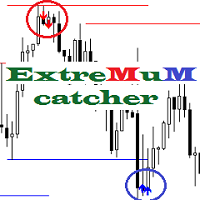
The Extremum catcher indicator analyzes the price action after breaking the local Highs and Lows, generates price reversal signals with the ability to plot the Price Channel. If you need the version for MetaTrader 5, see Extremum catcher MT5 . The indicator takes the High and Low of the price over the specified period - 24 bars by default (can be changed). Then, if on the previous candle the price broke the High or Low level and the new candle opened higher than the extremums, then a signal will

RFX Market Speed is an indicator designed to measure a new dimension of the market which has been hidden from the most traders. The indicator measures the speed of the market in terms of points per second and shows the measurements graphically on the chart, and saves the maximum bullish and bearish speeds per each bar. This indicator is specially designed to help the scalpers of any market with their decisions about the short bias of the market. Note: The indicator uses real-ticks and CANNOT be

Super sniper is the indicator that you're looking for This indicator has an active signal that also able to send push notification to your mobile MetaTrader 4 (see the screenshot for tutorial), so you won't miss any signal during active market. The signal is very simple, " down arrow " for sell and " up arrow " for buy. There are several options as below _SEND_NOTIF_TO_MOBILE: to enable push notification to your mobile MetaTrader for signal _ALERT_SIGNAL: to enable alert signal _SHOW_EMA_TREND:

ACTUALMENTE 20% DE DESCONTO !
A melhor solução para qualquer novato ou comerciante especializado!
Este Indicador é especializado para mostrar a força da moeda para quaisquer símbolos como Pares Exóticos de Commodities, Índices ou Futuros. É o primeiro do seu género, qualquer símbolo pode ser adicionado à 9ª linha para mostrar a verdadeira força da moeda de Ouro, Prata, Petróleo, DAX, US30, MXN, TRY, CNH etc. Esta é uma ferramenta de negociação única, de alta qualidade e acessível, porque inco
O mercado MetaTrader é um espaço, sem precedentes, para negociar robôs e indicadores técnicos.
Leia o artigo Manual do usuário da MQL5.community para saber mais sobre os serviços exclusivos que oferecemos aos traders: cópia de sinais de negociação, aplicativos personalizados desenvolvidos por freelances, pagamentos automáticos através de sistema de pagamento e a rede em nuvem MQL5.
Você está perdendo oportunidades de negociação:
- Aplicativos de negociação gratuitos
- 8 000+ sinais para cópia
- Notícias econômicas para análise dos mercados financeiros
Registro
Login
Se você não tem uma conta, por favor registre-se
Para login e uso do site MQL5.com, você deve ativar o uso de cookies.
Ative esta opção no seu navegador, caso contrário você não poderá fazer login.