Conheça o Mercado MQL5 no YouTube, assista aos vídeos tutoriais
Como comprar um robô de negociação ou indicador?
Execute seu EA na
hospedagem virtual
hospedagem virtual
Teste indicadores/robôs de negociação antes de comprá-los
Quer ganhar dinheiro no Mercado?
Como apresentar um produto para o consumidor final?
Pagamento de Indicadores Técnicos para MetaTrader 4 - 89

Hi Trader, We are strategy development for Binary and Forex tools, our product have success for binary trading 1 min - 2 min experation. At the moment I build indicator for trading all day, not like Bonosu series with specific time. We launch A-Boss Stats Indicator for trading 1 minute to 5 minutes experation is mean can trade from 1 minutes - 5 minutes. Specification of A Boss Stats trading binary option: Work with all MT4 broker. Chart Time Frame M1 only, can use M5 Experation time for contact
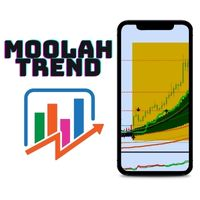
The Moolah Trend is a proven trading method that enables one trade the ranging market and the trend all on the right side of the market. The entire trading strategy is comprised of basically 5 mt4 plugins to support it. Send me a direct massage after purchase so I can forward you the bonus plugins and template file with a video for installation and how to trade the strategy.

The Cross Period Moving Average Support Resistant Map puts multiple latest updated MA value in the same window.
Useful for trend and breakout traders to identify support and resistance at a glance. Highlighted with multiple line width for each period. MA type : SMA MA price : candle close price MA periods: H1 , H4 , D1 , W1 , MN
**if you have any enquiry, contact me at : pipsstalker1507@gmail.com

Trend Lines contiuous Signal (FREE one WEEK) This indicator draws current trend line and provides Buy/Sell Signal based on calculations on Higher frame (Trend) and Lower frame(Entry signals)
* You should select the higher and lower frame for indicator calculations * You select the Trend line colors as you prefer * Enable or disable Alerts! Trend lines UP/Down are drawn when a trend is detected Wait for small arrows for entry : *Normally an UP arrow in an UP Trend is a BUY signal : ---you Clos
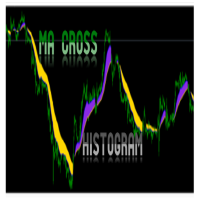
MA Histogram is MT4 Indicator for beginners which plot a histogram after Moving Average Crossover of 2 MAs. The Indicator does not have arrow or alert. It will simply plot on chart the potential Up and Down trend when trend is beginning or ending. It will show a Blue color for potential up trend and Gold color for potential down trend. Recommended pairs: All MT4 pairs including Indices You can change inputs to suit your Moving Average cross parameters and color for histogram.
Get for Forex MT5
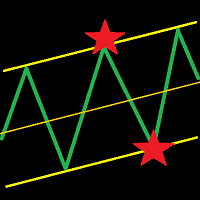
This indicator draws a trend line and a trend tunnel on the chart. You can choose several calculation methods, alerts, notifications, and other settings. It can also draw trendlines from another TimeFrame. You can also use this indicator for your ExpertAdvisor. The current values of the lines are stored in the memory buffer from where the EA can load them. You can trade the price bounce from the upper and lower lines . Settings TimeFrame – trend timeframe Description – show description of line

Este indicador usa uma combinação de médias móveis.
Desde o início, você será capaz de identificar um padrão de estratégia muito fácil, mas lucrativo (mesmo um trader iniciante não perderá isso).
Ele vem com parâmetros de entrada já definidos para o usuário. Apesar dos parâmetros já definidos, os usuários ainda podem alterar as CORES APENAS para atender às suas preferências ou ao seu gosto.
Parâmetros embutidos - para que você não precise mais se preocupar em alterar os parâmetros da média

Actualmente em férias com desconto de $399! Os preços podem aumentar no futuro. Ler descrição abaixo!
Apresentando os Últimos Níveis Dinâmicos - o Melhor Indicador de Entrada para o Painel de Atiradores Sniper Ultimate! Entradas extremamente baixas de risco e RR elevado!!
Encontre AQUI o Painel de Atiradores Ultimate Sniper. A capacidade mais importante tanto para comerciantes principiantes como profissionais é dizer exactamente onde e quando é mais provável que um mercado gire, e como entrar
Este indicador irá espelhar os ativos em uso em outro Metatrader, podendo escolher o timeframe e um template.
Este é o Metatrader 4 Server, e pode funcionar com as versões Cliente do Metatrader 4 ou 5: Metatrader 4 Mirror Chart Client: https://www.mql5.com/en/market/product/88649
Metatrader 5 Mirror Chart Client: https://www.mql5.com/en/market/product/88650 Detalhes de como funciona no vídeo.
Indicador de scalping para qualquer par de moedas e qualquer período de tempo. O indicador mostra com setas os prováveis pontos de reversão de preços com base nas leis de regularidade do mercado. O indicador não redesenha seus sinais. Quando uma seta aparece, o indicador pode enviar um sinal para o trader em um telefone celular, bem como por e-mail. O indicador é muito fácil de configurar. Possui apenas um parâmetro para configuração dos sinais "Período". Ao alterar este parâmetro, você alter
this indicator functions to read buffers from other custom indicators, and combine 2 signals from each indicator Instructions 1. you have to know the buffer up or down of the indicator you want to use 2. if the indicator is in the same folder, you just need to enter the name of the indicator in the indicator name column if the custom indicator is in a separate folder, you can type it in the format folder1/folder2/name indicator

Características do Trading Master Control System
O TMCS é uma ferramenta para mostrar a você de uma só vez o status de um ativo. O TMCS mostra todos os prazos, mostra a tendência, o poder de negociação e calcula com base nos alertas de poder de negociação para sinais de negociação. O indicador calcula quebras de bandas de bollinger. Além disso, e muito IMPORTANTE, ele mostra a você, quando um período de tempo é plano, significa que não há poder de negociação real. Veja mais nas capturas de tel

This indicator helps to identify market sessions, It's High/Low, Open Range (OR), range of the sessions in pips and percentage of previous day (change%) under OHLC.
It is also editable for any brokerage market watch time. For traders who use session trading strategies such as Mark B. Fisher ACD it can be super effective, where they can edit OR from the settings to either line or box. We tried to make the settings easier to edit, for traders' use on different markets, charts and brokerage time.
DESCRIPTION:
Account Information Panel v1.1 is a MT4 (MetaTrader 4) indicator, and it is an excellent tool to track and analyze your investments monthly under an investor's view to help investors/traders understand their investment/trading quickly without spending hours to do manual calculation. FEATURES:
Display a basic information Balance Equity Margin Free margin Margin level Leverage Swap (long/short) Spead Current DD (drawdown) Active positions (long/short, lot, profit/loss) Display week
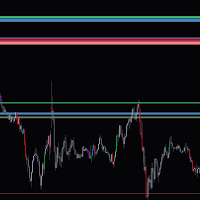
This indicator shows zones based on daily candles in the chart , Make sure you have enough daily bars in the chart before loading the indicator to the chart, These zones can act as both supply and demand zones. The zones are not subjected to repaint. If you have less zones or no zones for current prizes under the default inputs, try increasing the past days input and the zone sizes values gradually. If you have more zones than you need in chart try decreasing the past days and the zone size val
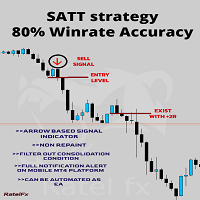
SAT strategy (Systematic Approach Trading Technique)
This is a revolutionary new way of trading the financial market.
This is the top indicator system that provides the most accurate trading signals for both entries and exits.
This system indicator algorithm provides the most accurate and precise signal only during the highly impulsive phase of the market.
This system indicator performs well during a high volume period, which is only the first three hours of a specific session, whether in L

O Histograma Qv² - Indicador desenvolvido para traders com experiencia avançada. Este indicador tem duas finalidades: 1-) Identificar padrões de normalidade do preço (Cor verde) 2-) Identificar padrões de anormalidade do preço “outliers” (Cor vermelha) ====================================================================== Interpretação para operações em início de tendência: Histograma (Cor verde) cruzando a linha zero para cima tendência de alta. Histograma (Cor verde) cruzando a linha zero para

Современный индикатор паттернов PPR по торговой стратегии RAIT. Работает по тренду и без него. Имеет настройки таймфрейма для отображения. Можно настроить количество баров для отображения индикатора на графике. Используется несколько паттернов PPR. Индикатор предпочтительно использовать на часовом таймфрейме и выше, но работает и ниже . Паттерны: PPR, PinPPR, OutPPR. Отображаются одной стрелкой.

A supply and demand indicator designed with a minimalist trading strategy based on the nature of the market. The Bull zone is a strong support area, and the Bear zone is a strong resistance area. When a Bull zone was breakout, it becomes the "base" of the Bears and vice versa. When the price meets these areas, there is a high probability that the price will turn around, so we call them Obstacles. It is a suitable indicator for traders interested in manual price action and algorithmic trading up

Buy and Sell Targets Indicator You can see the buying and selling goals in the box and they are inevitably achieved. It consists of three lines: the first green color sets buying targets, the second red color sets selling targets, and the third blue color is the average price. Trading Method For Buy Trade: The entry point will be where the wavy blue line (representing the average price) is 'broken' by the ascending 'Buy' candle from beneath Please wait until the next candle appears to enter int

Average Price Bars (APB) are modified Heikin-Ashi type candlesticks. Heikin-Ashi is a Japanese term translated as 'Average Bar'; therefore, the name, Average Price Bars. Average Price Bars provide a better depiction of current market by eliminating or reducing fluctuations in nominal price action often referred to as “choppiness” of current High, Low, and Close price action.

Hi! Between the given time range. Adds profit and lot. This can be written on the charter in English and Hungarian. The name of the symbol must be entered exactly. Good used for it. :)
Szia! A meg adott idősáv között Összeadja a profitot és lot-ot. Ezt ki írathatjuk Angolul és Magyarul a chartra. Pontosan kell beírni a szimbólum nevét. Jó használatott hozzá. :)
Best Solution for any Newbie or Expert Trader!
Forex Support Resistance is a unique, high quality and affordable trading tool because we have incorporated a number of proprietary features. it calculate highest high and lowest low of Previous X bars with possibility to select timeframe as desired . also it display the values of highest high and lowest low of Previous bar as a comment at the main chart . Imagine how your trading will improve because you are able to pinpoint the exact trigger poi

ZigZagSpeed indicator measures the rate of formation of zig and zag over time calculated by the known zig zag indicator. The calculation system is simply calculated by dividing the difference in pips by the number of bars elapsed in the selected time frame. The speed measurements that occurred in the past period will also be displayed on the graph together with the date of occurrence. Velocity numbers are located above or below each zig and zag formation in white. The number shown in yellow rep
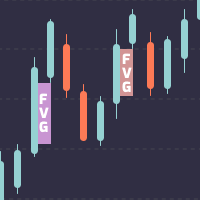
Indicador de diferença de valor justo para MetaTrader 4.
Uma lacuna de valor justo é um padrão de ação de preço de três velas ensinado pelo famoso comerciante de dinheiro inteligente, o comerciante do círculo interno, também conhecido como ICT. Basicamente, é uma lacuna deixada em aberto no gráfico quando o preço se move muito rápido. É uma área do corpo da vela do meio que não fica sobreposta pela vela esquerda e pela vela direita próxima a ela. Quando o preço deixa uma lacuna no gráfico, pod

Scalping indicator 2 in 1. Buying this indicator, you get an automatic robot as a gift! Automatic system for searching for price reversal points. The indicator with dots on the chart of a currency pair shows the likely reversal points of the price movement. A red dot indicates a reversal of the movement down, and a blue dot indicates a reversal in the price movement up. The indicator is great for intraday trading using a scalping strategy. Ideally combined with channel indicators. When the chan

Easy to use indicator that will help you place your pending and market orders with great accuracy. The indicator plots the order blocks based on how price reacts to current market structure. These key levels represent supply and demand zones and the Smart Blocks Trading System indicator uses price to assess whether an asset is being accumulated or distributed. It can be used on any financial instrument, and on any given time frame.
BoS stands for Break of (market) Structure. The blue and red d
This indicator is intended to help traders to see today's daily range compared to the average daily range. You can change the number of days for the average daily range otherwise you can use 20 as the default. The % Reach will give info about the progress today's range toward the average daily range. Breakout traders, or pullback traders normally will look at base area, in which they might want to know the average daily range as comparison.
The indicator has color code green and red, where the

This indicator is developed based on the multiple session trading to aid in analysis for all the day traders. The indicator supports all currency pairs as well as other trading instruments like indicies, commodities, metals ,etc. The way the indicator work is by making analysis on your behalf. During asian session that's when the indicator does the calculations and provided trading plans in form of areas on the chart for the current day. And this process happens everyday which allows for hands f

This indicator easily calculates the reward to risk ratio and indicates the stop out level and take profit limit with graphical boxes. Also shows the reward steps with fibonacci levels without changing the fibonacci default levels, this is a lot useful for people who use fibonacci retracement. Very user friendly interface and easily to use with graphical buttons.
A simple and precise Indicator to identify potential supply and demand zones for price reversals. It was first described in Jason Pearl's Book, " Demark Indicators", published in 2008. It can be used both as Support and Resistance, and can be traded as a Breakout or as a Fakeout, depending on your trading style, and depending on how the candle was closed in proximity to TDST.

Analisar vários intervalos de tempo de um par de moedas em uma janela pode deixá-lo confuso.
Para analisar vários intervalos de tempo, você precisa de indicadores confiáveis.
Um deles está usando a curva 9TF MACD.
Tenho trabalhado dia e noite para criar um código simples, mas confiável, que cubra todos os nove intervalos de tempo em apenas um indicador.
Vejamos algumas das vantagens deste indicador:
Histograma colorido. A cor da curva em cada timeframe é diferente uma da outra. Setas indic
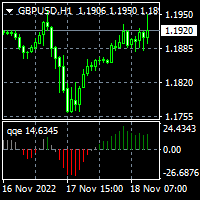
To download MT5 version please click here . - This is the exact conversion from TradingView: "QQE mod" By "Mihkel00". - It can be used to detect trend direction and trend strength. - Gray bars represent weak trends. You can set thresholds to achieve better accuracy in detecting trend strength. - There is buffer index 15,16,17 to use in EA for optimization purposes. - The indicator is loaded light and non-repaint. - You can message in private chat for further changes you need.

A Gap often occurs when the price moves with "strength" in a given direction (either up or down). This Gap is formed when, in looking at 3 consecutive candles, the wicks of the 1st and 3rd candles do not overlap. When this happens, the indicator creates a rectangle where the Gap is located. It identifies a zone where the price could potentially go back to (mitigation). The Gap/rectangle is mitigated when the price returns and completely covers the rectangle. Note that the indicator also show

To download MT5 version please click here . This is the exact conversion from TradingView: "WaveTrend [LazyBear]" By "zeusuk3". One of the coolest indicators out there to detect overbought and oversold zones. It can be used as a part of more complicated strategy and for confirming a potential trade setup. There are buffers to use in EAs also. The indicator is loaded light and non-repaint. - You can message in private chat for further changes you need. Thanks for downloading

Emini Signal Bar
Price - Promotion: $100 - Normal Price: $200
Symbol Recommended - S&P 500 Index / US500
Timeframe - 5 minutes Buffer Information - Buy Trade Buffer = 2 - Sell Trade Buffer = 3 Main features - Show Buy Signal Bar and Sell Signal Bar on Live Chart. - Get Alert from signal bar. - The precision of the Alert is superior to dots. (Alert is active at that time) - Dots will be recalculated after reset the properties. After the Alert is displayed, kindly make your decisions to trade.
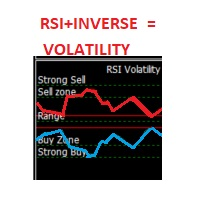
This indicator is an oscillator that shows the RSI (Relative Strength Index) in red and its inverse graph in a light green. Together this shows the volatility of the market (in its default setting). You can also change it to show only the RSI graph. It also gives you the possibility to change its Period. The oscillators zones (80,70,50,30,20) are marked by Strong Sell, Sell Zone, Range, Buy Zone, and Strong Buy respectively.
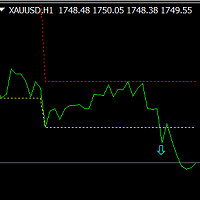
This is an MT4 indicator based on fluctuation statistics, which mainly includes two parts: one is display the fluctuation area, and the other is to display the signal at the same time if there is a signal generated.
Its main principle is to conduct data statistics based on the specified extreme value fluctuation radius, and draw the fluctuation area. If the breakthrough area is displayed, the signal in the same direction will be displayed. Advantage:
Suitable for all breeds. Applies to all cy

Thanks to this indicator, you will be able to analyze the trading of all your advisors from one account. You don't have to have a separate terminal for each Expert Advisor to evaluate its work specifically.
The indicator is able to analyze the account history by magic numbers and you will be able to see which setting with the magic number assigned to it gave what results. moreover, you will be able to analyze transactions on Buy and Sell separately, this is an underestimated moment for many tr

KFX Dashboard monitors Price Action using Candle Direction + Moving Average on Multiple currency pairs (selectable by you) and on Multiple Timeframes (selectable by you). The dashboard also reveals Currency Strength of pairs based on your Moving Average selection.
FEATURES
- Price Action: Candle Direction + Moving Averages(3x shown on chart). - Multiple Symbols and Multiple Timeframes. - Currency Strength Analysis. - Monitors Open Trades: Currency Amount + Pips. - Symbol button(click) change
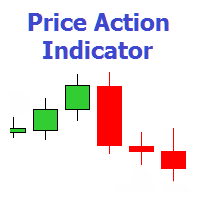
The indicator shows 7 patterns of the Price Action trading system, as well as the maximum and minimum price lines for the day. Timeframe: H1, H4, D1. Pin bar Outside Vertical Bar (OVB) Pivot Point Reversal (PPR) Closing Price Reversal (CPR) Double Extremums ( DMax/DMin ) Wide Range Bar (WRB) Inside Bar (IB) Settings PRICE ACTION PATTERNS Show Pin Bar Color Pin Bar - pointer arrow color. Show Outside Vertical Bar (OVB) Color Outside Vertical Bar - poin

O Volume Champion é um indicador que analisa o volume do mercado e exibe os dados na forma de um histograma. Você não precisa se aprofundar na teoria da análise de mercado. Você pode simplesmente seguir as leituras do indicador. As barras indicadoras mostram a direção potencial do movimento dos preços com base na análise da estrutura do volume do mercado. Este indicador foi projetado para ser usado em intervalos de tempo mais altos, como H4, D1, W1. SINAIS NÃO RESPONDEM! Tecnicamente, o indicado

Trend TD is a trend indicator. Thanks to the algorithm of this indicator, the signal will never go against the trend. Thanks to the two lines forming a narrow channel, the algorithm for analyzing entry points, the algorithm controls the reversal moments at the moment when the upper line of the channel has reversed and it is possible to visually draw a line crossing the upper line with itself in the past, while crossing the lower line at one point. If this rule is fixed, then the signal will

The indicator is built on a non-standard Zig Zag, it draws accumulations after which if the price leaves this zone and a test of this zone occurs, then a sound signal is given and an arrow appears - after the test candle closes.The indicator does not redraw its signals, it is very easy to use, there are only three settings 1- this is the zig zag parameter 2- this is the minimum price exit from the zone 3- this is the maximum price exit from the zone. The lower the parameter for Zig Zag, the more
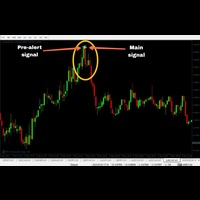
'Zoro PRO' is a reversal strategy based MT4 indicator with advance pre-alert system. Its an 100% non repaint indicator with an average accuracy of about 70-95% in any kind of market. (EXCEPT BAD MARKET AND NEWS TIME)
MT5 version: https://www.mql5.com/en/market/product/90934 (MT5 version not recommended)
Recommended Broker: Alpari, Amarkets, tickmill. Recommended pairs for M1:
EURUSD
AUDJPY
GBPUSD
EURJPY
NZDJPY
CADJPY
EURGBP
USDCAD
GBPCHF
GBPCAD
EURNZD
AUDNZD
-------------------------
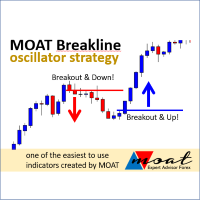
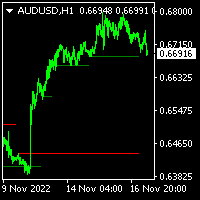
The indicator will provide a breakout line or price stop guide, we recommend M5 or H1 timeframes. Trade signal: Buy Signal: if the closed price (according to the timeframe) breaks the blue line and is already above it or if the lowest price stops above the red line. Sell Signal : if the closing price (according to the timeframe) breaks the red line and is already below it or if the highest price stops below the blue line. Feature: You will get time (hours) and price values for the lines
Nepsetms45 is a forex scalping indicator that shows the trader the price reversal points and the current trend direction. The accuracy of indicator signals is on average 87%. This suggests that if the indicator draws an arrow on the chart, then with a probability of 87%, the price will go in the direction of the arrow by at least 20 points or more in the near future. The indicator also shows the direction of the trend and the strength of the movement using lines on the chart.
Nepsetms45 is a r
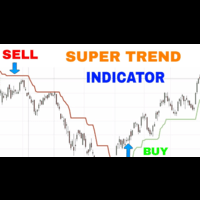
The SuperTrend Non Repaint Indicator is particularly stable and has a few advantages.
1.Magnified Market Price added for instant check of current market price
2.It uses a moving (statistical) median of the arithmetic mean (High + Low)/2 of the bars instead of a moving average. The (statistical) median is known to be more robust than any average.
3.It calculates both the Median and the ATR (average true range) 1 bar ago, whereas the original SuperTrend indicator takes the ATR and moving average

Gartley Hunter Multi - An indicator for searching for harmonic patterns simultaneously on dozens of trading instruments and on all classic timeframes: (m1, m5, m15, m30, H1, H4, D1, Wk, Mn). Manual (Be sure to read before purchasing) | Version for MT5 Advantages 1. Patterns: Gartley, Butterfly, Shark, Crab. Bat, Alternate Bat, Deep Crab, Cypher
2. Simultaneous search for patterns on dozens of trading instruments and on all classic timeframes
3. Search for patterns of all possible sizes. From t

This indicator contains Pivot Levels of: Traditional Fibonacci Woodie Classic Demark Camarilla Calculation periods can be set to auto / Daily / Weekly / Monthly / Yearly. Number of Levels are editable. Options to hide level labels and price labels. Pivots Points are price levels chartists can use to determine intraday support and resistance levels. Pivot Points use the previous days Open, High, and Low to calculate a Pivot Point for the current day. Using this Pivot Point as the base, three resi

Looking for an indicator that identifies high-probability price action patterns? Love counter-trend trading? The Kangaroo Tailz indicator might be just for you. This indicator is meant to be used as a reversal detector. I personally would rather enter a position at the beginning of a trend rather than catch the last couple of moves. This indicator does a good job of alerting when price may reverse by identifying price action patterns that occur frequently in markets. Even though this indicator i

Analisar vários intervalos de tempo de um par de moedas em uma janela pode deixá-lo confuso.
Para analisar vários intervalos de tempo, você precisa de indicadores confiáveis.
Um deles está usando 9TF STOCH RSI.
Tenho trabalhado dia e noite para criar um código simples, mas confiável, que cubra todos os nove intervalos de tempo em apenas um indicador.
Vejamos algumas das vantagens deste indicador:
Histograma colorido. A cor da curva em cada timeframe é diferente uma da outra. Setas indicand

Pivot Point Indicator (Poivt)
ClassicMode indicator calculation formula (ClassicMode):
pp=(High+Low+Close)/3.0
s1=2*pp-High
s2=pp-(High-Low)
s3=Low-2*(High-pp)
r1=2*pp-Low
r2=pp+(High-Low)
r3=High+2*(pp-Low)
Woodie Mode indicator calculation formula (WoodieMode):
pp=(High+Low+2*Close)/4.0
s1=2*pp-High
s2=pp-(High-Low)
s3=Low-2*(High-pp)
r1=2*pp-Low
r2=pp+(High-Low)
r3=High+2*(pp-Low)
Fibo
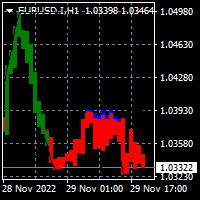
To download the MT5 version of Donchian Trend Ribbon please click here . You may also check this link . This is a conversion from TradingView: "Donchian Trend Ribbon" By "LonesomeTheBlue". This is a light-load processing and non-repaint indicator. Buffers are available for processing in EAs. You can message in private chat for further changes you need. Thanks for downloading
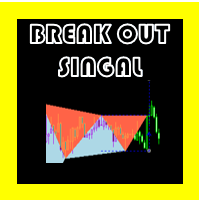
SINAL DE QUEBRA OSW
(METATRADER 4)
Você quer trabalhar quebrando altos e baixos? este é o indicador perfeito para obter sinais desses tipos de entradas.
Assim que o indicador iniciar, ele não mostrará nenhum sinal, mas à medida que o preço avança, ele lerá o mercado até encontrar o padrão perfeito para romper.
O indicador para ler os altos e baixos tem uma configuração especial para o Zig Zag, que permite tirar apenas os mais adequados.
Como qualquer indicador, não dá entradas perfeitas, m
O indicador Three MA Buy and Sell Signals PRO para Metatrader 4 é o sistema de negociação da 3 MA que fornece sinais de compra e venda sempre que a tendência muda na direção oposta.
Este indicador do sistema consiste em 3 médias móveis usando 3 períodos diferentes.
O indicador fornece os sinais reais de compra e venda na forma de setas.
Depois de baixar e instalar o indicador na plataforma de negociação MT4, ele deve se parecer com a imagem mostrada abaixo.
Pontos chave Indicador de sinais

O indicador 3rd Candle Forex Scalper para MT4 é um verdadeiro indicador de escalpelamento que funciona muito bem para qualquer período de tempo e par.
Pontos chave: Uma seta azul representa uma oportunidade de negociação de compra. Uma seta vermelha representa uma oportunidade comercial de venda. O indicador é muito confiável, leve e não desacelera sua plataforma de negociação.
Como negociar com ele? Abra uma posição de compra sempre que a seta azul do cambista aparecer no gráfico.
Abra uma

To download MT5 version please click here . This is the exact conversion from TradingView: "B-Xtrender" By "QuantTherapy". - It is an oscillator based on RSI and multiple layers of moving averages. - It is a two in one indicator to calculate overbought and oversold zones for different RSI settings. - This indicator lets you read the buffers for all data on the window. - This is a non-repaint and light processing load indicator. - You can message in private chat for further changes you need.

* All Symbols x All Timeframes scan just by pressing scanner button ** *** Contact me to send you instructions and add you in "Candle Scanner group" for sharing or seeing experiences with other users. Introduction: Candles tell their story. When looking at a candle, it’s best viewed as a contest between buyers and sellers. Candlestick patterns are used to predict the future direction of price movement. Candlesticks are an easy way to understand the price action. You can use candlesticks to decid

O indicador Obie Scalper para Metatrader 4 é um indicador de escalpelamento Forex fácil de usar que oferece lucros rápidos nos prazos mais baixos.
O indicador analisa o gráfico em busca de oportunidades rápidas de escalpelamento que possam surgir durante as várias sessões de negociação.
Os melhores resultados foram obtidos durante os pregões mais voláteis (Londres e Americanos).
Naturalmente, o indicador Obie Scalper funciona em qualquer período de tempo e par de moedas de sua preferência.

DepthTrendView is an indicator that is used to see the direction of the market very clearly compared to the indicators that are commonly used by many people.
What is interesting about this indicator is that you can see the direction of the trend and also know that the market is at the end or that the market wants to start a new trend.
How to Use: 1- To see the earliest BUY direction you need to see previous candle below Aqua Line before green arrow appear.
2- To see the earliest SELL directi

O indicador Rapid 5M Scalper with Alerts para MT4 é uma excelente ferramenta de sinais rápidos de compra/venda para scalpers e day traders.
Os sinais são muito fáceis de entender e aparecem na janela principal do gráfico como pontos azuis e vermelhos.
Sinal de compra e venda: Uma seta azul é um sinal de compra. Uma seta vermelha é um sinal de venda. Sinta-se à vontade para experimentar as diferentes configurações e valores de entrada do indicador.
O indicador funciona igualmente bem em todos

MA Revolution is upgraded version of standard Moving A verage. With the current upgrade moving average line got more sensitive with different market conditions. It gets more flexible by decreasing default period step by step while market is sharp and incrasing period back to default period step by step while market is normal again. testing of the ide a shows th at this upgr aded version gives much more acur acy for detecting m arket direction, ch anges in direction are shown much e arly th an
Place the indicator on the chart, preferably with a timeframe of H1 or H4. If you are trading in the daily range or, conversely, on lower timeframes, you will need to adjust the RSI and ATR levels accordingly.
The blue arrows of the indicator will be a signal to open a long position, the red arrows will be a signal to open a short position:
1) Blue arrow for longs (growth) and red arrow for shorts (decline).
2) Two horizontal lines for current positions (one for entry and one for stop).
3

This indicator is very useful for those who trade with investor techniques. That's why I named it InvestorTool. Why investors? Isn't this a tool for trading? This indicator is basically to help investors to identify which pairs are very close to their All-Time-Low or All-Time-High. So that the investor will quickly spot which instruments are "relatively" at its low cost, and telling the minimum equity required.
If the pair is close to All-Time-Low then investor can put a buy position. When t

NOTE: PRICE WILL RISE VERY SOON. DON'T SKIP THIS OFFER! Dear traders I am glad to introduce the " Market Swing Scanner Board" indicator to you. This indicator was made mainly to be used in combination with the Market Swing Index Indicator. You use the "Market Swing Scanner Board" indicator to scan for trading opportunities on the Market Swing Index Indicator . This tool is designed for serious traders who have decided to make a difference through trading. Be the next person to witness this st

O indicador Market Structure MTF é uma tentativa bem-sucedida de formalizar a estrutura do movimento de preços de acordo com um algoritmo único. Ele organiza com precisão qualquer movimento de preço nos elementos constituintes e permite que você não perca nenhum ponto interessante de entrada ou saída. Uma característica importante do indicador Market Structure MTF é a visualização da estrutura do movimento do preço em dois períodos de tempo ao mesmo tempo – no atual e em qualquer período mais a

Analyzing multiple time frames of a currency pair in one window can make you confused. To analyze multiple time frames, you need reliable indicators. One of them is using 9TF RSI MA . I've been working day and night to create code that is simple but reliable and covers all nine time frames in just one indicator . Let's look at some of the advantages of this indicator: Colorful histogram . The color of the curve in each timeframe is different from one another. Arrows indicating the crossing of

KT Trend Exhaustion is our personal implementation of the famous Trend Exhaustion Index developed by Clifford L. Creel, Ph.D., in 1991.
The change in price direction often comes with uncertainty. TEI helps to tackle the uncertainty by showing a crisp direction using the smoothed color-changing index.
Features
Easy to use and interpret. It comes with a multi-timeframe scanner that scans the upcoming signals across all the time-frames. It can be used as an entry signal or trend confirmation. Al

KT Know Sure thing is a momentum oscillator based on the smoothed rate of change over four different timescales and was developed by Martin Pring. In 1992, Pring published the initial description of the indicator in Stocks & Commodities magazine's "Summed Rate of Change (KST)" article. KST creates a momentum oscillator by combining the price momentum measurements from four different price cycles. Traders can utilize KST to search for bullish or bearish divergences, signal line crossovers, and ce
O mercado MetaTrader é um espaço, sem precedentes, para negociar robôs e indicadores técnicos.
Leia o artigo Manual do usuário da MQL5.community para saber mais sobre os serviços exclusivos que oferecemos aos traders: cópia de sinais de negociação, aplicativos personalizados desenvolvidos por freelances, pagamentos automáticos através de sistema de pagamento e a rede em nuvem MQL5.
Você está perdendo oportunidades de negociação:
- Aplicativos de negociação gratuitos
- 8 000+ sinais para cópia
- Notícias econômicas para análise dos mercados financeiros
Registro
Login
Se você não tem uma conta, por favor registre-se
Para login e uso do site MQL5.com, você deve ativar o uso de cookies.
Ative esta opção no seu navegador, caso contrário você não poderá fazer login.