Conheça o Mercado MQL5 no YouTube, assista aos vídeos tutoriais
Como comprar um robô de negociação ou indicador?
Execute seu EA na
hospedagem virtual
hospedagem virtual
Teste indicadores/robôs de negociação antes de comprá-los
Quer ganhar dinheiro no Mercado?
Como apresentar um produto para o consumidor final?
Pagamento de Indicadores Técnicos para MetaTrader 4 - 58

The Trend ADW indicator can be used both for piping for small periods and for long-term trading. When using, it is recommended to look at an additional indicator for a filter of possible false signals.
The indicator shows the direction of the trend, signaling this using pivot points. It can be used with an optimal risk ratio. The arrows indicate favorable moments and directions for entering the market. Uses one parameter to adjust (adjust from 1 to 3). It works on all currency pairs and on all
A ferramenta definitiva que todo trader de spread estava esperando. Este poderoso indicador para MetaTrader permite que você insira qualquer par de instrumentos de sua escolha, oferecendo uma flexibilidade sem precedentes em suas estratégias de trading. Nenhum dos dois instrumentos precisa ser necessariamente o símbolo no qual o indicador está posicionado, permitindo que você tenha controle total sobre sua análise. O que torna o Zero Based Spread Oscillator único? Oscilação Real em Torno de Zer
Wouldn’t you love a heads up alert when the market is switching from bullish to bearish momentum? When the background turns green, there is your signal to place a long trade to increase your profitability. Also, when the background turns red, guess what? It’s time to go short for profits. HOW TO USE 1. When the background turns green, this is the best place to take long trades. This also represents a bull market. 2. When the background turns red, this is the best place to take short trades. This

Fact shows favorable moments for entering the market. The indicator can work both for entry points, and as the filter. Uses two settings.
This is a hybrid trend indicator, as it is based on the signals of elementary indicators and a special algorithm for analysis. The intelligent indicator algorithm accurately detects the trend, filters market noise and generates input signals.
The indicator uses a color alarm: blue - when changing from descending to ascending, and red - on the contrary, to d

You’re going to love this! We have coded in the ability for you to be alerted by email or SMS when the Green Buy Line crosses below the Red Stop-loss line signaling a sell. And to take it one step further to increase your profits, we coded in the ability for you to be notified with the Price crosses down below the Green Buy Line or below the Red Stop-loss Line to give you earlier exit opportunities. HOW TO USE 1. Buy when the green buy line crosses above the blue trend line. You can also buy whe

This algorithm is created for you to receive alerts as to when the green stochastic line has crossed above the red stochastic line to launch a long trade and vice-a-versa for short trades. This indicator is a work horse for your profit picture! HOW TO USE 1. When the green stochastic line has crossed above the red stochastic line with a green background, this is an ideal place for a long entry. 2. When the green stochastic line has crossed below the red stochastic line with a red background, thi
Торгуя на рынке форекс, многие используют уровни поддержки сопротивления убеждая себя что, если цена закрепится выше-ниже уровня, рынок пойдет далее по направлению-данное убеждение работает только в том случае, если учитывается направление движения рынка с более старшего временного интервала! Исходя из выше сказанного был написан индикатор уровней который рассчитывается по математической формуле Индикатор уникален тем, что он помимо основных уровней, учитывает и уровень с более старшего временно
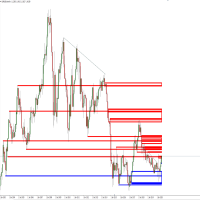
This product makes your trend lines perfectly horizontal and brings them to present automatically. SPEND YOUR TIME TRADING AND NOT FORMATTING TREND LINES! Makes for the cleanest of charts! This product is ideal for S/D, S/R, and other technical analysis styles! The most important part is that you won't know how you ever traded with out it! First month is free!

Smart Gread Ultimate Edition (SGUL) indicator - based on smart order grid strategy.
Maximum customization and flexibility of strategies are the main features of this indicator.
In the right corner there is a table with the number and volume of orders.
List of adjustable parameters:
K: 2.0 - Factor of the next order increase (if the price moves in the other direction).
TP: 50 - The number of points at which the order is closed with a profit (minimum profit per 1 lot).
Step: 80 - The numb
Este indicador de vários símbolos foi projetado para identificar automaticamente quando o preço atinge os principais níveis psicológicos. Também conhecido como números redondos, números inteiros ou níveis-chave. Como um bônus, ele também pode verificar o nível do ponto de pivô em um período de tempo selecionado. Combinado com suas próprias regras e técnicas, este indicador permitirá que você crie (ou aprimore) seu próprio sistema poderoso. Recursos Pode gravar os sinais em um arquivo que pode se

This tool was developed and designed for binary options trading It has been noticed that it can also be used in stock markets and forex. There are 2 options for trading binary options using this indicator Option 1 We open a deal on the next candle after a signal for one cut of the current period Buy or Sell depending on the signal The blue up arrow is Buy The red down arrow is Sell / We enter only on the first signal on the next candle and ignore the rest / Option 2 We enter on a signal for the
Ultimate pattern builder Scanner (multi time frame and currency pair)
Allows you to build any pattern with up to 3 candlesticks. This Scanner is basically indicator with scanning feature, you can now create your own candlestick patterns and scan them in real time at any time frame and currency pair (stocks, energies, crypto...). Now you can use full potential of indicator in real time trading. If you dont know yet what is so special about this ultimate pattern builder software collection: it a

Hello This Indicator will draw Green (Up) and Red (Down) small arrows from Multi TimeFrames based in ( Moving Average) to help you to take decision to buy or sell or waiting If there 4 green arrows in same vertical line that's mean (Up) and If there 4 Red arrows in same vertical line that's mean (Down) and the options contain (Alert and Mobile , Mail Notifications). Please watch our video for more details https://youtu.be/MVzDbFYPw1M and these is EA for it https://www.mql5.com/en/market/produc

Oscillatory price direction indicator for Forex. It has 2 operating modes - trend and scalping. The trend mode of operation allows you to determine the direction of the market movement in the medium term.
The scalping mode works by determining the price movement in the short term. Consists of a blue line, from which the balance between the directions of the price and signal green / red line.
The green line shows the direction of the price up, and the red line shows the direction of the price dow
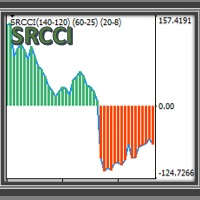
SRCCI An indicator based on RCCI , is a combination of the RSI and CCI indicators, adapted into three levels categorized into A, B and C. Taking advantage of their combination to maintain a controlled filter and applicable to different strategies. The RSI (Relative Strength Index) is one of the most popular and used oscillators to operate in the markets. It is a valuable tool to measure both the speed of price changes and the possible levels of overbought or overbought. The CCI (Commodity Channe
特徴: MTF Moving Averageを8本一気に表示してくれるインジケータになります。 8本も必要ない場合にももちろん非表示にできます。
どの通貨でも使用可能になります。 それぞれのMTF Moving Averageの色や太さを変更できます。 各パラメータの説明: Method:MAの種類設定をします。 Applied price:MAで使用する価格を設定をします。 TimeFrame M5:使用するMAの時間足を設定します。 Period M5:使用するMAの期間を設定します。 ※ラベルに関係なく8本のMTF MAはどの時間足でも期間設定可能になります。
Update Frequency(seconds):MTF Moving Averageの再作成更新頻度を入力します。

Zig-Zag indicator with additional signals for inputs.
Visually easy to use:
The red zig-zag line is an uptrend. The blue zig-zag line is a downward trend. Arrows in the form of additional signals.
Works on any trading pairs. On any timeframe.
Not redrawn.
Input parameters
Zig-Zag Period - Zig-zag period (from 5) Signal Period - period of signal arrows (from 3) Alerts for signals
Play sound - Sound alert Display pop-up message - Notification by message on the screen Send push notification
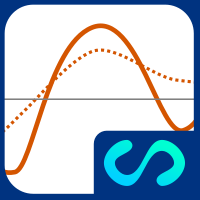
Representação do valor da inclinação da regressão linear. Possui um gráfico de referência para determinar visualmente as alterações no valor da inclinação (aceleração / desaceleração do preço).
PARÂMETROS
• Períodos: número de períodos para calcular a regressão linear
• PeriodsReference: número de períodos para o cálculo da média móvel nos valores do gráfico principal
• Displacement: deslocamento no eixo horizontal
• AppliedPrice: preço em que os cálculos são feitos
• MainP

Representação do valor de interceptação da regressão linear e o desvio médio absoluto simétrico ao valor de interceptação.
PARÂMETROS
• Periods: número de períodos para calcular a regressão linear
• Amplitude: multiplicador do desvio médio absoluto para definir as bandas
• Displacement: deslocamento no eixo horizontal
• AppliedPrice: preço em que os cálculos são feitos
• MainPlot: exibição do gráfico principal
• UpperPlot: exibição da banda superior
• LowerPlot: exi

Hello This Indicator will draw Green (Up) and Red (Down) small arrows from Multi TimeFrames based in ( MACD ) to help you to take decision to buy or sell or waiting If there 4 green arrows in same vertical line that's mean (Up) and If there 4 Red arrows in same vertical line that's mean (Down) and the options contain (Alert , Mobile and Mail Notifications). Please watch our video for more details https://youtu.be/MVzDbFYPw1M and these is EA for it https://www.mql5.com/en/market/product/53352
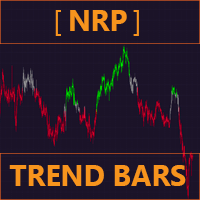
NRP Trend Bars
Your all-in-one Trend direction indicator, with Presets and Customisable options ! Get the most of Trends with NRP (No-repaint indicator) Trend Bars , designed to get the best of Trend Entries , Continuations and Reversals
One of it's function is the detection of the new trend starting , consolidation and possible trend change . It gives you the opportunity either to get in-&-out of the market in time
PRESETS (Sensibility)
LOW : Used for trend entries and confirming

Currency Strength Meters are a great way to identify strong and weak currencies. With this CSM indicator attached to your chart, you will get a clear overlook over the 8 major currencies: USD, EUR, JPY, CAD, CHF, GBP, AUD, and NZD.
Suggested timeframes to scan is: M15 - H1 - H4 - Daily You can however just change timeframe to check in the settings. Bear in mind that scanning very low timeframes such as M1 will require a lot of resources and might make your mt4 terminal slow.
The strength sca

Winner Overbought Oversold
Winner Overbought Oversold indicators are best suited for overbought/oversold analysis. Basically, there are two types of momentum oscillators: bound and unbound. Bound oscillators, such as this, fluctuate within a specific range. The most popular indicators used to identify overbought and oversold conditions are the relative strength index (RSI) and the stochastic oscillator . But you need a second conformation for entry and exit position from forex market. T
This is a brand new trend scanner for all of us that love to use different kinds of moving averages to define a trending market. This scanner is very useful and saves you a lot of time when you want to look for trending markets. In the scanner, you can choose to either use two different moving averages or three when defining a trend. Some like to use f. ex. the 50 EMA and the 200 EMA. If 50 is below 200 they will consider it a downtrend. Others like to use three moving averages. This can be e.
TrendRange Indicator works on M1, M5, M15, M30, H1 and H4 timeframes. It indicates real market trend, support and resistance levels. In other words, it confirms trade directions. Scalpers especially, Intraday, swing, intermediate and long term traders will especially find this indicator useful. It uses customized show/hide buttons namely: "DRAW", "HILO", and "LEVEL" lines crossings and histograms ("AWOS" for Awesome Oscillator, "BUBE" for Bull Power and Bear Power & "GATO" for Gator Oscilla
MA cross AKT (Traders Club)
機能: MAゴールデンクロスで買いサイン、デットクロスで売りサインを表示します。 MAの期間は入力できます。 MAの種類を選択できます。(SMA、EMA、SMMA、LWMA) 適用する価格を選べます。(CLOSE,OPEN,LOW,HIGH,MEDIAN,TYPICAL,WEIGHTED) サインをアラートで通知します。 サイン発生をE-mailやSNSで通知します。 MAクロスの勝率を表示します。 ローソク足の本数を変更することにより過去何か月かの MAクロスの勝率をすぐに確認することができます。 これは各時間足、各通貨で確認することが出来ます。 判定するローソク足を3か所選ぶことが出来ます。 ディフォルトでは5本目、9本目、14本目となっています。 サインの表示をボタンで表示したり消したりできます。 表示するサインを変更することが出来ます。

Very special indicator of Joe Dinapoli which is a derivative from traditional MACD indicator. It shows the precise price, at which MACD will show line crossing and trend shifting. Also, this level is known one period ahead of time.You can constantly reassess your current position by looking at this studying a variety of timeframes. When you are in a trade, you have a feel for how much time you have for the trade to go your way by looking at the distance between the MACD Predictor line and the

Very special indicator of Joe Dinapoli which is a derivative of a Detrended Oscillator. Through a set of parametric equations, a predicting oscillator is created that forecasts, one period ahead of time, overbought and oversold conditions. The resulting predictor values are expressed as bands on the bar chart, both above and below the market. It may be mistaken as a Bollinger Band but has no resemblance to it whatsoever. The Predictor bands may be used in a variety of ways to aid in entering an
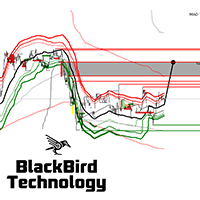
Ultimum Signal Indicator contains the most powerful buy,sell and exit signals. They can all be be separately turned on/off, so you decide what to display on the chart ! This is my ultimum inidicator that is a no-nonsense, no delay, no repaint indicator ! Signals : Target price levels :
Liquidity Pools (Liquidity voids, major supply/demand zones, and price discrepancies) Liquidity Pools Forecast Projection Market Reversals :
Reversal Blocks Pinbar groups Trend and mastertrend slowdowns (indicatin

The Robust filter indicator is based on the robust filtering algorithm developed by the author using the multi-period averaged moving median. The algorithm for this averaging is shown in the last screenshot. The indicator calculates and shows: 1. The direction of the trend; 2. Entry and exit points of positions; 3. StopLoss lines calculated from current price probability distributions and selected probability of closing an order by StopLoss before the trend revers

Introduction to Fibonacci Volatility Indicator Volatility indicator can help you to detect any statistical advantage for your trading. Especially, if you are trading with Price Action and Price Patterns, then we recommend to use the Volatility indicator together with your strategy. Especically, Fibonacci Volatility indicator combines the market volatiltiy with Fibonacci Analysis to provide you more advanced volatiltiy indicator. Main Features Fibonacci Volatility in Z score Configuration Mode Fi

The Pushing Trend indicator implements a kind of technical analysis based on the idea that the market is cyclical in nature. The indicator tracks the market trend, ignoring sharp market fluctuations and noise around the average price. It fixes the trend and shows favorable moments of entering the market with arrows. AND
Working with the Pushing Trend indicator is quite simple. Look at the arrows and determine the direction of work. The indicator can be used not only to fix the trend direction

The Trend Priority indicator can be used for both short-term pips and long-term trading. Works on all currency pairs and on all timeframes. When using it is recommended to look at the additional indicator of a filter of possible false signals.
Indicator shows signals for input. Displays both entry points and the trend itself. Shows statistically calculated moments for entering the market by arrows. When using the indicator, you can optimally distribute the risk factor.
Settings: Uses all one
MT5 : https://www.mql5.com/en/market/product/53385
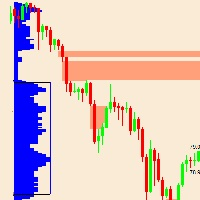
Este indicador é baseado na teoria do perfil de mercado.
O que exatamente é uma área para solteiros?
Teoria: Perfil de Mercado Singles:
Impressões simples ou únicas ou lacunas do perfil são colocadas no interior de uma estrutura de perfil, não na borda superior ou inferior.
Eles são representados com TPOs únicos impressos no perfil do Market.
Os solteiros chamam a atenção para locais onde o preço mudou muito rápido (movimentos por impulso
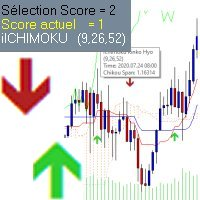
Indicator Ichimoku Arrows
to use with the Ichimoku indicator if you want to visualize. and very easy to use.
Use an arbitrarily chosen scale (to improve) to decide on the display or not of the signals according to their score. . the score takes into account -the positioning of the crossing of Kentan and kijun in relation to the cloud -if the chikou is above or below the course - the cloud trend. -the volatility of the movement. it is possible to select the display of the signals a

Our most popular indicator in our fleet of indicators. The POWR Trend Trader is the highest grossing manual strategy for trading on the market today. This indicator is upgraded with more Profit Points and also introduces Re-Entry alerts. The POWR Trend Trader (PTT) is our premier indicator! What this indicator can do for your profits is staggering! HOW TO USE The POWR Trend Trader has a Master Trend Meter at the bottom of the chart. We actually re-coded the main indicator that turns your candle

For sure, this indicator has become very popular amongst traders. Through coding this indicator will give you the most accurate levels possible for your trading analysis. We have also added in the ability for you to receive alerts when the price breaks above or below a Support or Resistance lines! HOW TO USE The red rectangles represent your resistance/supply zone. The green rectangles represent your support/demand zone. BONUS FEATURES We coded this indicator with the ability to switch between
Don’t overlook the power of this indicator. We took the time to find the best algorithm to pull the best momentum lines in the industry. We also coded in the orange stream to give you a quick glance at where the overall trend is heading. This indicator works incredibly well for Stocks, Forex and Crypto! HOW TO USE When the orange stream is heading down, this means you are in a strong downtrend. When the orange stream is heading up, this means you are in a strong uptrend. When the red lines start
For trading, the support and resistance lines for current price are everything. With the ability to adjust sensitivity, this indicator delivers just that! HOW TO USE The blue lines represent the most relevant support and resistance for the current price. You can adjust the sensitivity of the support and resistance lines by adjusting the input value under the indicator settings to show more or less support lines.

The indicator scans for stop grabber (special pattern of Joe Dinapoli which gives very high probability buy / sell signals and does not repaint ) signals in multiple timeframes for the all markets filtered and shows the results on Dashboard.
Key Features Dashboard can be used for all markets It can scan for stop grabber pattern on MN1, W1, D1, H4, H1, M30, M15 ,M5, M1 timeframes Parameters UseMarketWatch: Set true to copy all symbols available in market watch MarketWatchCount : Set the number

The Squat is a function of the range of a given price bar and the volume, or TIC volume, that occurs while that range is being created. The basic idea is that high volume and little price movement indicate substantial support or resistance. The idea behind the approach to this indicator is to first look for likely Fibonacci support and resistance and then see if Squat manifests when that point is reached. The indicator determines one of the high probability patterns of DiNapoli. It does not re

The indicator monitors the MACD trend in multiple timeframes for a specific market. No more shifting in between charts to check the trend direction while trading.
Key Features Indicator can be used for all markets Monitors every timeframe, from M1 to MN Able to move display label on chart by single click
Indicator Usage The dashboard appears to the left and upper part of the chart when attached. The shell encapsulating a timeframe goes red on a down trend, green on an up trend. If the default

The indicator monitors the Dinapoli MACD trend in multiple timeframes for the all markets filtered and shows the results on Dashboard.
Key Features Indicator can be used for all markets Monitors every timeframe, from 1 Min to Monthly
Parameters
UseMarketWatch: Set true to copy all symbols available in market watch MarketWatchCount : Set the number of symbols that you want to copy from the market watch list. CustomSymbols: Enter the custom symbols that you want to be available in dashboard. Ti

The Vkids Trend indicator displays the trend direction with colored bars, works in a simple and visual way. It uses a combination of reliable and simple indicators for price analysis. The graph is presented in the form of blue and red histograms. Red bars indicate a buy signal, blue bars - a sell signal. The graph is not redrawn during operation.
The signals of the Vkids Trend indicator can be interpreted as follows: Buy when the bars are blue and sell when they are red. The advantage of the i

The Dawn Trend indicator is not prone to redrawing or any other type of erroneous display. Sharp price fluctuations, as well as noise around average prices, are ignored.
Perhaps, trend indicators can be called the main ones, since classic trading involves looking for trends. Many classics of trading in financial markets have developed their systems specifically to search for market trends.
This indicator embodies the implementation of a trend indicator. Which fixes a certain direction of chan

The indicator scans for Dinapoli thrust pattern in multiple timeframes for the all markets filtered and shows the results on Dashboard. Key Features Dashboard can be used for all markets It can scan for thrust pattern on MN1, W1, D1, H4, H1, M30, M15 ,M5, M1 timeframes Ability to choose number of bars required above/below displaced moving average to define thrust Parameters
UseMarketWatch: Set true to copy all symbols available in market watch MarketWatchCount : Set the number of symbols that
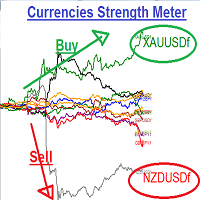
Currencies Strength Meters
:::: It is programmed to work on any M5 Chat windows !! Used to determine the Strongest currency pairs and the Weakest pairs also detect the peak of deviation of currencies strength IT CAN BE USED FOR INDICES AND STOCKS TOO !! Strategy one : It can be used in to BUY Strongest pair and SELL Weakest one Strategy two: It can be used on Daily basis to Hedge BUY Strongest pair with high % (ex: +1%) and BUY Weakest one with % lower(ex: -0.7%) the same with SELL Strategy t

Dollar mint indicator is a special workmanship with years of experience in forex.
Dollar mint ea is a fully non repaint indicator optimised with price action data such that once it gives you a signal t . The indicator can be used to trade anything on the mt4 with much ease.
Benefits ;
Fully non repaint Use in any timeframe Use in all the available tradable assets on mt4
Best to use on h4. It generates fully analysed buy and sell signals based on trend and also filters out retracements and

Hello This Indicator will draw Green (Up) and Red (Down) small arrows from Multi TimeFrames based in ( RSI ) to help you to take decision to buy or sell or waiting If there 4 green arrows in same vertical line that's mean (Up) and If there 4 Red arrows in same vertical line that's mean (Down) and the options contain (Alert and Mobile , Mail Notifications). Please watch our video for more details https://youtu.be/MVzDbFYPw1M and these is EA for it https://www.mql5.com/en/market/product/53352

Hello This Indicator will draw Green (Up) and Red (Down) small arrows from Multi TimeFrames based in ( Ichimoku ) to help you to take decision to buy or sell or waiting If there 4 green arrows in same vertical line that's mean (Up) and If there 4 Red arrows in same vertical line that's mean (Down) and the options contain (Alert and Mobile , Mail Notifications). Please watch our video for more details https://youtu.be/MVzDbFYPw1M and these is EA for it https://www.mql5.com/en/market/product/533

Na terceira captura de tela (Modo Luz do Dia) marquei 7 elementos que vamos explicar passo a passo. 1 Três botões. a) Modo Noturno b) Modo Luz do Dia c) Escala fixa / Escala ajustada 2 Quatro botões. a) Desenhe uma seta de compra, compre linha e o Stop Loss correspondente com base no ATR. b) Feche a compra anteriormente desenhada e sonoridade uma marca de verificação. c) Desenhe uma seta de venda, venda de linha e o Stop Loss correspondente com base no ATR. d) Feche a venda anteriormente des
Are you tired of drawing Support & Resistance levels for your Quotes? Are you learning how to spot Support & Resistances? No matter what is your case, Auto Support & Resistances will draw those levels for you! AND, it can draw them from other timeframes, right into you current chart, no matter what timeframe you are using...
You can also Agglutinate regions/zones that are too much closer to each other and turning them into one single Support & Resistance Level. All configurable.

Indicator without redrawing Divergent MAX The DivirgentMAX indicator is a modification based on the MACD. The tool detects divergence based on OsMA and sends signals to buy or sell (buy|sell), taking into account the type of discrepancies detected.
Important!!!! In the DivirgentMAX indicator, the optimal entry points are drawn using arrows in the indicator's basement. Divergence is also displayed graphically. In this modification of the MACD, the lag problem characteristic of its predecessor i

O MT4 ilimitado é um indicador universal que se adequa a todos os comerciantes iniciantes e experientes.
funciona em todos os pares de moedas, criptomoedas, ações em bruto
MT4 ilimitado - já configurado e não requer configuração adicional
E agora a principal coisa
Por que o MT4 ilimitado?
1 falta completa de redesenho
2 dois anos de testes pelos melhores especialistas em negociação
3 a precisão dos sinais corretos excede 80%
4 teve bom desempenho nas negociações durante os comunicados d

Rebalance Overlay Technology (Rebolt) enables the trader to visualize the flow of money from one chart to another chart. Rebolt Probability indicates the probability that money has flowed from one chart to another chart for a specified length of time over a number of intervals specified by the user. When Rebolt reads Cyan or Blue these are buying signs good for the length of time specified by the user or until a conflicting signal arises.
When Rebolt reads Violet or Red there are selling signs g

Planned Channel is a non-repainting channel indicator based on moving averages. The Planned Channel takes into account not simple moving averages, but double-smoothed ones, which, on the one hand, makes it possible to more clearly determine the market movement, and on the other hand, makes the indicator less sensitive. The key difference between the Planned Channel indicator and other channel indicators (for example, from the same Bollinger) is that the indicator displays more valuable signals f

The Reflex indicator is very easy to use, this is the key point. The indicator forms arrows (red and blue by default) and is installed in the usual way on any trading symbol with any time interval.
It is a trend and trading signal indicator based on the principle of combined analysis of calculated pivot points within a channel as well as overbought and oversold levels.
Indicator advantages High accuracy; Work with any trading symbols; Works at any time intervals; Not redrawn. Input parameters

All the points of intersection of the Troopers indicator will be points at which the trend direction changes. Sharp price fluctuations are ignored as well as noise around average prices. Signal points, where the color changes, can be used as potential market reversal points. The indicator tracks the market trend with very high reliability. This development can be used both for long-term trading and for pipsing on small periods. The indicator algorithm implements a kind of technical analysis base

Rebalance Overlay Technology (Rebolt) enables the trader to visualize the flow of money from one chart to another chart. Rebolt Delta (ReboltDelta) indicates the probable price change that will occur in the target chart based on changes in the source chart. ReboltDelta is designed for use in cooperation with Rebolt Probability. La tecnología de superposición de reequilibrio (Rebolt) permite al operador visualizar el flujo de dinero de un gráfico a otro gráfico. Rebolt Delta (ReboltDelta) indica
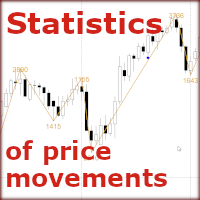
How to find out where to expect a price reversal with a probability of 80% - 90%?
The "Statistics of Price Movements" indicator collects statistics of significant price movements, skipping all small pullbacks, for a certain period of time and displays them in Excel file.
Sort the data in ascending order and get statistics of price reversals in 80%, 85%, 90%, 95% of all cases! (for example, in 2 years!)
After the reversal, the price will move from 1000 pips or more!
So...
Open the daily cha

ExtremChannel - индикатор канала движения цены. Каналы строятся на основании предыдущих максимумов и минимумов, а так же уровней поддержки и сопротивления. Есть возможность отображать канал, построенный индикатором на старшем таймфрейме. Индикатор очень прост в использовании и дает наглядные представления о примерных границах будущего движения цены. Например если цена вышла за пределы канала, это может означать скорую смену тренда. Индикатор работает на любой валютной паре и на любом таймфрейме.

FutureWave - индикатор строит предполагаемое будущее движение цены. В своих расчетах индикатор опирается на уровни поддержки и сопротивления, максимумы и минимумы, уровни Фибоначчи и волновой анализ. Индикатор прост в использовании, не требует дополнительных настроек и оптимизации. Работает на любой валютной паре и на любом таймфрейме.
Входные параметры: Wave Color - цвет волны
Price Action translates as "price movement." Proponents of technical analysis believe that the price takes into account everything that happens on the market. Therefore, indicators and advisers are not needed, since they are calculated based on historical price data and can be very late. By the time the indicator signal triggers, the price direction may already have changed. Those indicators that are trying to predict the price direction are often redrawn. All this leads to unnecessary losse
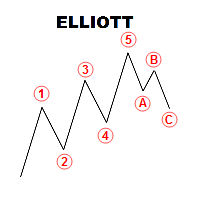
Panel with a set of labels for marking the Elliott wave structure
The panel is called using the Q key. if you click twice, you can move the panel along the schedule.
The panel consists of seven rows of three colored buttons, each of which creates 5 or 3 wave markings. Correction labels consist of 3 tags, or five by shift, you can break the chain of tags when installing by pressing the Esc key
.................... It is possible to disable the visibility of placemarks from lower timeframes whe

Inspired by high-level trading strategies from Jewish banks—strategies I first uncovered in a conversation on a leading traders' podcast—The Jewish Secret is your gateway to market mastery. The Jews are big players in the banking world, renowned for their market-making skills and keen understanding of market reactions, influenced the creation of this tool. With these strategies in mind, I've developed an indicator based on pure price action fundamentals. Its accuracy surpasses even my own expect

Multi Timeframe Moving Average Crossover Indicator With RSI Filter
Indicator gives buy/sell arrows on EMA Crossover. ( Fast EMA Crosses Slow EMA ) While your are monitoring the price in a certain timeframe, you can look for a EMA crossover in different time frames Indicator use RSI as a filter. ( Buy Confirmed when RSI crosses up 50, Sell Confirmed when RSI crosses down 50 ) No complicated settings. Good for pointing reversals on bigger timeframes while looking for a signal on smaller timeframe

FXC iCorrelatioN MT4 Indicator (Specialized for DAX - Dow Jones)
The indicator shows the correlation soefficient between two assets. Correlations are useful because they can indicate a predictive relationship that can be exploited in practice. The correlation coefficient shows the relationship between the two symbols. When the correlation is near 1.0, the symbols are moving togerhet in the same direction. When the correlation is near -1.0, the symbols are moving in opposite direction. Important:
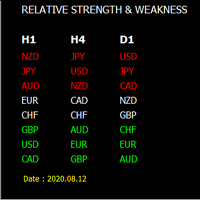
O Medidor de Força cambial é a forma mais fácil de identificar moedas fortes e fracas. Este indicador mostra a força relativa de 8 grandes moedas: AUD, CAD, CHF, EUR, GBP, JPY, NZD, USD.
Este Medidor de Força de Moeda é suportado por muitas funcionalidades poderosas: 1. Painel de contadores de força de moeda (mostra a força das moedas para qualquer prazo com classificação pelo nome ou valor num painel de instrumentos fácil de utilizar); 2. Permite calcular a força monetária média a partir de

This indicator calculates buy and sell signals by using MACD indicator on two timeframes. MACD is a trend-following showing the relationship between two moving averages of the closing price. The MACD is calculated by subtracting the 26-period Exponential Moving Average (EMA) from the 12-period EMA.The result of that calculation is the MACD line. A nine-day EMA of the MACD called the "signal line".
This indicator has 2 modes to calculate the buy/sell signals: - MACD crosses 0 line - MACD cross

O novo indicador é um preditor de tendência para o gráfico atual, bem como outros símbolos e prazos. Todos os botões do quadro são interativos. Por padrão, você tem 20 pares de moedas na lista de observação e três prazos (M5, H1, D1), mas você pode escolher os períodos e símbolos que deseja exibir no menu. Se o indicador for azul, indica o início de uma tendência de alta. Se for vermelho, indica o início de uma tendência de baixa. Na captura # 3 (modo Luz do dia) explicarei cada elemento em deta
O Mercado MetaTrader oferece um local conveniente e seguro para comprar aplicativos para a plataforma MetaTrader. Faça download de versões de demonstração gratuitas de Expert Advisors e indicadores a partir do seu terminal para testes no Testador de Estratégia.
Teste os aplicativos em diferentes modos para monitoramento do desempenho e assim fazer um pagamento para o produto que você deseja, usando o sistema de pagamento MQL5.community.
Você está perdendo oportunidades de negociação:
- Aplicativos de negociação gratuitos
- 8 000+ sinais para cópia
- Notícias econômicas para análise dos mercados financeiros
Registro
Login
Se você não tem uma conta, por favor registre-se
Para login e uso do site MQL5.com, você deve ativar o uso de cookies.
Ative esta opção no seu navegador, caso contrário você não poderá fazer login.