Conheça o Mercado MQL5 no YouTube, assista aos vídeos tutoriais
Como comprar um robô de negociação ou indicador?
Execute seu EA na
hospedagem virtual
hospedagem virtual
Teste indicadores/robôs de negociação antes de comprá-los
Quer ganhar dinheiro no Mercado?
Como apresentar um produto para o consumidor final?
Indicadores Técnicos para MetaTrader 4 - 126

Market Viewer gives a quick glance on correlation and direction. This indicator takes a list of symbols (max 8) Leave a symbol setting empty if you wish not to use that many - like in the defaults… It will check for each timeframe (Monthly, Weekly, Daily, H4, H1, 30min, 15min, 5min and 1min) if the current candle on that timeframe is bullish or bearish. This will give a good indication of the direction for us to trade in. We need to be in sync with the bigger timeframes.
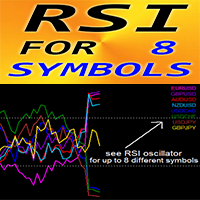
Indicador Forex "RSI para 8 símbolos" para MT4.
RSI é um dos osciladores mais populares para negociação É ótimo receber entradas de venda de uma zona de sobrecompra forte (acima de 70) e entradas de compra de uma zona de sobrevenda forte (abaixo de 30) RSI é muito útil para detecção de divergência "RSI para 8 símbolos" dá a oportunidade de controlar valores RSI de até 8 símbolos diferentes em apenas um gráfico Este indicador também é excelente para combinar com entradas de Price Action das ár
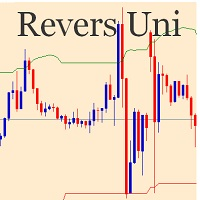
Индикатор разворота цены основанный на анализе трех таймфреймов. Когда вы выбираете параметр PERIOD, индикатор проводит рассчет по выбранному периоду и на два периода выше. Период М30 в рассчетах никак не участвует и его выбирать не рекомендуется. Максимальный верхний период для правильного рассчета применяйте не выше D1, т.к. в него уже войдут периоды W1 и MN. Период для установки индикатора выбирайте произвольно, а для более точного входа, я рекомендую М1,М5 и М15.

Real Trade Entry indicator is designed for signal trading. This indicator generates trend signals.
It uses many algorithms and indicators to generate this signal. It tries to generate a signal from the points with the highest trend potential.
This indicator is a complete trading product. This indicator does not need any additional indicators.
The indicator certainly does not repaint. The point at which the signal is given does not change. Signals are sent at the beginning of new candles

PSI - индикатор скорости цены. Он основан на измерении длинны каждого поступающего тика в терминал. Таким образом мы можем понять насколько сильно (с какой скоростью) цена движется вверх или вниз, и видеть остановку движения цены.
При увеличенной тиковой скорости цены вверх (тики вверх имеют большую длину чем тики вниз) - индикатор показывает зеленую гистограмму, при увеличенной скорости цены вниз (тики вниз имеют большую длину чем тики вверх) - индикатор показывает красную гистограмму. Индика

The Trend Engine indicator is good for any trader, suitable for any trader for both forex and binary options. Trend indicator, a revolutionary trend trading and filtering solution with all the important features of a trend tool built into one tool! You don’t need to configure anything, everything is perfected by time and experience, it works great during a flat and in a trend.
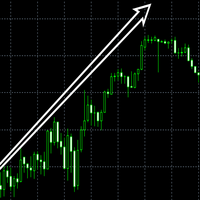
Absolute High Low indicator is a discretionary tool for assessing extremes in the price. It is very self-explanatory, and you can test against other default oscillators to see the difference. Combine with your trend following systems to master entry and exit at extremes. Back test and study the indicator to see the results up against a system or indicator. The indicator calculates a number of max bars so a gap will appear at the end, and it will restart. MT5 Version: https://www.mql5.com/en

[V 1.00] O MTF NRPA 5 Moving Average RTD foi lançado!
Painel em tempo real de seta sem repintura.
Se você está procurando o melhor indicador de média móvel, está na página certa. Geralmente as pessoas instalarão duas médias móveis porque a interseção das duas médias móveis (o cruzamento) determinará a direção da próxima tendência de preço. Se a média móvel rápida cruzar com a média móvel lenta e rápido > lento, a tendência é de alta. Por outro lado, se a média móvel rápida cruzar com a médi

Manuscript is a time-tested indicator, many tests have been conducted in its use, I will tell all buyers my recommendations on using forex, cryptocurrency or binary options
This indicator gives a signal exactly at the close of the candle of the selected period
The arrow does not disappear after the signal, you can set up email notifications
I recommend using it on the period H1,H4,daily If you are aware of its work, you will be able to trade in a plus
In the future I will give you my re

This all-in-one indicator displays real-time market structure (internal & swing BOS / CHoCH), order blocks, premium & discount zones, equal highs & lows, and much more...allowing traders to automatically mark up their charts with widely used price action methodologies. Following the release of our Fair Value Gap script, we received numerous requests from our community to release more features in the same category. //------------------------------------// Version 1.x has missing functions + PDAr
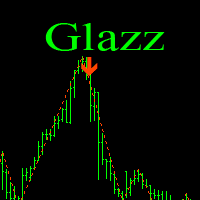
Glazz is a great mix of standard Bollinger Bands and ZigZag . The essence of the strategy - is the search for extreme points - possible reversals. When building a signal, we use Bands of a large period and a small ZigZag period. When the indicator has calculated the entire value for signal search, it shows an arrow to buy/sell and gives a sound signal. Simply put, ZigZag is looking for a possible reversal, and Bollinger Bands confirms this reversal.
The indicator settings are simple. By defau

A Clean and Easy to Use indicator, this indicator will Turn Lightblue when Price is Trending Up and LightRed when Price is Trending down. this indicator is one part of a set of three and when combined creates a full Trading Strategy. When used with Mint Channels and Mint RSi-CD you will take buy signals when price hits LightBlue upper channel and RSi-CD shows a LightBlue Bar Above Signal Line But only if Trend Indicator is Blue / if Price touches Bottom Red Channel and RSi-CD shows a red bar be

A Clean and Easy to Use indicator, this indicator will Draw a Lightblue channel and a LightRed Channel that you can use as a signal when price touches these lines. it can also be used to set stop loss and take profit values / Hint: set stoploss outside the channels and TakeProfit inside the channels. this indicator is one part of a set of three and when combined creates a full Trading Strategy. When used with Mint Channels and Mint RSi-CD you will take buy signals when price hits LightBlue uppe

A Clean and Easy to Use indicator, this indicator Shows a Lightblue Bar when price is headed up and a LightRed Bar when price is headed down for a Buy signal you want a Blue bar to show above the signal line / for a sell signal you want a Red bar to show below the signal line. this indicator is one part of a set of three and when combined creates a full Trading Strategy. When used with Mint Channels and Mint Trend you will take buy signals when price hits LightBlue upper channel and RSi-CD sho

The Visual Volatility Clustering indicator clusters the market based on volatility. The indicator does not redraw and gives accurate data, does not use closing prices. Uses the opening prices or the highs or lows of the previous completed bar. Therefore, all information will be clear and unambiguous. The essence of the indicator is to divide the price market into certain areas according to a similar type of volatility. This can be done in any way. In this example, the indicator is configured fo

O robô Choppines é carregado como um indicador na pasta de indicadores MT4
Recomenda-se usar um tempo de vela de 5 minutos, o tempo de expiração recomendado do robô é de 5 minutos.
O robô pode ser configurado para enviar sinais para plataformas MT2, MX2, PRICEPRO. Para enviar sinais, você deve utilizar o programa conector da plataforma com a qual queremos trabalhar.
Para instalar no conector, execute o seguinte procedimento (anexada uma imagem descrevendo a configuração com o conector da

The Visual Volatility Clustering indicator clusters the market based on volatility. The indicator does not redraw and gives accurate data, does not use closing prices. Uses the opening prices or the highs or lows of the previous completed bar. Therefore, all information will be clear and unambiguous. The essence of the indicator is to divide the price market into certain areas according to a similar type of volatility. This can be done in any way. In this example, the indicator is configure

Unleash the Power of Repetitive Market Price Levels (Markets often repeat structure ).
Are you tired of guessing the crucial support and resistance levels in your trading strategy? Do you want to enhance your decision-making process with reliable and accurate market insights? Look no further! We proudly present the interactive digital product designed to transform your trading experience – the Ultimate Support and Resistance Zones Indicator.
Unlock the Potential of Critically Watched Sup
Todos que baixam este indicador, testam suas capacidades e escrevem sua opinião, receberão um robô grátis como presente que abre negociações com os sinais deste indicador.
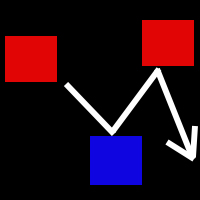
O indicador "Scalping squares pro" é um indicador projetado para encontrar pontos de reversão de preços usando uma estratégia de escalpelamento. Este indicador mostra na forma de quadrados coloridos no gráfico, pontos de reversão de preços. Com essas informações em mãos, o trader tem a oportunidade de abrir efetivamente ope
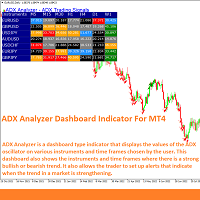
ADX Analyzer is a simple dashboard type indicator that displays the values of the ADX oscillator on multiple instruments and time frames chosen by the trader. The ADX is a trend strength indicator that is usually used in many trading strategies, especially in trend following systems, as a filter that indicates when the price has a strong bullish or bearish trend. This indicator and its dashboard can be configured to show signals when the ADX detects a strong bullish/bearish trend, when a strong
This is Non-Repaint Indicator with Buy and Sell signals. Tradable Instruments: Forex, Cryptocurrency, Gold Signal GPT Indicator allows analysis to help traders identify entry and exit points in the market data.It's important to note that buy and sell indicators should not be used in isolation, but in conjunction with other forms of analysis, such as fundamental analysis and market sentiment. Traders should also be aware that no indicator is foolproof and that market conditions can change rapidl

[V 1.00] MTF NRPA 5 RSI RTD foi lançado!
Painel em tempo real de seta sem repintura.
Se você está cansado de usar vários indicadores RSI, mas acha que eles são imprecisos, tente esta ferramenta. Normalmente, as pessoas instalam apenas 1 RSI para determinar o nível de OBOS em um período de tempo. A má notícia é que você não pode ver os níveis e tendências do OBOS em vários períodos de tempo ao mesmo tempo. É por isso que desenvolvi esta ferramenta de negociação.
Veja como é explicado:
Ne
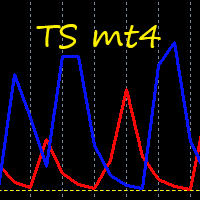
This indicator takes input from a trend filter to determine best entries for trades, on the crossings of the two lines. Excellent for scalping. A simple indicator that doesn't need setting up. Does not feature any alerts. How to use: Simply attach to any chart. When used on lower timeframes, also confirm on higher timeframes. Buy: Blue line moves to Level-0 yellow dotted line. Best results when confirming this on multiple timeframes, e.g., Daily-Weekly-Monthly. Sell: Red line moves to Level-0

The Bar Size MA Indicator is a powerful tool designed to assist traders in identifying market volatility and price dynamics by offering a unique perspective on bar sizes. Developed for the MetaTrader 4 platform, this indicator can provide valuable insights for different trading strategies and can help in enhancing your trading decision-making process. The Bar Size MA Indicator calculates the moving average of bar sizes for a user-specified period. The 'bar size' is defined as the difference betw

The Init Treand indicator tracks market trends, ignoring sharp fluctuations and market noise. The indicator can work both for entry points and as a filter.
The Init Treand indicator displays information in a visual way. It will help in finding entry points in the analysis. Suitable for trading on low timeframes because it ignores sudden price spikes or corrections in price action by reducing market noise around the average price.

Forex Meta Trend indicator - using the built-in algorithm allows you to determine the current trend. You can quickly understand what kind of trend is currently developing in the market. The indicator projects one of the main market wisdoms and says - "The trend is my friend". Using this indicator, you can develop a trading system in the financial markets. Since the indicator is designed specifically to create a system for searching for a market trend. This indicator does not lag and shows the tr

OFFER! OFFER! ONLY 5 COPIES REMAINING FOR THE NEXT PRICE TO BE 360$
Dear traders I am very glad to introduce the Sweet Arrows Indicator to you. The Sweet Arrows indicator is well designed to help serious investors to trade with confidence. In short I can say that this is one of the valuable tool to add in your trading tool kit.
INSTANT, FAST AND NON LAGGING SIGNAL
This is an instant signal meaning that you get the signal as soon as the bar opens. The signals don't lag meaning that i

This Happy Trend Arrow indicator is designed for signal trading. This indicator generates trend signals.
It uses many algorithms and indicators to generate this signal. It tries to generate signals from the points with the highest trend potential.
This indicator is a complete trading product. This indicator does not need any additional indicators.
The indicator is never repainted. The point at which the signal is given does not change.
Features and Recommendations Time Fra

This Wonders Real Arrow indicator is designed for signal trading. This indicator generates trend signals.
It uses many algorithms and indicators to generate this signal. It tries to generate signals from the points with the highest trend potential.
This indicator is a complete trading product. This indicator does not need any additional indicators.
The indicator is never repainted. The point at which the signal is given does not change. When the signal comes the arrows are put back on
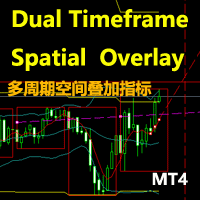
Don't miss any trading opportunities! Purchase the Dual Timeframe Spatial Overlay indicator today to make your trading analysis more intuitive and precise, helping you easily grasp market dynamics.
Are you looking for a more intuitive and accurate way to analyze market trends and catch trading opportunities? We present to you the Dual Timeframe Spatial Overlay indicator, a powerful tool that will help you predict potential price movements and accurately time your trades. The indicator consist

Urgent reminder> Only 13 copies remaining for the price to double on all renting options. Get your copy Today!
Introduction Dear Traders, I am always working to come up with tools that may help you to become a better trader and investor. Due to my experience in trading and market analysis and trading software design and development, I am glad to introduce to you my other tool called " Amazing Entries Indicator ". The Indicator is designed in a way that it combines different strategy to provide

The Fisher Transform is a technical indicator created by John F. Ehlers that converts prices into a Gaussian normal distribution. The indicator highlights when prices have moved to an extreme, based on recent prices. This may help in spotting turning points in the price of an asset. It also helps show the trend and isolate the price waves within a trend. The Fisher Transform is a technical indicator that normalizes asset prices, thus making turning points in price clearer. Takeaways Turning poi
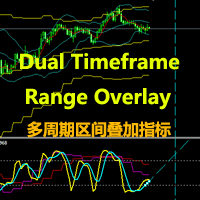
Don't miss any trading opportunities! Purchase the Dual Timeframe Range Overlay indicator today to make your trading analysis more intuitive and precise, helping you easily grasp market dynamics.
Are you looking for a more intuitive and accurate way to analyze market trends and catch trading opportunities? We present to you the Dual Timeframe Spatial Overlay indicator, a powerful tool that will help you predict potential price movements and accurately time your trades. The indicator consist

The standard RSI indicator is very helpful in identifying overbought or oversold areas during a flat, but gives a lot of false signals when the market is trending. For example: during an uptrend, the standard indicator often enters the "oversold" zone and extremely rarely (most often, when the trend has already ended) enters the "overbought" zone. This indicator takes into account the trend movement and, with the selected settings, can enter the zone opposite to the trend direction, giving a sig

This Rattling Signal Point indicator is designed for signal trading. This indicator generates trend signals.
It uses many algorithms and indicators to generate this signal. It tries to generate signals from the points with the highest trend potential.
This indicator is a complete trading product. This indicator does not need any additional indicators.
The indicator is never repainted. The point at which the signal is given does not change. When the signal comes the arrows are put back

This Great Entry System indicator is designed for signal trading. This indicator generates trend signals.
It uses many algorithms and indicators to generate this signal. It tries to generate signals from the points with the highest trend potential.
This indicator is a complete trading product. This indicator does not need any additional indicators.
The indicator is never repainted. The point at which the signal is given does not change. When the signal comes the arrows are put back one
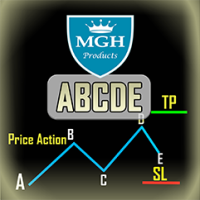
Indicador ABCDE
Este indicador é baseado nos padrões primários de abc da ação do preço (ou seja, quebra, retorno, movimento). Esses padrões se assemelham ao padrão de rali-base-rally, e um conjunto de análises, como análise de tendência e análise de divergência, são verificados para emitir um sinal preciso. Ele fornecerá sinais de negociação bastante precisos e dirá quando é melhor abrir e fechar uma negociação. Pode ser aplicado a qualquer ativo financeiro: forex, criptomoedas, metais, ações,
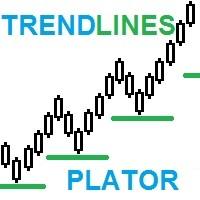
TrendLines Plator: Potencialize suas Estratégias de Negociação com um Indicador Avançado de Projeção de Tendências Explore o potencial do nosso indicador inovador! Com a habilidade de analisar e projetar linhas de tendência de prazos mais amplos diretamente no seu período de tempo atual, ele oferece um suporte estratégico que chama a atenção de traders em geral. Esses pontos se transformam em níveis estratégicos de suporte ou resistência para suas operações, fortalecendo sua estratégia de negoci
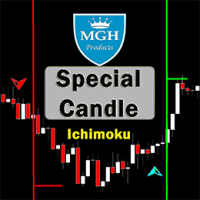
Vela Especial
Você gostaria de usar um dos melhores indicadores de câmbio baseado na estratégia Ichimoku, que é muito bem sucedida? Você pode usar um ótimo indicador baseado na estratégia Ichimoku.
A versão MT5 está disponível aqui .
Primeira estratégia:
Esta estratégia inclui identificar intersecções semelhantes e raras e poderosas.
Os horários mais adequados para esta estratégia são 30 minutos (30M) e 1 hora (H1).
Os símbolos adequados para o gráfico de 30 minutos são:
• CAD/JPY
• CH

Are you tired of the uncertainty that arises when your orders fail to stop at a specific line due to the spread? Look no further! Introducing our indicator that plots candlesticks based on the Ask price instead of the traditional bid-based chart commonly used in MQL4. With this indicator, you can say goodbye to the frustrations caused by the bid-based chart, as it provides you with a more accurate representation of market movements. By utilizing the Ask price, which represents the price at whic
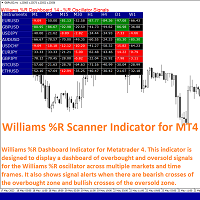
Williams R Scanner Indicator is a technical tool for Metatrader 4 designed to display a simple dashboard showing the values of the Williams %R oscillator across multiple markets and time frames of the trader's choosing. The dashboard also shows when the Williams %R indicator reaches an overbought or oversold condition which may precede market reversals.
The trader also has the option of viewing signal alerts on the platform that indicate when the Williams %R has made a bullish or bearish cros
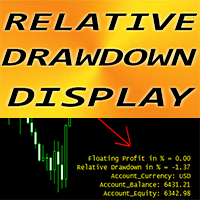
Indicador Forex "Exibição de rebaixamento relativo" para MT4, ferramenta de suporte comercial.
Este é um indicador OBRIGATÓRIO para traders que usam sistemas de negociação em grade!!!
O indicador de exibição de rebaixamento relativo mostra DD relativo atual ou lucro flutuante em% em sua conta. Alertas de PC e dispositivos móveis são integrados com nível de disparo ajustável Indicador também indica Saldo e Patrimônio Líquido da conta É possível localizar os valores dos indicadores em qualque

Introducing the Donchian Channels indicator for MQL4, a powerful technical analysis tool designed to boost your trading success. This indicator consists of four lines that represent the upper and lower boundaries of price movement over a specified period. With the Donchian Channels indicator, you can easily identify potential breakouts and reversals in the market. The upper line shows the highest high of the specified period, while the lower line represents the lowest low. The space between thes
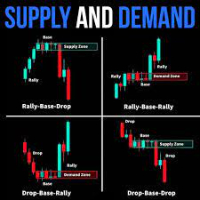
indicators included supply and demand indicator Specification Buy trade A SUPPORT zone (or immediately forms above the support zone) if the candle sticks are below either the middle or the lower band NO BUY TRADE IN THE RESISTANCE ZONE (RED HIGHLIGHTED ZONE), Sell trade A RESISTANCE zone (or immediately forms below the resistance zone) if the candle sticks are above either the middle or the upper band NO SELL TRADE IN THE SUPPORT ZONE (GREEN HIGHLIGHTED ZONE), In the supply zone, the prices are

Apresentando o indicador Hull Crossover Alert para MT4, uma ferramenta poderosa projetada para aprimorar suas decisões de negociação. Este indicador utiliza o Hull Moving Average (HMA) e incorpora recursos avançados para filtrar sinais falsos e fornecer alertas rápidos e confiáveis.
Com o indicador Hull Crossover Alert, você pode se beneficiar das características únicas da média móvel do casco. Sua capacidade de resposta às mudanças de preço e curva suave ajudam a identificar possíve

Tendenceris - Indicador de Tendência MT4 Eleve suas habilidades de negociação com Tendenceris ! Este incrível indicador para MetaTrader 4 exibe em tempo real as tendências em diferentes intervalos de tempo. Não perca nenhuma oportunidade de negociação! Recursos Principais: Identifica e visualiza as tendências em diferentes intervalos de tempo, de 1 minuto até 1 dia . Interface intuitiva e limpa, exibindo claramente as informações de tendência no gráfico. Atualizações em tempo real, fornecendo as
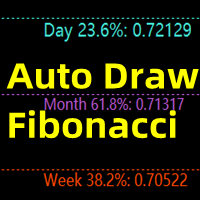
This indicator is mainly used to analyze future support and resistance levels for better trade analysis.
If the support level is effectively supported for many times, the market will break through the previous high point, and the effective trend breakout will be long.
After the down, the market cannot overshoot the pressure level for many times, and then goes down and breaks through the previous low price again, and the effective trend breaks through the short position.
When the marke
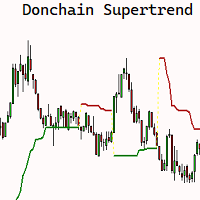
O indicador SuperChannel para MQL4 é uma poderosa ferramenta de análise técnica projetada para ajudar você a tomar decisões informadas de negociação. Com base no popular indicador SuperTrend, esse indicador oferece uma abordagem única usando máximas e mínimas ao longo de um período n em vez da Média do Intervalo Verdadeiro (ATR) para construir a linha. O indicador SuperChannel permite identificar facilmente as tendências de mercado e localizar pontos de entrada e saída ideais para suas negociaçõ

Discover PM - Your Ultimate Precision Forex Indicator for Informed Trading Decisions! In the fast-paced and ever-changing world of Forex trading, having a reliable and accurate indicator can make all the difference between success and missed opportunities. Say hello to PM, the revolutionary Precision Momentum indicator, engineered to empower traders with unparalleled insights into market dynamics, volatility, and trends. At the heart of PM's power lies its ability to precisely identify moments

Pips forex é um sistema de negociação pronto. Este indicador mostra com setas no gráfico quando e em que direção você precisa abrir um pedido. Se a seta estiver verde, abrimos uma transação de compra e, se a seta estiver vermelha, abrimos uma transação de venda. Tudo é muito simples e bastante eficaz. TakeProfit definiu 15-25 pontos. StopLoss definido no nível de pontos. Quando os pontos se movem, cancelamos imediatamente o StopLoss. Prazo recomendado para negociar M1 e M5. Esta é uma estratégi

"TOP G ARROWS" shows price reversal points designed for scalping and intraday trading.
Contains internal reversal filters (ATR, HHLL, RSI). Can be used on all time frames and trading instruments. Can be used on M1, M5, M15 time frames for scalping or M30, H1, H4 for intraday trading, Recommended for M30 and H1. The arrows are built on candle close (appears on previous bar at the open of the new candle)

Thanks to this indicator, you can easily see the new ABCD harmonic patterns in the chart.
If the two price action lengths are equal, the system will give you a signal when it reaches the specified level.
You can set the limits as you wish. For example, You can get the signal of the price, which occurs in the Fibonaci 38.2 and 88.6 retracements, and then moves for the same length, at the level you specify. For example, it will alarm you when the price reaches 80% as a percentage.
In vertic
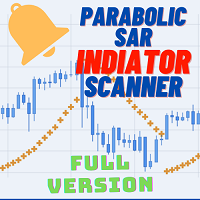
Welcome to the world of advanced trading with the Parabolic SAR Scanner Full! Maximize your trading experience with our powerful MT4 indicator designed for seamless analysis and real-time insights. Key Features: Effortless Parabolic SAR Scanning: Unlock the full potential of the Parabolic SAR Scanner Full by effortlessly scanning multiple currency pairs. Receive instant alerts when specific Parabolic SAR conditions are met, ensuring you stay ahead of market movements. Comprehensive Dashboard In
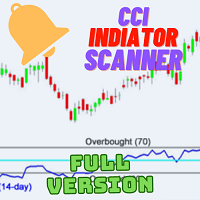
Welcome to the world of advanced trading with the CCI Multicurrency Scanner! Elevate your trading experience with our powerful MT4 indicator designed for seamless analysis and real-time insights. Key Features: Effortless CCI Scanning: Unlock the full potential of the CCI Multicurrency Scanner by effortlessly scanning multiple currency pairs. Receive instant alerts when specific Commodity Channel Index (CCI) conditions are met, ensuring you stay ahead of market movements. Comprehensive Dashboard

If you have been anywhere near Forex forums or social media lately, you have no doubt been hearing people talk about Smart Money Concepts (SMC) trading. You may be wondering what SMC is, and whether it deserves all the hype. In this post, we will introduce Smart Money Concepts trading to you so you can make an informed decision about whether or not to give this strategy a try in your own trading. What is SMC Forex trading? Smart Money Concepts (SMC) is one of many forex trading methods. SMC
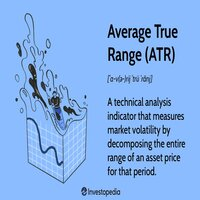
The "Wilder's Average True Range (ATR)" tool is used to measure the volatility of a financial instrument. It was developed by J. Welles Wilder Jr. and is commonly used by traders to assess the potential price range and volatility of an asset. The ATR indicator provides valuable information for setting stop loss levels, determining position sizes, and identifying potential breakouts. Here's how to use the "Wilder's Average True Range (ATR)" tool: Install the indicator: Add the ATR indicator to yo

The Time Segmented Volume (TSV) is a technical indicator that measures the volume of a financial instrument within specific time segments. It helps traders identify buying and selling pressure based on volume analysis. The TSV indicator can be used as part of a trading strategy to generate trade signals and confirm market trends. Let's explore how to use the TSV indicator as a trading strategy. To begin, add the TSV indicator to your trading platform. The TSV is typically represented as a line o

The Chaikin Oscillator is a technical indicator developed by Marc Chaikin that combines price and volume data to measure the accumulation and distribution of a financial instrument. It aims to identify potential buying and selling opportunities in the market. The Chaikin Oscillator is calculated by subtracting a 10-day exponential moving average of the Accumulation Distribution Line (ADL) from a 3-day exponential moving average of the ADL. Here's how to use the Chaikin Oscillator indicator in tr

Indicator show best signals for buy and sell orders. Indicator uses only 2 inputs: DEMA Fast Period - fast double exponential moving average period DEMA Slow Period - slow double exponential moving average period Crossings of fast and slow double double exponential moving averages shows buy and sell signals, which are drawn as green and magenta arrows respectively.

Indicator show best signals for buy and sell orders. Indicator uses only 3 inputs: DEMA Fast Period - fast double exponential moving average period DEMA Slow Period - slow double exponential moving average period DEMA Trend Period - trend double exponential moving average period
Position of price according to trend double double exponential moving average and crossings of fast and slow double double exponential moving averages shows buy and sell signals, which are drawn as gree

Indicator show best signals for buy and sell orders. Indicator uses only 2 inputs: PEMA Bounce Period - bounce percentage exponential moving average period PEMA Confirm Period - confirm percentage exponential moving average period Positions of price according to bounce and confirm percentage exponential moving averages and directions of bounce and confirm percentage exponential moving average shows buy and sell signals, which are drawn as green and magenta arrows respectively.

Automated Supply and Demand Trading Edge MT4 These videos demonstrate how we apply the supply and demand system to our latest trading review and market analysis. US Tech 100 Index Trade Setup time laps 12/6/2023. https://youtu.be/zHdjHnr3GNo https://youtu.be/JJanqcNzLGM , https://youtu.be/l70MIHaQQa4 , https://youtu.be/pg0oiT5_8y0 Enhance your Trading Strategy with the Supply and Demand Trading Edge MT4. Gain a competitive market advantage with the Supply and Demand Trading Edge MT4

The indicator has been designed to function on any time-frame and any pair. This regime filter will help the trader better evaluate whether the current market is trending, and in which direction. It quickly reacts to changes in market dynamics using a series of advanced calculations. The user is able to select whether the calculation remains standard, or if a further filter constraint is added to the calculation. A Yellow moving average of the signal has been included for the trader to smoot
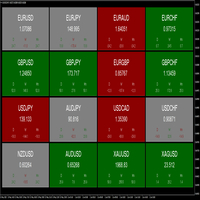
The dashboard indicator has been designed to quickly show the trader the price movements of various currency pairs. The user is able to select 3 different timeframes to analyse. When the pip difference for each respective timeframe is either positive or negative, the pair block will be coloured green or red respectively. This allows the trader to view which timeframes are in agreement, as well as the pip movements therein. A good visual tool to view multiple pairs and timeframes at once. T
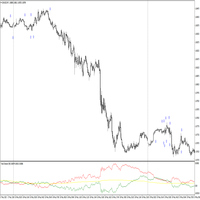
The indicator has been designed to function on any time-frame and any pair, although it is best suited for 5-minute charts. This trend filter will help the trader better evaluate whether the current market is trending, and in which direction. A dynamic filter threshold has been added to help the trader avoid choppy market conditions, and add greater confidence when entering, with an added functionality of plotting signal arrows on the chart to aid in detecting possibly entries. The Yellow in
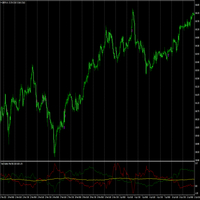
The indicator has been designed to function on any time-frame and any pair, although it is best suited for currency pairs on 5-minute charts, and used in conjunction with the Trend Direction Filter Indicator . This trend volatility filter will help the trader better evaluate whether the current market is trending, and in which direction. A dynamic filter threshold has been added to help the trader avoid choppy market conditions, and add greater confidence when entering, with an added functiona
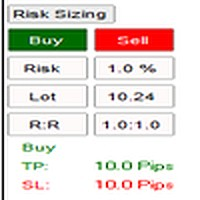
The indicator has been designed to function on any time-frame and any pair. The user is able to input their desired risk percentage per trade based on their account size, and choose whether they wish to calculate risk based on a limit order or market order. When initialised, a non-invasive button will appear on the left-hand side of the chart. Upon selection, a drop down will appear with a Buy and Sell button, these will in turn place movable lines on the chart that are used to appropriately
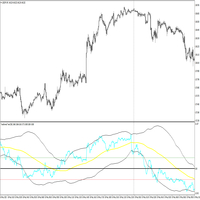
The indicator has been designed to function on any time-frame and any pair, although it is best suited for 5-minute charts. This price transformation will help the trader better evaluate whether the current market is trending, and in which direction. A dynamic filter has been added to help the trader avoid possibly entering against the trend. Two filter threshold lines may enable the trader to avoid choppy or flat market conditions. The Yellow indicator line is the filter and the Blue indica
Deseja melhorar sua negociação com um indicador de blocos de pedidos? Blocos de ordens são áreas do mercado onde se acumulam ordens de compra ou venda que podem causar mudanças de tendência ou fortes movimentos. Identificar esses blocos de pedidos pode ser muito útil para encontrar oportunidades de entrada e saída, bem como para gerenciar riscos e lucros. Mas encontrar esses blocos de pedidos manualmente pode ser difícil e tedioso. É por isso que criamos o Oberis, um indicador de blocos de orden
Supply and Demand Tracker MT4
US PPI, Fed Interest Rates, and FOMC Trade Setup Time Lapse: U.S. dollar(DXY) and Australian dollar vs U.S. dollar(AUD/USD) https://youtu.be/XVJqdEWfv6s May CPI Trade Setup Time Lapse: Gold, Euro/US dollar, US Tech 100, and USDX Experience the power of our cutting-edge supply and demand system as we delve into the captivating world of market dynamics surrounding the release of the consumer price index (CPI). Our system, built on the principles of supply and dema
O Mercado MetaTrader é o melhor lugar para vender robôs de negociação e indicadores técnicos.
Você apenas precisa desenvolver um aplicativo para a plataforma MetaTrader com um design atraente e uma boa descrição. Nós vamos explicar como publicar o seu produto no Mercado e oferecer a milhões de usuários MetaTrader.
Você está perdendo oportunidades de negociação:
- Aplicativos de negociação gratuitos
- 8 000+ sinais para cópia
- Notícias econômicas para análise dos mercados financeiros
Registro
Login
Se você não tem uma conta, por favor registre-se
Para login e uso do site MQL5.com, você deve ativar o uso de cookies.
Ative esta opção no seu navegador, caso contrário você não poderá fazer login.