Conheça o Mercado MQL5 no YouTube, assista aos vídeos tutoriais
Como comprar um robô de negociação ou indicador?
Execute seu EA na
hospedagem virtual
hospedagem virtual
Teste indicadores/robôs de negociação antes de comprá-los
Quer ganhar dinheiro no Mercado?
Como apresentar um produto para o consumidor final?
Indicadores Técnicos para MetaTrader 4 - 104

The Schindler indicator implements a trend trading strategy, filtering and all the necessary functions built into one tool! The principle of operation of the indicator is to automatically determine the current state of the market when placed on a chart, analyze historical data based on historical data and display instructions for further actions on the trader's screen. You need to understand that any arrow indicator is only a visual form of a signal. As a rule, such Forex indicators contain a wh
GannRS Trend Scalper GannRS is an advanced trading tool based on Gann Law and Supports and Resistances. designed to have an active trading at any time not lagging Indications are given at the beginning of a new candle
Please watch the full tutorial video.
How to use GannRS Very easy to set up... Put it on your chart Adjust inputs
Inputs Show Resistance and support : [bool] true = Shows R/S on chart false = does not show Show Levels :[bool] true = Shows levels on the chart false = does n

Super Trend Button Super Trend is a trading strategy according to which one should trade Forex or Stocks when its price trend goes up, and trend goes down, expecting price movements to continue. “The trend is your friend” agree? Features - Special Button : Quick hide/show Super Trend chart. ( Make your Chart more clean and clear easily) - Color : You have the option of customising your favourite colour of Up Trend or Down Trend . - Super Trend Periods : You have the option to c
O indicador iPump é um indicador versátil que combina as vantagens de três categorias de indicadores.
detecção de tendência simultânea em vários TFs definindo zonas de resistência e suporte determinação de zonas de sobrecompra e sobrevenda Funções do indicador: Definindo uma tendência Esta função será necessária para todos os traders que desejam avaliar objetivamente a direção atual do mercado e evitar a subjetividade. Em uma fração de segundo, você será capaz de comparar a direção da tendênci
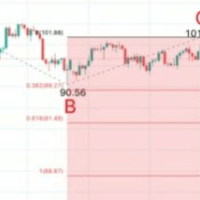
A Chart Analytics Program and helps in asset analysis using the Fibonacci Complex.
The primary Fibonacci numbers used in trading are 61.8% and 38.2%. 8% is derived from dividing any number in the Fibonacci sequence by its previous one. F n / F n-1 2% is derived by squaring 61.8 and alternatively by dividing any number in the sequence by the number two places to its right. F n /F n+2 The second tier of Fibonacci numbers used in trading is 23.6%, 76.4%, and 78.6%. 6% is derived from dividing an
YOU ARE PUCHASING A FOREX INDICATOR THAT WAS CUSTOM BUILT IN 2021 THIS INDICATOR WILL HELP YOU FIND PRECISE ENTRIES FOR TRADES. SO HOW DOES IT WORK? 1) It looks for engulfing candlestick pattern. (It can tell if there is a bullish or bearish engulfing pattern which is a typically a reversal signal) 2) It will also look to see if price is near a short term extreme by using Bollinger Bands. 3) It combines the engulfing candle stick pattern along with Bollinger Bands to give signal 4) If price has

Description Better version of RSI indicator which offer a complete visual trading strategy and realize an auto-optimization Support: We create great tools for the entire trading community. Most of them are free. If you believe in what we do Support Us Here. KEY LINKS: How to Install – Frequent Questions - All Products How is this indicator useful? NEVER repaints. Detect best parameters of RSI indicator, based on profit factor during the specified period. This indicator can be used as
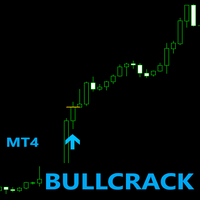
BULLCRACK MT4
*Non-Repainting Indicator/Analyzer Pick trades when it 20-30 confirmed a bull trend. No need to filter trades as every single signal has gone through multiple levels of confirmations. Strictly on buy trades . STRICKTLY FOR THE 15MINS TIMEFRAME!! Trades any pairs . *Push notifications to phone or computer * For Scalping * For Swing Trading *Arrow Appears at The "Close Of The Candle" *popup alerts* No much trades cause no random trades!
**very perfect for Expert and New Traders!
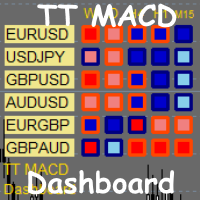
TT MACD Dashboard is multi-time frame and multi-currency market scanner. It is telling you the value of MACD and MACD histogram (a difference between MACD line and Signal line) in a form of small rectangle. If MACD value is above zero (MACD is bullish). Rectangle border color is bullish (Navy by default). If MACD value is below zero (MACD is bearish). Rectangle border color is bearish (OrangeRed by default). If MACD histogram is rising and above zero (Bullish histogram). Rectangle color is bull
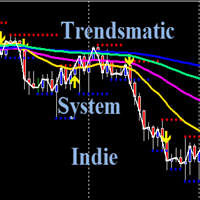
Trendsmatic System Indie Plus
Trendsmatic System Indie is an indicator that gives in-depth analysis of market trending on any currency pair as displayed
in the MT4's Market watch. It actually shows the states of the current candles and the trending positions on all higher
time-frames for a long term price trending movements.
This can give a trader a stupendous profits on a long term single trade with long stride trend movements in a specific
direction. It saves the trader some hassles of a
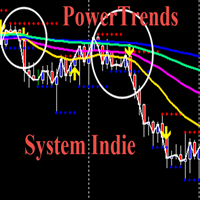
Power Trends System Indicator
Power Trends System Indicator is a custom indicator developed in line with a profitable trading system and it has been living up to its name.
It is a trending system carefully filtered to remove most of the downsides inherent in trend-following systems.
This is highly useful for those traders that are lazy to analyze the market but still want to make money from Forex market without stress.
The good news for any trader that comes across this system is that any t

An informational indicator that displays useful information on the chart, as well as notifies you about the occurrence of any event on the market.
Indicator shows:
Broker server time Trading symbol and TF Current profit in points, percent and in the deposit currency Time until the end of the current bar Current spread size
The indicator has an alert system that allows you to signal about any event on the chart:
Price move up or down Break of any level in any direction
Signals can come in t

Delta Channel is a trend indicator by which you can set take profit for buy and sell separately by adjusting the line for each of them. Entering the market by the EURUSD symbol must be done when the price deviates from the corresponding line by 30 points on the H1 timeframe, while the take profit should be set at the level indicated by the indicator (line level), at the same time we set a stop loss in points and an arbitrary trailing -stop pull it up.

Pivot Pro with Alert Pivot points offer very good brands that are often run over by price. At these brands, reactions of the price arise. They can be used excellently as target zones, or as entrances.
The alarm function allows several charts to be opened and it is very easy to find profitable entries.
No missed entries through notification on the mobile phone. You can watch the market with Alerts.
These settings can be changed:
Width of the alarm zone Colors of all pivot lines Colors of the
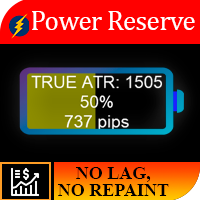
Lógica de trabalho A importância deste indicador reside no fato de que ele permite que você entenda quanto “ainda resta combustível no instrumento”. Imagine a situação, você saiu de um carro com a bateria meio descarregada, em média, essa quantidade de energia costuma ser suficiente para um carro por 250 km, então se você quiser não pode ultrapassar uma distância de 700 km. Assim, para cada instrumento, existe um certo movimento diário de preço e, como resultado de observações estatísticas, foi
Binary Options Assistant (BOA) COLD Signals Indicator provides signals based on Amalia Trader Binary Options Strategy. Indicators: Keltner & Stochastic
Stop missing trades, stop jumping from chart to chart looking for trade set-ups and get all the signals on 1 chart! U se any of the BOA Signals Indicator with the Binary Options Assistant (BOA) Multi Currency Dashboard . All BOA Signal Indicator settings are adjustable to give you more strategy combinations. The signals can be seen visually an
Binary Options Assistant (BOA) BURN Signals Indicator provides signals based on Ana Trader Binary Options Strategy. Indicators: MACD & Stochastic
Stop missing trades, stop jumping from chart to chart looking for trade set-ups and get all the signals on 1 chart! U se any of the BOA Signals Indicator with the Binary Options Assistant (BOA) Multi Currency Dashboard . All BOA Signal Indicator settings are adjustable to give you more strategy combinations. The signals can be seen visually and hea
Binary Options Assistant (BOA) CHILL Signals Indicator provides signals based on Katie Tutorials Binary Options Strategy. Indicators: 3 Moving Averages & RSI Stop missing trades, stop jumping from chart to chart looking for trade set-ups and get all the signals on 1 chart! U se any of the BOA Signals Indicator with the Binary Options Assistant (BOA) Multi Currency Dashboard . All BOA Signal Indicator settings are adjustable to give you more strategy combinations. The signals can be seen visual

Binary Options Assistant (BOA) Multi Currency Dashboard for Binary Options (MT4) .
You can use any of the BOA Signals Indicators with the dashboard. Just change the BOA Signals Indicator Name in the dashboard settings to the indicator you want to get signals from. For example: CHILL.
BOA_BURN_Indicator_v1 Strategy : Ana Trader Binary Options Strategy (MACD & Stochastic)
BOA_COLD_Indicator_v1 Strategy : Amalia Trader Binary Options Strategy (Keltner & Stochastic)
BOA_CHILL_Indicator_v1

Tract - Channel indicator, by which you can place orders like a classic channel indicator. Trading can be carried out inside the channel when the price reaches its borders and turns in the opposite direction from them. In such cases, reversal strategies are used. The channel indicator is designed to work with support and resistance levels and help traders find opportunities to enter the market. Another way to trade a breakout - assumes a situation when the price, upon reaching one or another cha

Um indicador de tendência baseado na quebra de níveis.
Apenas uma configuração permite uma adaptação muito rápida em um símbolo específico.
Este indicador é um indicador de não repintura.
Apenas para plataforma desktop MT4. Mobile PUSH. Alerta na área de trabalho. Alerta de email. Mostra setas para entrada na barra fechada.
Funciona em qualquer símbolo MT4 e em qualquer período de tempo.
Perfeito para novos traders e traders experientes.

Sting implements indicator technical analysis and allows you to determine the state of the market in the current period and make a decision on a deal based on certain signals. Sting is the result of mathematical calculations based on data on prices and trading volumes.
Sting creates signals to perform operations on strong trend movements; it is more expedient to use it for trading when the trend is weakening or sideways. It is used as an additional one, regardless of the phase of the trend mov

DAYTRADING apenas para AÇÕES (CFD's).
Negociar dá trabalho. Não há atalhos ou indicadores que dirão todas as entradas e saídas. O lucro vem do estado de espírito. Os indicadores são ferramentas a serem usadas em conjunto com a gestão do dinheiro e a psicologia do sucesso. Encontre desequilíbrios no perfil de volume. Desequilíbrios de volume de preços de comércio.
Muitos desequilíbrios acontecem no fechamento e na abertura e nas notícias. Veja os compradores versus vendedores em ações. Use em
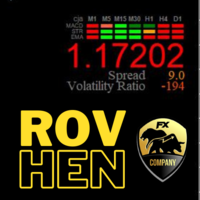
foi construído este indicador com algoritmo de negociação avançado com gerenciamento de risco adequado. ele usa um design maravilhoso para mostrar o resultado dos relatórios para (MACD, STR e EMA) para vários intervalos de tempo (M1, M5, M15, M30, H1, H4, D1). Esta técnica ajuda a mostrar o movimento do mercado de negociação que o leva a decidir comprar ou vender. É mostrar a você o aumento da moeda. Ele mostra a taxa de volatilidade para a moeda atual. É mostrá-lo na mesma tela "Saldo da conta"

About - Forex indicator. This trend indicator is used to determine the current trend in price movement, making it clear in which direction it is better to open a position: buy or sell. The About trend indicator is displayed on the chart and moves in parallel with the price. The Forex About trend indicator allows you to determine in time a change in the direction of price movement, thereby minimizing the likelihood of capital loss. In trading practice, various combinations of About and other ind

Channel indicator Control. A graphical tool that calculates the levels that form the channel and the moments of opening orders. Control has the ability to not only show tops and bottoms, fixing waves in the middle of its channel. This channel indicator is rather a cross between the ZigZag indicator and the real fractals.
One of the surest and most profitable online trading methods is mid-channel trading. In fact, this is the same trend, but it differs in a more pronounced fixation of highs and

The basic principle of working with trend indicators is to search for a market trend. The Sherlock indicator was created with this very purpose in mind. Many classics of trading in financial markets have developed their systems specifically to search for market trends. What is a trend? This is a certain direction of the quotes change. The trend can be up and down. In an uptrend, the price rises, and in a downtrend, accordingly, it falls. Basically, the Sherlock trend indicator does its job. The

Persona is a trend indicator.
Flexible settings of the Persona trend indicator allow you to receive more accurate signals for opening positions. Along with its advantages, it also has its disadvantages. These include the following:
Disadvantages.
While Persona shows the current market trend, it does not indicate when it will be completed. And even when such signals do arrive, they are too late in relation to price changes; Even despite the flexible settings, no one has yet been able to achie

Este indicador detecta um flat e pinta a área encontrada com um retângulo colorido.
A ideia principal deste indicador é detetar um flat quando o preço preenche uma determinada área no gráfico.
Parâmetros de entrada:
Color rectangle - cor do retângulo a ser sombreado.
Bars in rectangle - número mínimo permitido de barras num retângulo. Density in % - densidade do flat, definida como uma percentagem da área do retângulo.

Los retrocesos de Fibonacci son herramientas populares que los operadores pueden usar para dibujar líneas de soporte, identificar niveles de resistencia, colocar órdenes de stop-loss y establecer precios objetivo. Un retroceso de Fibonacci se crea tomando dos puntos extremos en un gráfico de acciones y dividiendo la distancia vertical por las razones clave de Fibonacci de 23.6%, 38.2%, 50%, 61.8% y 100%. El indicador de herramientas de Fibonacci dibujará herramientas de Fibonacci, p. Ej. Retroc
Moving average, moving average (English Moving average, MA) is a general name for a family of functions, the values of which at each point of determining the level of some average value of the original function for the previous period.
This indicator is suitable for those who are interested in the classic calculation method but with improved functionality. There is a version for both MT4 and MT5.
Moving averages are commonly used in time series data to smooth out short-term fluctuations and

Implements a channel based on the moving average indicator with improved functionality.
Moving average, moving average (English Moving average, MA) is a general name for a family of functions, the values of which at each point of determining the level of some average value of the original function for the previous period. The channel moves up and down relative to the moving average by a specified number of points.
This indicator is suitable for those who are interested in the classic calcul

Implements an oscillator based on a simple comparison of the last two moving average values with improved functionality. As a result, the graph displays the delta of the two moving average values. In the case of a single value, the moving delta is calculated relative to the last two candles, which price of comparison will be specified in the Price parameter. The delta of two values is often used to determine the trend, depending on the length of the moving averages, it can be a longer or sh

Implements a channel based on integrated comparison of moving average values with improved functionality. As a result, the chart displays a channel of deltas of moving averages in the center line and an indentation of the channel boundaries over a specified range.
What is the channel? This is the price range (limited), in which all its dynamics (movement) takes place over a certain period of time. This method is very old, the Forex channel strategy dates back to a long time, when the theory

The Pivot Dashboard is a multicurrency Dashboard that indentifies the Pivot prices and tells the user if they were tested or not. With this Dashboard you will be able to change (Symbol/Timeframe (M15,H1,H4)) immediately with just one click. It is also possible to visualize the Pivot Price clicking on the Pivot Button. The Dashboard can also be Minimized and Closed.
IMPORTANT ALL SYMBOLS THAT THE USER PUTS ON THE DASHBOARD MUST ALSO BE IN THE MARKETWATCH:
With the new Feature,that were added
Bollinger Bands (BB) are similar to Envelopes. The difference between them is that the boundaries of the Trade Bands (Envelopes) are located above and below the moving average curve at a fixed percentage distance, while the Bollinger Bands are plotted at distances equal to a certain number of standard deviations. Since the magnitude of the standard deviation depends on volatility, the bands themselves adjust their width: it increases when the market is unstable, and decreases in more stable per
The avatar indicator is one of the most powerful current indicators in the forex and binary options market. The indicator works on all pairs and all time frames, and the indicator has certain conditions in order to avoid loss and achieve 95% profits from it. The conditions are: Avoid volatility markets Avoid flat and casual markets I work in the trend markets, the market is moving in a trend, and you are able to determine the direction of the trend, where is it Make time for yourself to work in,
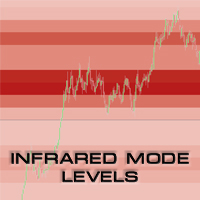
UPDATE 3 - Scan what you see - the indicator will scan and draw levels for all VISIBLE bars on the chart, rather than Current Bar - till first visible bar on the chart (historical bar on the left side). Assumption is, if you are going back in history and you want to check levels, you care about that specific moment in time and what the levels were during that moment (excluding data of the future which is not visible). UPDATE 2 - version 2.1 introduces the "Always ON" feature. If enabled, you ca

The indicator determines the trend and draws arrows in the direction of the transaction.
Non-repaint!
By default, the recommended parameters are set, provided that the H1 timeframe is used.
Period parameter is the main parameter that calculates the arrows.
Frequency parameter is responsible for the frequency of signals.
Bars of calculating parameter is responsible for the number of bars on which the arrows are displayed.
It is recommended to adjust the indicator for each pair and period

The indicator determines the strength of the trend and its possible reversal points, based on the author's arithmetic approach .
Each new peak or trough is a trend development. Such peaks and troughs are numbered so that the strength of the trend development can be seen. Attempts to change the trend are also numbered. This gives an understanding of a possible change in the direction of the trend. Indicator signals are generated when trying to change the trend .
In the settings, it is possible

The QRSI indicator is one of the most important and well-known indicators used by traders around the world. By its nature, the QRSI indicator is an oscillator, that is, it fluctuates in a certain zone, limited by the maximum (100) and minimum (0) values. Specifically, this indicator works according to an accelerated algorithm, but this is not its only difference. This indicator implements a more advanced calculation based on the Relative Strength Index algorithm. The peculiarity of the implemen

Moving average, moving average (English Moving average, MA) is a general name for a family of functions, the values of which at each point of determining the level of some average value of the original function for the previous period.
CalcPipsOn - In order to add rozruhunok on the chart, you must activate this field.
The previous development of a variant of this indicator differed in that it had an extended functionality for calculating averaging in the set, as well as advanced possibiliti

The indicator checks the trend and draws arrows in the direction of the transaction.
Recommended parameters are set by default.
The Signal mode parameter is responsible for confirming the signal. Live - signal without confirmation On bar close - confirmation signal after closing the current candle (non-repainting)
The indicator is designed for any pairs. Recommended pairs:
EURUSD, AUDUSD, USDCAD, USDCHF, USDJPY, NZDUSD, GBPUSD

Индикатор содержит 3 RSI с возможностью выбора рабочего таймфрейма, периода и параметра сглаживания каждого. Не перерисовывает начиная с 1 бара. При задании параметра сглаживания большего 1 показания будут обработаны специальным образом, для исключения мелких колебаний. Возможно использовать в качестве готовой торговой системы, где показания старших ТФ определяют тренд, а младший используется для поиска точек входа, в качестве примера может служить система Дмитрия Брылякова https://www.infoclub
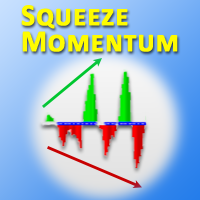
This is the MetaTrader version of the very popular Squeeze Momentum indicator. It is based of of John Carter's TTM Squeeze volatility indicator, as discussed in his book Mastering the Trade. With this version you can enable notifications when a squeeze is released (push notification, email, or pop-up message). Strategie
Grey dots indicates a squeeze in the current timeframe. Blue dots indicates that the squeeze is released. Mr. Carter suggests waiting till the first blue dot after a
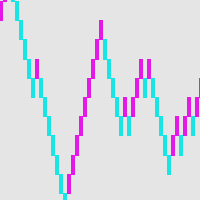
Diagrama de tijolo - uma forma alternativa de negociação Se você é um trader que está confuso com as velas em inúmeros gráficos, ou não sabe como desenhar linhas ou como desenhar linhas de suporte e resistência, você deve encontrar outro método de negociação que seja adequado para você neste momento. Assim como um driver pára para uma revisão completa depois de encontrar problemas repetidamente, o mesmo é válido para uma transação. O gráfico de blocos fornece um método de negociação simples para
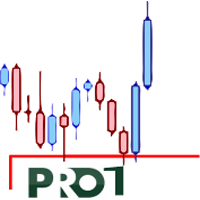
This indicator gives you a valid level The rules of trading with this indicator are like the rules of price action This level is broken only with a long bar candle or a pullback This level is valid in all time frames If you have a sharp downward or upward trend, the trend will end when the price reaches this level This is my first indicator that I put in the store and I will put some very professional indicators soon
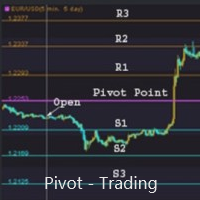
支点交易 : 1.pp 支点 2. r1 r2 r3 , s1 s2 s3 交易实用必备工具指标 波浪自动计算指标,通道趋势交易 完美的趋势-波浪自动计算通道计算 , MT4版本 完美的趋势-波浪自动计算通道计算 , MT5版本 本地跟单复制交易 Easy And Fast Copy , MT4版本 Easy And Fast Copy , MT5版本 本地跟单复制交易 模拟试用 Easy And Fast Copy , MT4 模拟账号运行 Easy And Fast Copy , MT5 模拟账号运行
支点( pivot points) 作为一种交易策略已经很长时间了,最初是场内交易员使用这种方法。使用这种方法通过几个简单的计算就可以了解市场在一天中的去向。 支点法中的支点是一天中市场方向的转向点,通过简单地计算前日的高点、低点和收盘价,可以得到一系列点位。这些点位可能形成关键的支撑和阻力线。支点位,支撑和阻力位被统称为支点水位。 你所看到的市场每天都有开盘价、高价、低价及收盘价(有一些市场是 24 小时开盘,比如外汇市场,通常用 5pm EST 作为开盘和收盘时间)。这些信息

BEHOLD!!!
One of the best Breakout Indicator of all time is here. Multi Breakout Pattern looks at the preceding candles and timeframes to help you recognize the breakouts in real time.
The In-built function of supply and demand can help you evaluate your take profits and Stop losses
SEE THE SCREENSHOTS TO WITNESS SOME OF THE BEST BREAKOUTS
INPUTS
MaxBarsback: The max bars to look back
Slow length 1: Period lookback
Slow length 2: Period lookback
Slow length 3: Period lookback
Slow

Este indicador é apenas para gráficos XAU/USD de 1 minuto. Cada par tem características e movimentos de preços únicos.
Negocie reversões em forma de V com este indicador. O couro cabeludo compra usando stops móveis e evita notícias, pois elas são mais extremas e podem causar vendas repentinas.
Anexe a um período de tempo de 1 minuto no backtest e veja as compras de reversão. O indicador nunca redesenha ou recalcula.
NEGOCIAR APENAS DURANTE O HORÁRIO DE ATIVIDADE

The Golden Target Indicator is a forex trading tool that displays important market levels on the charts. These levels include: buy and sell areas, overbought and oversold levels, extreme levels, reversal levels and middle level. The price will most likely react at these levels so plan your forex trades accordingly. The Golden Target Indicator fits all kinds of timeframes and currency pairs. It is displayed directly on the main trading chart. The default settings can be modified directly fr

This is based on short term strength or weakness and not on moving averages. Moving averages are used for filter only. Trade supply and demand with arrows. Supply and demand breakouts and strength of the buyers or sellers . Don't trade buy arrow to sell arrow. Trade the strength with trendlines or moving averages and use stops. The arrow can have some strong moves. Trade on all time frames. Try it out in the back tester. The pips can be made with this indicator, follow the arrows and make

SharpEntry version 2.3 - Adjust signals for each Timeframes structure.
- Allow to attach the indicator only Timeframes M1, H1, D1 for a better detection of the signal.
- Resolve a little repaint on a current price.
SharpEntry version 2.0 - Support trending mode.
- Increase arrow size.
- Fix arrow icon floating after switch Timeframe.
Como funciona?
- O indicador fornece um bom ponto de entrada.
- Está trabalhando com todos os prazos.
- O indicador desenhará o sinal de seta para compra e

[ How to use the Demo version ] [ MT5 Version ] AO unpaid divergences MT4 AO unpaid divergences is the first indicator developed to detailed analyze Regular and Hidden Divergences. It uses this analysis to find out possible entry points and targets. Below some of the characteristics of this indicator: Time saving Highly customizable Working for all pairs (Crypto, Forex, Stocks, Indices, Commodities...) Suitable for Scalping or Swing trading Possible reversal swings Alerts and Notifications on

this indicator is the way to get success entery point it give you the movement of market this indicator build base on Artificial intelligent of mix algorithms
work on all time frames and all pairs important thing you need to take alook on the signals on high time frame then apply the signals of lowest time frame (always take the first Arrow after close the candle on the chart )
example if you want enter order on H1 time frame go take alook on D1 time frame and see the signalsit will tell

Market structures, Market balance, Range breakouts This tools helps to identify areas of market ranges, structures and plots colored boxes on breakout of those areas. User is given the option to receive alerts and notifications on the formation of the blocks. The tool has the ability to become an essential part of a technical trading system or even pure price action trading. Usage:- An essential tool for price action or technical traders. More information in the blog

Horizontal volume bars, Cluster analysis, Volume profile Volume in Range gets information about the accumulated volume in a specified vertical range and period in bars. The received data is then plotted on the chart as rectangular boxes with the volume quantity inside. Usage:- The tool acts as a support resistance levels but most importantly it should be used to check in which direction the price breaks out of the significant levels formed by this indicator and then actions to be taken on correc
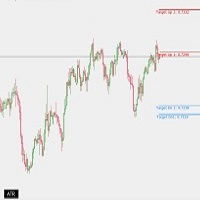
ATR Level button An helpful utility with a button to Show/Hide ATR Levels.
Configurations: https://ibb.co/2j9fTGL - ATR Period: The Length of ATR to calculate - Choose Color for R1/R2: Line color for each probability Resistance Level - Choose Color for S1/S2: Line color for each probability Resistance Level - chart btn_corner: Choose the corner of the button to appear - Button Text: Caption of Button - Button Font/Size: configure Font and size of button text - btn_background_color: Background
multi timeframe moving average indicator will give you the right Direction of the market on the higher time frame according to the setting of moving average (Displays a higher timeframe moving average on a lower timeframe chart) MA Timeframe should be greater or equal to the chart timeframe working on all pairs and on all timeframe you can use it in scalping or intraday or swing
Candle Arrow indicator give you the power of the candle when you see the Arrow on Chart that mean a price Action will happen soon so important thing you must draw the supply and demand area on the chart and the wait the Signal Appear with Candle you must wait until candle close and i advice you take look on higher timefram then back to smaller timeframe it will give you a good entry point

Forex Indicator Price Movement Level with Trend Alerts. This indicator will write value degrees of the latest position of price at the current Timeframes according to the Daily price movement, and when position and condition of trend status was changed the indicator will give an alerts. you can depend on this indicator to take order with strong entry point and good level of movement

Ing (inguz,ingwar) - the 23rd rune of the elder Futhark ᛝ, Unicode+16DD. Add some runic magic to your trading strategies. The correct marking of the daily chart will indicate to you the successful moments for counter-trend trading. Simple to use, has high efficiency in volatile areas. Be careful in lateral movements.
Signals ᛝ are generated when the main lines of construction intersect.
Red arrow down - recommended sales
Blue up arrow - recommended purchases
rare purple arrows indicate exce

The Driver trend technical indicator is used to analyze price movements in the Forex market. It is included in the so-called arrow indicators. And it is very practical in that it forms arrows in places where buy signals appear, or, conversely, sell signals.
The indicator helps to analyze the market at a selected time interval. He defines the mainstream. The Driver trend indicator makes it possible to classify the direction of price movement by determining its strength. Solving this problem hel

The Others indicator is a trend-type indicator. In those moments when you need to make a decision to enter a position and give the trader a direction. The indicator gives the trader the opportunity to visually determine which trend will be present at a particular time interval. These are auxiliary tools for technical analysis of the market. Recommended for use in conjunction with any of the oscillators.
The main application of the Others indicator is to generate buy and sell signals. Determini

Signal Finding is a trend indicator, a technical analysis tool that helps to determine the exact direction of a trend: either an upward or a downward movement of the price of a trading instrument. Although these indicators are a little late, they are still the most reliable signal that a trader can safely rely on. Determining the market trend is an important task for traders. With this indicator, you can predict future values. But the main application of the indicator is to generate buy and sel

The Spurts trend indicator is used to determine the strength and direction of a trend and to find price reversal points.
The trend can be ascending (bullish) and decreasing (bearish). In most cases, the trend grows for a long time and falls sharply, but there are exceptions in everything. The price movement can be influenced by economic and political news. A trend is a stable direction of price movement. To find it, the indicator uses calculations designed to smooth out sharp fluctuations that

Haine is a reversal indicator that is part of a special category of instruments. The indicator not only analyzes the price movement, but also indicates the points of possible reversals. This facilitates fast and optimal opening of buy or sell orders (depending on the current situation). In this case, the historical data of the analyzed asset must be taken into account. It is the correct execution of such actions that largely helps traders to make the right decision in time and get a profit.
Th

Signal Alien is a handy tool if you are used to trading on a clean chart, but sometimes you need to take a look at this indicator. That is, everything is as simple as possible, positions are closed in the opposite way, that is, as soon as a signal is received to open an order in the direction opposite to your position. For example, you opened a long position (sell), close it when a red arrow appears pointing down.
If you are not sure how to determine the inflection point of the trend and are c

I suggest that everyone who is interested in the Smoking indicator try to trade.
Smoking is a technical analysis tool that uses mathematical calculations to determine various aspects of price movement and is based on historical data. Smoking reveals special aspects of price movement and allows traders to make the right decision. All trading indicators analyze the price from different angles based on historical data. Therefore, it is not entirely correct to say that they can predict the future.

Master scalping with this indicator. Trade on any time frame for scalps on buy or sells. Follow trends using a 200 moving average and stops and targets. Use with your own system. This indicator can give pips if following it correctly. Stick to rules and pick up pips daily. Use as entries in a trend, scalp for a few pips or exit on opposite signal. Best to follow higher time frame trends. Indicator doesn't repaint or recalculate. Rules: Don't trade overnight, only trade during active sessi
O Mercado MetaTrader é a única loja onde você pode baixar um robô demonstração de negociação gratuitamente para testes e otimização usando dados históricos.
Leia a visão geral e opiniões de outros clientes sobre os aplicativos, faça o download para o seu terminal e teste um robô de negociação antes de comprá-lo. Apenas no Mercado MetaTrader você pode testar um aplicativo de forma absolutamente gratuita.
Você está perdendo oportunidades de negociação:
- Aplicativos de negociação gratuitos
- 8 000+ sinais para cópia
- Notícias econômicas para análise dos mercados financeiros
Registro
Login
Se você não tem uma conta, por favor registre-se
Para login e uso do site MQL5.com, você deve ativar o uso de cookies.
Ative esta opção no seu navegador, caso contrário você não poderá fazer login.