Conheça o Mercado MQL5 no YouTube, assista aos vídeos tutoriais
Como comprar um robô de negociação ou indicador?
Execute seu EA na
hospedagem virtual
hospedagem virtual
Teste indicadores/robôs de negociação antes de comprá-los
Quer ganhar dinheiro no Mercado?
Como apresentar um produto para o consumidor final?
Expert Advisors Grátis e Indicadores para MetaTrader 4 - 38
This is a MetaTrader 4 script. It helps to export all trades into a CSV file as per Symbol and selected periods.
Input Select Symbol: This is 2-option input. Select current symbol or all symbols to export its orders. Select Period: This is 7-option input. It includes Last Month, This Month, Last Week, This Week, Today, All History, and Date Specified. Specify Starting Date: Enter a date if you selected Date Specified in "Select Period" input. Specify Ending Date: Enter a date if you selected Da
FREE

The indicator monitors price movements in relation to a dynamic trailing stop line derived from the Average True Range (ATR). The trailing stop line adjusts based on market volatility, with the ATR determining the distance of the stop from the current price. This allows the stop to widen during periods of high volatility and tighten during calmer market conditions. The indicator tracks how the price interacts with this trailing stop line, marking potential reversal points when the price crosses
FREE

STOCHASTIC Dashboard Panel This indicator helps you to scan symbols which are in the Market Watch window and filter out a trend according to STOCHASTIC .
In technical analysis of securities trading, the stochastic oscillator is a momentum indicator that uses support and resistance levels. Dr. George Lane developed this indicator in the late 1950s.[1] The term stochastic refers to the point of a current price in relation to its price range over a period of time.[2] This method attempts to pre
FREE
This utility keeps a watchful eye on your trading terminals and ensures that you are notified if any of them are disconnected. Simply attach the utility to a chart and connect to a monitoring service who can notify you.
We use UptimeRobot for both VPS and terminal monitoring; however, any service supporting heartbeat monitoring can be employed.
Many such services offer free plans and various notification methods, such as Cronitor.io
FREE

White Crow Indicator
by VArmadA A simple yet powerful candle analysis based indicator using the White Soldiers & Crow patterns.
Works with timeframes 1H and higher and tested on all major pairs. Pay attention to the signal: An arrow indicating a long or short entry.
How It Works:
Arrows indicate a ongoing trend. After multiple bullish or bearish candles in a row the chances for another candle towards that trend is higher.
Instructions: - Crow Count: Set the number of candles that need to s
FREE
Vertical Lines for Hour - Time-Based Trading Indicator The Vertical Lines for Hour indicator allows you to mark up to 4 vertical lines at specific times on your chart. Simply enter the hour without considering the minutes, and you can also choose the color for each line. This indicator is useful for identifying session ranges or implementing custom trading strategies. It provides a straightforward solution for your trading needs. Key Features: Mark up to 4 vertical lines at specified times. Sele
FREE
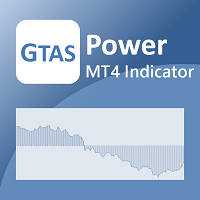
GTAS Power is a momentum indicator that helps to determine deep trends using combination of moving averages. This indicator was created by Bernard Prats Desclaux, proprietary trader and ex-hedge fund manager, founder of E-Winvest.
Description The indicator is represented as a green or red histogram around a 0 equilibrium line.
How to use When GTAS Power is green, deep trend is bullish. When it is red, deep trend is bearish. This indicator can be use as a filter in addition to other GTAS indica
FREE
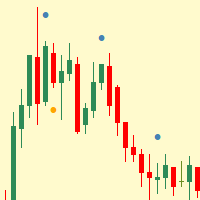
Simple indicator that shows internal (inside) bars.
Internal bars are probably one of the best price action setups to trade Forex with. This is due to the fact that they are a high-chance Forex trading strategy. They provide traders with a nice risk-reward ratio for the simple reason that they require smaller stop-losses compared to other setups. They can also be successfully utilised as reversal signals from key chart levels. Inside bar is a series of bars contained within the range of the co
FREE

This indicator is designed based on the Moving Origin indicator
When the moving origin indicator breaks the price, this indicator gives a signal
It is useful for better viewing of signals and analysis on them
Attributes: Can be used in all symbols Can be used in all time frames Too many signals Simple and quick settings Easy way to work
Settings: period: like moving average settings alarmShow: If you want to receive an alert in Metatrader after receiving the signal, enable this setting
alarmS
FREE

* EA capable of Trading 29 pairs from Single Chart * This is Photocopy of Samartha Expert Advisor https://www.mql5.com/en/market/product/48629 * Samartha Paid is fully automatic trading system... Samartha Test EA does not take trades... But it gives same signals as Samartha paid version * Please contact me by message or on whatsapp +919890059592 if you want to test Demo version on Demo Account for few days in live market. * Test Version is Like Non Trading Indicator for Testing Samartha Perform
FREE

The indicator is designed for intraday trading.
Equipped with all notification functions for convenience in manual trading.
It is recommended to use timeframes m5, m15, m30.
You can also view and select settings for any financial instrument. Settings: Indicator period - Indicator period Alert - The function of enabling alerts. Push notifications - Enabling Push notifications to the mobile terminal e-mail - Sending a signal to e-mail In addition to this product, I recommend looking at my othe
FREE

Expert Info: Pin = 0 --> Manual Trade" TralingStop = 0 --> Traling Stop Off " Sell & buy --> Open Order " C-All --> Close All Order" C-Buy --> Close Buy Order" C-Sell --> Close Sell Order Input Parameter: input Name_ = " ----- Gooinsta Army Simple ----- "; input Pin = 0.0; input Resiko = _Medium; input min_Lot = 0.01; input max_Lots = 1.0; input Slipage = 3; input double Target = 1050; input maxorders = 100; input TralingStop = 10; input End = " ----- Salam Profit Konsisten ----- ";
FREE

The M.O.D.E stands for " Multiple Oscillator Divergence Exit ". It is an indicator which signals a divergence between the price, and multiple oscillators. It is initially an exit indicator because it signals the weakening of a trend, but it could be used as an entry signal if used analytically Key Features: Check many divergences at once Non repainting Sends Alerts and Push Notifications You could load the M.O.D.E onto a single chart, and be able to see the divergences happening on multiple os
FREE
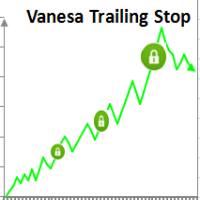
Setting Take profit (TP) to fixed level does not optimize your trade while using trailing stop requires traders to stay all time to screen. Vanesa Trailing Stop does trail stop by preset scenarios automatically. Vanesa Trailing Stop provides 3 (maximum) TP levels in points. For example: Level 1< Level 2 < Level 3. Traders provide value of trailing stop level for each TP level as parameters. Whenever total gain of a trade in points reaches the first TP level, EA will start doing trailing stop wit
FREE

Close All Orders for MT4 script - closes absolutely all orders, whether pending or market ones.
Orders are closed at the current profit/loss indicators at the time of closing.
The script is suitable for moments when you need to quickly close all orders at the current indicators.
The script is very easy to use, just drag the script onto the chart and it will do its job.
Add me as a friend, I have many other useful products.
FREE

This indicator calculates directly the value of the dollar index by using the ICE formula to plot the chart, this can help you as reference. You do not need your broker to provide the ICE DX to use this indicator, is a way to have it calculated. Little discrepancies could be found in the exact value of the candles or time due closing time of the trading floor and the use of decimals, but generally will give you good reference. You need your broker offers the feed for the following pairs in orde
FREE

Martingala Assistance, as its name says ... It is an assistant, an expert advisor that monitors all the orders for the asset in which it has been placed, no matter if that order was by some other expert advisor or by the trader placed on the Manually, he will start his work after each order that is negative.
See more products on: https://www.mql5.com/en/users/joaquinmetayer/seller .
FREE

This is a pending order closer, created to fulfill a made for MAC project. The EA originally could not be installed directly on the platform, and this is an attempt to install using this method. You can use it, but it might eventually be removed. You can also contact the original client and request their access. Unauthorized use is prohibited, and you are welcome to contact the developer or employer/client. Use it at your own risk.
FREE

Key Features: Trade Copy MT4 to MT4 . #forex #sharemarket #trading Disclaimer :- My videos, presentations, and writings are strictly for educational purposes and should not be considered investment advice. I cannot guarantee the accuracy of any information provided. It is essential to conduct your own research and consult a qualified financial advisor before making any investment decisions. I bear no responsibility for any financial losses or negative outcomes resulting from the use of my con
FREE
Hi Friends, This free indicator displays Tick chart on MetaTrader4 platform. Feel free to use it for Day trading or Scalping. Please give generous reviews and feedbacks for the product. All The Best!
Note: When this indicator is initially applied to a chart, it will not show any output. Once price starts moving then Ticks will start getting displayed. Thus when markets are closed, it won't have fresh ticks to display.
About us We are a small team of professional traders with experience in fore
FREE
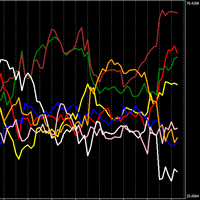
Indicador poderoso que mostra a força da moeda individual.
Quanto mais alta, mais forte é a moeda, vice-versa, quanto mais baixa, mais fraca é.
Estratégia de Negociação N1: Abrir posição em cruzamentos de linha, se um cruzar para cima e outro para baixo, abrir posição na moeda que está subindo.
Estratégia de Negociação N2: Abra posição comprando a moeda mais forte e vendendo a moeda mais fraca.
Nas configurações você pode alterar o intervalo de tempo, eu uso o padrão (TIMEFRAME 1 HOUR) e co
FREE

As médias móveis mudam em movimento. O indicador seleciona automaticamente o período para calcular as médias móveis. Quanto mais direcional o movimento, maior o período de média. Quando a tendência diminui, o período das médias móveis diminui e elas se tornam mais rápidas. Isso permite que você responda mais rapidamente a uma mudança de tendência.
O indicador funciona bem na tendência ou no ponto de reversão da tendência. Na parede lateral, o indicador pode ser usado ao contrário, por exemplo
FREE

Have you ever wondered which currency is the strongest at any particular time? Or which currency pair is trending the most. Well, the currency strength meter helps with just that. It compares USD , EUR , AUD , CHF , GBP , CAD and NZD depending on the timeline you have chosen in settings, and ranks them on the number of pips each has moved compared to the rest. N/B: All currency charts of the above pairs must have loaded. You can do this by highlighting all major and minor currencies
FREE
This is a free plug-in for Control-adora Expert adviser. It's main function is to create a Buy Stop arrow on the chart or a Sell Stop arrow when the price crosses above or below a trend line, which will allow Control-adora expert open a new trade when the desired lines will be crossed by the price.
Settings Prefix: Write here the prefix used to identify which trend lines are subject to be watched, value "Trendline" is set by default. Always use On Close Only: When set to true (by default) the c
FREE

Este Expert Advisor (EA) é como uma conta poupança de alto rendimento porque uma negociação ocorrerá em pares de moedas que pagam (ganham) juros durante a noite. As posições de entrada e saída são baseadas no período de lookback, preços mais baixos/mais altos e mais altos/mais baixos para ordens de compra e venda, respectivamente.
Entradas comuns,
SINGLE_CURRENCY = true, permite operações em uma única moeda, quando desabilitada (FALSE), negociará as moedas selecionadas na janela de observação
FREE

There are time periods in the market, when trading is highly likely to be unprofitable. This indicator warns you about such non-trading situations and helps you preserve your money and time.
Parameters Remind about non-trading periods: Expiration week - remind about the expiration week Consumer index day - remind a day before the release of Consumer index day NON FARM - remind a day before the release of NON FARM Christmas - remind a day before Christmas New Year Days 25.12 - 15.01 - remind abo
FREE
SafeMartin_VS_lite - an automated trading system optimized for EURUSD H4, but it can work on other currency pairs and timeframes. The Expert Advisor has a minimum of settings, which allows you to immediately put it into operation, without a lengthy procedure for selecting the optimal parameters. Several Expert Advisors are allowed to work in one terminal. Works with both 4 and 5-digit quotes. Not intraday! Not scalping! Designed for long-term trading. In the new version, the number of user s
FREE

MDG REBORN It is a fully automatic, high precision breakout scalper born from the reworking and improvement of Million Dollar Guru, which runs on M1 chart.
By identifying areas of overbought and oversold over very short periods in combination with the ENVELOPES indicator and AVERAGE REGRESSION, this system allows for very high long-term returns that are difficult to compare with other types of scalping.
Furthermore, through a series of internal calculations on the speed and pressure of pri
FREE
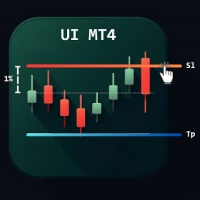
Esta ferramenta melhora sua experiência de trading no MetaTrader 4 com uma interface intuitiva e fácil de usar, projetada para otimizar a gestão de risco e agilizar o fluxo de trabalho. Principais características Ajustes gráficos : Altere Stop Loss e Take Profit diretamente no gráfico. Marcadores visuais : Setas no gráfico para analisar suas entradas após realizar operações. Gestão automática de risco : Calcula o tamanho da operação com base no percentual de risco definido. Painel de confirmação
FREE
ImpulseShield EA is here to say NO to trading decisions made on Impulse
Have you ever placed a trade based on an impulsive decision and regretted your action? What if you could have been able to avoid taking the trade? ImpulseShield is here to help you to only when it is right. The Free Version Only Supports EURUSD, GBPUSD and USDJPY, Here is the Full Version, Just $30 https://www.mql5.com/en/market/product/131505 Key Settings and Their Role
The EA uses the inputs defined earlier to determine
FREE

Recovery Zone Assistance, as its name says ... It is an assistant, an expert advisor that monitors all the orders for the asset in which it has been placed, no matter if that order was by some other expert advisor or by the trader placed on the Manually, he will start his work after each order that is negative.
This Expert Advisor is based on this sistem on video "Recovery Zone" on https://www.youtube.com/watch?v=DJz4E7VyeSw. See more products on: https://www.mql5.com/en/users/joaquinmetayer/
FREE

This is my first attempt of making an EA for AUD/USD. It is designed to be used on AUD/USD for 1hr chart. I'm putting it out for free for testing and feedback purposes. Depending on how it performs on live data I may sell for a price at a later date. Use at your own risk. It's quite a complex bot. I've attached backtesting data going back to 2003 for AUD/USD below.
It also has some potential on Nasdaq, EUR/USD and a few other markets, but less convincing.
FREE
Nombre del Indicador: Two Lines Color 1 Telegran:13 Crow Trading Club
Descripción: Este indicador personalizado para MetaTrader 4, "Two Lines Color 1", es una herramienta de análisis técnico diseñada para ayudarte a identificar oportunidades de trading en los mercados financieros. Este indicador utiliza dos Medias Móviles Simples (SMA) de diferentes períodos y las representa en el gráfico con dos líneas de colores distintos.
Las características clave de este indicador son las siguientes:
Rá
FREE
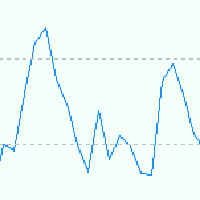
EA is based on Parabolic SAR and MACD indicator. if there are loss EA try to recover loss and fix position by placing another bigger order. Please test in strategy tester and let me know your feedback Suitable for Beginners No complex settings Just use EURUSD M5 time frame YOU CAN CONTACT ME FOR OPTIMIZATION Please leave the comment your like or dislike I will be happy to answer all kind of query related to this product... Please check in strategy tester and comment like or d
FREE
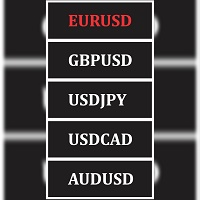
Seamlessly switch between different pairs from one window, while maintaining your current chart template across all pairs. This tools simply obtain all pairs in your market watch window and grant you the ease of switching between them from one window while maintaining your current chart setup and all loaded indicators and chart objects across all the pairs available in your market watch window.
FREE

NoLoser是根據信號產生器做出交易決定後再根據現有的資金量調整下單的單量 只支持不添加後綴名的歐美貨幣對使用
NoLoser設計目的希望所有參與交易的交易者,都能夠獲取合理的利潤 值得注意的是,過去的歷史回測匯或許會有相當大的利潤發生.但是將來的行情型態是不可知的.所以不要盲目地相信EA會創造出絕對的利潤,但也不要一昧地認為自動交易就是不可取的
特點 自適應的交易信號: 根據市場狀況自動調節信號產生的條件 自適應的單量計算: 根據現有資金狀況調整可以進場的單量.資金量高的時候,獲利隨之增加,反之資金量減少時,虧損隨之減少. 簡單的設定方式: 只需簡單的設定,調整信號的計算範圍即可.
啟動資金必須在2000美金以上 才能確保交易帳戶的安全
FREE
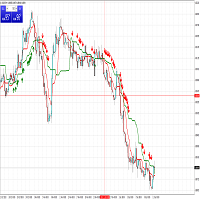
Two Advanced Moving Averages Are you looking for a indicator simple and effective? It will help you! Indicator use two MA to identify trends. User manual: If fast MA(red line) cross over slow MA (green line) and appear first signal buy arrow => you can long. If fast MA(red live) cross below slow MA (green line) and appear first signal sell arrow => you can short.
FREE

Telecontrol MT4 is a solution for integrating the MetaTrader 4 terminal with a Telegram channel. The server-based operation simplifies the creation of tokens and identifiers, consolidates data from multiple terminals, and generates valuable information in Telegram. The functionality includes: notifications about trades, orders, and balance changes; monitoring of drawdowns and lot limit exceedances; trade reports and expert advisor analysis; notifications about significant events with color highl
FREE

Cross Trend Lines indicator trend indicator of find. This indicator, an array of works by using a series of indicator and algorithm. Uses two lines to find trends. The intersection of this line means that the start of the trend. These lines are green, tend to rise. Red lines indicate the downward trend. Use of this indicator is easy to understand. This indicator on its own or you can use other indicators that are appropriate for the strategy.
Suggestions and Features Starts a new trend at the
FREE

Check my paid tools they work great and I share Ea's based on them for free please r ate
The Dual Timeframe RSI (Relative Strength Index) indicator is a novel trading tool that allows traders to monitor RSI readings from two different timeframes on a single chart. This dual perspective enables traders to identify potential trend confirmations and divergences more effectively. For instance, a trader might use a 1-hour RSI alongside a daily RSI to ensure that short-term trades align with the broa
FREE

The Rayol Code Hour Interval Lines indicator was designed to assist your trading experience. It draws the range of hours chosen by the user directly on the chart, so that it enables traders to visualize price movements during their preferred trading hours, providing traders a more comprehensive view of price movements and market dynamics. This indicator allows the user to choose not only the Broker's time, but also the Local time. This way, the user no longer needs to calculate local ti
FREE
Introducing the IT Stochastic EA, a powerful trading robot designed to harness the full potential of the Stochastic indicator. With an intelligently implemented grid strategy, this EA offers exceptional trading opportunities in all market conditions. Are you searching for a reliable tool to enhance your MetaTrader 4 trading performance? Look no further.
Advanced Stochastic Signal Taking The IT Stochastic EA leverages the Stochastic indicator to capture precise trading signals. Fully customizab
FREE

Comprar e vender sinais usando o histograma MACD. A interface é simples e fácil de entender. Você pode perzonalizar o indicador de várias maneiras de acordo com seu estilo visual ou, ainda mais importante, sua configuração de parâmetros para detectar sinais de mercado. Usando a opção Multiplicador no menu, você pode aumentar o período do indicador, embora seja recomendável usar as configurações padrão.
FREE

The Market Info is a universal indicator to show basic information about the market in a simple table on the chart.
Main features Displays current market information as: Symbol name Timeframe Price Spread Average daily range Current daily range Broker time Local time Market hours Date Remaining bar time
Indicator parameters All indicator settings are arranged in logical blocks for easy orientation and adjustment. You can set this features: 01: Main Corner - position on chart Left up Left down
FREE

Entry logic The EA, called EA_BreakTheBox, creates a rectangle BOX based on the highest and lowest price within a certain time period. Once the BOX is formed, the EA is ready for entry. It allows you to input the time period for forming the BOX, and you can set a time filter for the EA. The default setting for EntryPips is 2 pips, but this can be changed. If the price breaks the upper price of the BOX by 2 pips, then a BUY Entry is placed (if Reverse mode=true). If the price breaks the lower pri
FREE

Concept
Market arranges in Time upcoming Phases according to the present Results of its Interest. Directing Modulations are an Interaction of immanent Periods, which show in Reference to Time cyclic Activity and to Price leveling Activity. SensorMap is a reflecting Volume Mask of this Concept of Time and Price and apportioning developed Price Movements in an equalized 100 % - Range: how far moved ? indicating their Status by marking special Events: when which Action ? setting the Situation in a
FREE

Visão global O Expert Advisor envia notificações para um telefone celular, via e-mail ou ativa um alarme sonoro no caso da posição for aberta ou fechada na conta de negociação. O Expert não o negocia, ele só monitora sua conta e as ordens.
Lançando o Expert Advisor Para o Expert Advisor funcionar, coloque o arquivo NotifyMe_free.ex4 em terminal_folder/experts (provavelmente ele será colocado lá automaticamente). NotifyMe_free deve aparecer na seção Expert Advisors da janela do Navegador. Se não
FREE

The Time End bar by MMD is a simple indicator that shows the number of seconds remaining in the three selected intervals. According to the MMD methodology, the moment when a directional price movement occurs is important. This indicator allows you to use this relationship more effectively in Forex and Futures trading.
Functionality description:
Time Frame 1 Period - defining the first time interval Time Frame 1 Color - specifying the color for the first time interval Time Frame 1 Period - def
FREE
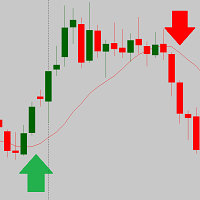
The script is based on the indicator Stochastic Oscillator.
The script draws up arrows or down arrows.
The tooltip arrows indicate the recommended price level.
The script can signal an alert, which also indicates the price level.
The script draws an up arrow when the Stochastic Oscillator lines go out of the oversold zone.
The script draws a down arrow when the Stochastic Oscillator lines out of the overbought zone.
Indicator signals are not filtered in any way - this is the classic Stocha
FREE

For traders, monitoring price movements is a constant activity, because each price movement determines the action that must be taken next. This simple indicator will helps traders to display prices more clearly in a larger size. Users can set the font size and choose the color that will be displayed on the chart. There are three color options that can be selected to be displayed on the chart.
FREE

"Forex Super Robot AIB is a free robot that anyone can easily trade with. By simply attaching it to the EURUSD H1 chart, your life will be rosy from today on. This robot was created to fulfill your dreams. Please enjoy. The robot will make multiple entries, with a default of 20 orders. These orders will be closed together. The initial settings are TP=50 and SL=50, so please find the best settings for yourself."
FREE
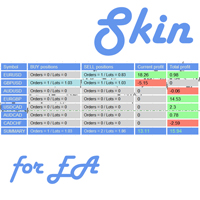
This utility is a graphical shell for other Expert Advisors that do not have their own graphical shell or whose graphical shell you do not like. Just run the utility on a free chart of any currency pair, specify in the input parameters the "Magic Number" of the advisor to which you want to connect the utility, and a graphical shell will appear on the graph, containing information about the traded currency pairs, current positions and trading results of your advisor.
If you like this utility, ta
FREE

THIS FREE INDICATOR ALLOWS YOU TO SET THE TIMEFRAME OF THE MA YOU WANT ON YOUR CHART For example, it's very useful if you want to trade the H4 200 SMA using a lower timeframe chart, to identify price reactions such as reversals, Wyckoff schematics, etc. ***Please comment, rate and share it to your friends if you like it*** ------------------------------------------------------------------------- Moving averages are popular technical indicators used to identify trends, support and resistance leve
FREE
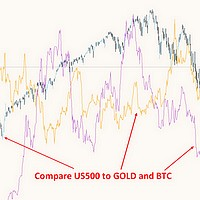
This free MT4 indicator allows you to easily compare as many symbols as you want! Make sure that the input symbol matches the name displayed in the Market Watch ***Please comment, rate and share it to your friends if you like it*** ------------------------------------------------------------------------------ Comparing trading pairs is useful for several reasons, including: Identifying relative strength: Comparing trading pairs can help traders identify which currency or asset is relatively stro
FREE
Trender EA - автоматическая система, в основе которой заложен принцип торговли по тренду. Сначала система идентифицирует направление тренда и после этого ищет точки для входа в сделку. Уровень стоплосс определяется автоматически, а тейкпрофит на основе рассчитанного стоплосса. Советник оснащён системой сопровождения сделки "От цели к цели" - системы способной брать несколько целей с частичным прикрытием сделки. Настройки: Параметр Описание ID EA Идентификатор ордеров советника Mode trade Режи
FREE

BeST_Chande RAVI (Range Action Verification Index) is an MT4 Indicator that is based on the corresponding indicator developed by Tushar Chande which is mainly based on market momentum while focuses on identifying ranging and trending markets.
By default RAVI is defined by the formula: RAVI = Absolute value (100 x (SMA(7) – SMA(65)). Also by default there is an arbitrary reference level of 3% that means a market is ranging if the RAVI is less than 3%, or trending strongly if it is is greater th
FREE

RaysFX StochRSI Presentiamo un indicatore MQL4 sviluppato da RaysFX, un rinomato sviluppatore nel campo del trading algoritmico. Questo indicatore è una combinazione semplice ma potente di due indicatori popolari: RSI e Stocastico. Caratteristiche principali: RSI : Un indicatore di momentum che misura la velocità e il cambiamento dei movimenti dei prezzi. Stocastico : Un indicatore di momentum che confronta il prezzo di chiusura di un titolo con la gamma dei suoi prezzi durante un certo periodo
FREE
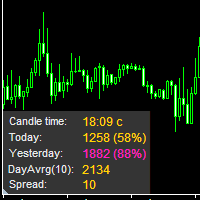
The information panel displays important trading information on the chart. Visual display of the information will help you to make a prompt and precise trading decision. Screenshots depict information which I use in my trading system. But you can add any other desired information. To do this contact me via MQL5 web-site. Displayed information: Time till the end of the current candle and formation of a new one. Time set format: hh:mm, if there is at least one full hour, or mm:ss, if you have les
FREE

Discover our all-in-one monitoring and notifications EA for MetaTrader. Designed to ensure traders’ security and peace of mind, this unique EA offers a full range of advanced features that will allow you to stay informed and control your account activity, anytime and anywhere. Key Features : Continuous server monitoring: real-time notification on server availability and performance (Cpu, Ram, disk), connectivity, latency and more Advanced account management: live tracking of margin calls,
FREE
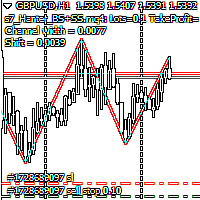
Script Hunting for the Channel Breakout The script is designed for semi-automatic trading. It can place required number of pending BuyStop and SellStop orders with preset StopLoss and TakeProfit levels in one go. The script calculates the channel width using the ZigZag indicator and places a grid of pending BuyStop and SellStop orders according to specified settings. The first pair of pending BuyStop and SellStop orders is placed at the specified distance from the channel's borders. This distanc
FREE
This indicator show the collision points of moving averages in a separate window. so we will have a solitude chart. "Contact support for assistance and Download ALL PRODUCTS FREE TRAIL VERSION"
Features indicator: Show alert in Meta Trade Send notification to mobile Adjustable 3 MA (Fast-Middle-Slow) Can be used on all symbols Can be used in all time frames
Attention, the application does not work in the strategy tester
You can download the Demo version on the comments page : https://www.mql
FREE

The Indicator automatically draws trend lines ( Support & Resistance Lines) when attached to any opened chart with any time frame. Button controls with on(green)/off(red) are provided to display the Support & Resistance lines of short, medium, long, very long, v.v.long trends. For ex: to display only short, long term trend lines, make sure that the short and long buttons are in green color and the remaining 3 buttons in red color. This free version works only with EURJPY pair. Please buy paid ve
FREE

Triple Exponential Moving Average ( TEMA ) is a moving average (MA) that gives the most weight to recent price data. TEMA is more reactive to all price fluctuations than a Simple Moving Average (SMA) or an Exponential Moving Average (EMA) or even a Double Moving Average (DEMA) and surely can help traders to spot reversals sooner because it responds very fast to any changes in market activity. TEMA was developed by Patrick Mulloy in an attempt to reduce the amount of lag time found in trad
FREE

DESCRIPTION: Introducing "RobAI": the asset you've been waiting for to conquer the EUR/USD market. Thanks to a skilled combination of the Ichimoku indicator and an array of EMAs, RobAI captures trading opportunities with finesse, offering exceptional profit potential. The facts speak for themselves: over 5 years of experience with a maximum drawdown of 59%, ensuring prudent risk management. Additionally, a 92% win rate on trades confirms RobAI's precision in its decision-making. Confidently capi
FREE

The Scaled Awesome Oscillator (SAO) represents a refined adaptation of the Awesome Oscillator, aimed at establishing consistent benchmarks for identifying market edges. Unlike the standard Awesome Oscillator, which records the variation in pips across different commodities, the only unchanging reference point is the zero line. This limitation hampers investors and traders from pinpointing specific levels for trend reversals or continuations using the traditional Awesome Indicator, a creation of
FREE

Velvet RSI is intended for use with the Velvet advanced ordering layer. It is a modified version of the RSI indicator provided by Metaquotes and all of the data it displays is accurate and verified, when it is detected by the ordering layer. In order to place orders with the Velvet RSI indicator, the ordering layer must be installed and running. Ordering from the Velvet RSI indicator requires that "Velvet Ordering Layer" ( found here ), version 1.0 or higher, be installed and running. When de
FREE

A pin bar pattern consists of one price bar, typically a candlestick price bar, which represents a sharp reversal and rejection of price. The pin bar reversal as it is sometimes called, is defined by a long tail, the tail is also referred to as a “shadow” or “wick”. The area between the open and close of the pin bar is called its “real body”, and pin bars generally have small real bodies in comparison to their long tails.
The tail of the pin bar shows the area of price that was rejected, and t
FREE

The indicator is based on the concept of price channels, which are formed by plotting the highest high and lowest low prices over a specified period of time. The Donchian Channel Indicator consists of three lines: an upper channel line, a lower channel line, and a middle channel line. The upper channel line represents the highest high over a specified period, while the lower channel line represents the lowest low. The middle channel line is the average of the two and can be used as a reference f
FREE
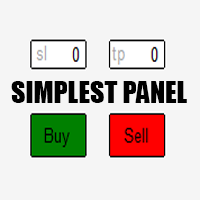
Just a simple panel that I created to make my trading life easier. Features: Buy and Sell with TP & SL right on chart Lot size is calculated by risk percentage Martingale - will open opposite position when SL hit (please don't enable unless you know what you are doing)
Will have more add-ons like Close-all button, Break-even, Trailing-Stop, etc. It's FREE so please leave your negative review somewhere else.
FREE
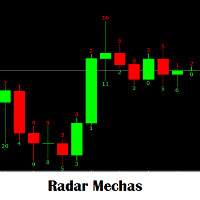
Indicador que serve para observar o tamanho do pavio que sai das velas de acordo com o tamanho que gera um alerta para fazer entradas manuais. Aproveite ao máximo que uma estratégia coloca espaços do tamanho do pavio da vela anterior ou da mesma vela atual. entrar para comprar e vender. É um indicador necessário para qualquer análise que seja feita para uma nova entrada. Será sua ferramenta favorita.
FREE
O Mercado MetaTrader oferece um local conveniente e seguro para comprar aplicativos para a plataforma MetaTrader. Faça download de versões de demonstração gratuitas de Expert Advisors e indicadores a partir do seu terminal para testes no Testador de Estratégia.
Teste os aplicativos em diferentes modos para monitoramento do desempenho e assim fazer um pagamento para o produto que você deseja, usando o sistema de pagamento MQL5.community.
Você está perdendo oportunidades de negociação:
- Aplicativos de negociação gratuitos
- 8 000+ sinais para cópia
- Notícias econômicas para análise dos mercados financeiros
Registro
Login
Se você não tem uma conta, por favor registre-se
Para login e uso do site MQL5.com, você deve ativar o uso de cookies.
Ative esta opção no seu navegador, caso contrário você não poderá fazer login.