Conheça o Mercado MQL5 no YouTube, assista aos vídeos tutoriais
Como comprar um robô de negociação ou indicador?
Execute seu EA na
hospedagem virtual
hospedagem virtual
Teste indicadores/robôs de negociação antes de comprá-los
Quer ganhar dinheiro no Mercado?
Como apresentar um produto para o consumidor final?
Expert Advisors Grátis e Indicadores para MetaTrader 4 - 15

SYSTEM DESCRIPTION: Cyber Capital TRADE HUB is support software for traders who wish to improve and speed up the opening, closing, and management of trades, as well as their own risk management. The system is developed for MT4 and allows you to open and close positions with fixed or automated lots based on percentage risk in one click. All the features of the dashboard are listed below. In addition to the normal functions of a trading dahsboard there is the ability to open manual trades with th
FREE
如果产品有任何问题或者您需要在此产品上添加功能,请联系我 Contact/message me if you encounter any issue using the product or need extra feature to add on the base version.
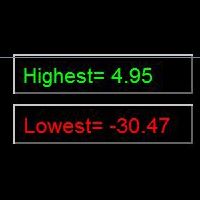
Indicator Floating Highest Lowest provides you an intuitive, and user-friendly method to monitor the floating highest (profit) and lowest (loss) that all your trades together ever arrive. For example, I opened 3 orders, which arrived at $4.71 floating profit when trade following trend. Later when the trend is against me, these 3 orders arrive $30 in los
FREE
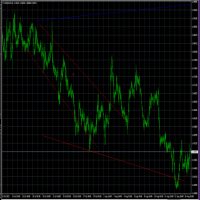
-It deletes all graphical objects on a chart. You choose the chart , then you execute the script on the chart. After the execution, all objects will disappear. Objects can be lines: trend lines, horizontal lines, vertical lines. They can be buttons, texts, labels , rectangles, edit boxes... parts of a panel. It executes fast within a second. You can use as many times as you want.
FREE

The EA in the form of histogram displays up and down trends. This tool is recommended to be used as a filter. Its readings will help to detect beginning, end, and continuation of a trend. This additional tool will suit any trading system. Parameters Period — indicator period; Bars — number of bars on the history.
FREE

Features:
Get OB/OS Levels from Golden MA Levels Wait for Buy/Sell Start Level Cross Optional: Should price cross Mid Level in earlier bars Optional: Crossing bar High/Medium Volume Optional: MA Stacked to check up/down trend for current TF Optional: NRTR higher timeframes aligned Check
Detailed blog post explained: https://www.mql5.com/en/blogs/post/758457
Levels with Buffers available here: Golden MA Levels Indicator: https://www.mql5.com/en/market/product/119515 Note: Arrows/Scanner do
FREE

TradingPanel X EA is a simple trading panel with some nice addons: Integrated News Feature Dynamic Take Profit Multiple Trade handling The EA has integrated dynamic Take Profit, this means, if you reach your defined TP it gives you the chance to follow on the Trend by dynamic TP & SL and extend your profits. Also a News Filter function is integrated. The EA working with real TP & SL not virtual.
Important:
Get informed about new Products, join our MQL Channel: https://www.mql5.com/en/chan
FREE
A quick indicator with simple settings that does not take up much space in the working window and is displayed as simply as possible. The indicator analyzes the divergence of the current closing price and the data obtained by smoothing the price series with two different (fast/slow) digital filters. The indicator allows you to clearly determine the medium/short-term trend and support/resistance levels at points where the trend direction changes. Indicator: does not redraw; has the ability to sen
FREE
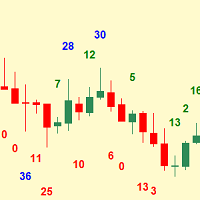
Simplest indicator for bar shadows. Very useful for Kangaroo Tail strategy.
"Shadows" - this is the distance from high and close of the bull bar and low and close of the bear bar. The purpose of the shadow is to show you if the bar is strong or not. Whether it is internal to the trend or is external. It even helps determine if a trend is starting. Input arguments: How many prevoius bars to calculate Value that should be passed to trigger the alarm How many times to repeat the alarm (Put 0 if y
FREE
Mastery CDS is a trend indicator based on the BB Mastery Technical Analysis. This Mastery CDS indicator is specially designed for the practitioner of BB Mastery Technical Analysis. This indicator helps you to setup BB Mastery Indicators and label all the CDS signals. The CDS signals including TRZ, CT, and CC. What is so special with this indicator? This indicator able to label TRZ, CT and CC signal all all time frames. You can one glance all the signals without spending time to identify each of
FREE
Introducing Austin RSI—an innovative indicator designed to elevate your forex trading strategy by applying moving averages to the MetaTrader 4 indicator, RSI.
The Relative Strength Index (RSI) is a popular momentum oscillator that measures the speed and change of price movements. It oscillates between 0 and 100 and is used to identify overbought and oversold conditions in the market. Traders often use RSI to gauge the strength of price movements and anticipate potential trend reversals.
Aus
FREE

The indicator improves the idea implemented in the standard Bulls and Bears indicator. The indicator colors candles by analyzing the divergence of the maximum and minimum prices of the current bar with the average value of the maximum and minimum prices over a longer period of time. The indicator does not re-paint on fully formed bars. The indicator is easy to set and efficient on trendy market segments.
Adjustable parameters: i_Period - smoothing period for forming the channel; i_Method - smo
FREE

With the SR Dashboard, you get a powerful tool to control some of the most important information in trading. Assemble a setup according to your strategy and get informed as soon as this setup is valid. Assign scores to defined conditions and let the Dashboard find them. Choose from Trend, Average Daily Range, RSI, Moving Averages, Pivot (Daily, Weekly, Monthly), Highs and Lows, Candlestick Patterns.
Note: This indicator is the free version of the Netsrac SR Dashboard. This version only support
FREE

Adaptive MA is a simple modification of the moving averages (MAs) that allows displaying an average value line based on multiple MAs on the chart. The parameters allow you to set any number of MA periods. The number of parameters is equal to the number of moving averages applied in calculation.
At first, it may seem that nothing new has been invented and there is no sense in this approach. However, this impression is deceptive. As we know, the trends have different duration. Have you ever tried
FREE

Com base na estratégia identificada em https://tradingstrategyguides.com/williams-percent-range-strategy/, mas automatizada para oferecer suporte a várias moedas de uma única instância de consultor especialista. Também usa os cruzamentos lentos e rápidos da SMA para determinar a direção da tendência.
A base para a estratégia externa é abrir uma negociação de COMPRA quando Williams %R cruzar o -50 em uma tendência de alta e abrir uma negociação de VENDA na tendência de baixa.
Você tem contro
FREE

Abiroid Multi Slope indicator allows you to calculate a Slope Histogram for any line of any indicator . Histogram is for 1 slope line only, but slope values can be calculated for 3 lines total. To have multiple histograms, add as many Slope indicators for custom indicators as you like on chart. You just need to provide the Indicator name, buffer value, slope's period and max number of bars back. By default it has slope calculation for TDI_v4.ex4 indicator. There is no way to specify parameters f
FREE

This indicator displays the moment when the DeMarker oscillator crosses its smoothed value. If the DeMarker oscillator crosses its smoothed value, it is a signal of a trend change. The signal is given after the end of the formation of the candle. The signal is confirmed when the price crosses the high/low of the bar on which the signal was given. The indicator does not redraw.
Custom Parameters: DeM_Period (>1) - DeMarker indicator period; MA_Period - period for smoothing DeMarker indicator va
FREE

The product combines the best features of the standard CCI oscillator with the adaptive digital filter. The indicator allows entering and exiting the market at the very beginning and end of a trend. The indicator generates high-probability signals while retaining high sensitivity. The indicator does not repaint on fully formed bars. Options: Ind_Price - price used for the indicator calculation; Ind_Period - indicator period. Application rules: A big red dot - a strong bearish trend, if the price
FREE

This indicator idea comes from Tushar Chande called Qstick.
Technical indicators quantify trend direction and strength in different ways.
One way is to use the difference between close and open for each bar and to sum it up over a period of time.
The formual is:
Qstick (period ) = Average ((close-open ), period )
In this indicator, we can choose how to calculate body by two famous chart types. The first and default indicator settings are based on Heiken Ashi chart, and the second i
FREE
The product combines the best features of the standard RSI oscillator with the adaptive digital filter. The indicator allows entering and exiting the market at the very beginning and end of a trend. The indicator generates high-probability signals while retaining high sensitivity. The indicator does not repaint on fully formed bars. Options: Ind_Price - price used for the indicator calculation; Ind_Period - indicator period. Application rules: A big red dot - a strong bearish trend, if the price
FREE
This indicator allows you to identify a long-term trend and shorter-term price fluctuations. Indicator signals are given only after the full formation of the bar. The indicator can be used to trade any market. The indicator showed the most interesting results on major currency pairs for time periods of one hour or more. Its basic parameters perform well in most situations. At the same time, before starting trading, you should choose the most effective indicator settings for the user's trading st
FREE
Painel de Controle UR
O UR Control Panel é uma ferramenta que quero compartilhar com você GRATUITAMENTE. É um painel interativo que me ajudou em minhas negociações e impulsionou minha análise de mercado a cada dia. Espero que atenda às suas necessidades também!
Como usar o Painel de Controle UR?
É um painel duplo móvel e redimensionável do qual: - Um deles mostra a força da moeda no período de tempo determinado - O outro permite que as opções se movam entre símbolos e prazos muito mais
FREE
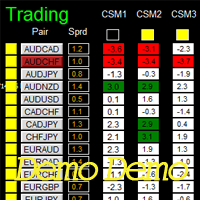
如果产品有任何问题或者您需要在此产品上添加功能,请联系我 Contact/message me if you encounter any issue using the product or need extra feature to add on the base version
Dashboard Super Currency Strength Demo is the demo version of Dashboard Super Currency Strength, which have full functionalities of the paid version, except only 1 currency strength meter with timefrme of M30 and H1 will be used for signal generation (full version has 3 currency strength meters with full timeframe selection). Please re-direct to LINK for
FREE

Introducing Force Jurik—a powerful indicator designed to enhance trading insights by combining custom moving averages based on Jurik with the MetaTrader 4 indicator, Force Index.
Jurik moving averages are renowned for their precision and smoothness, making them ideal for analyzing price movements in the forex market. They offer traders a reliable method of identifying trends and filtering out market noise, ultimately providing clearer signals for decision-making.
The Force Index, a popular
FREE
Индикатор Trender определяет смену тренда. Для того чтобы её не пропустить, настройте его на отправку уведомлений в ваш мобильный терминал (Push), или в виде алерта ( Alert ), или по Email. Также индикатор предоставляет потенциальные точки входа и расчитывает и отображает уровни стоплосс и тейкпрофит.
Преимущества: - Не перерисовывается - Может помочь в фильтрации сигналов в вашей стратегии - Работает на всех парах и таймфреймах - Прост в настройке - Даёт уже готовые сигналы для открытия поз
FREE

Free Version. This expert advisor is optimized for the USD/JPY forex value,It can be used for any forex currency by setting the values listed below. Its operation is based on a multi time frame moving average strategy, so it can be classified as a trend expert. When the trend has consolidated on one direction the algorithm buys or sells the currency pair. In the event of a trend inversion, there is a fixed stop loss, while the take profit is variable with the trailing stop function. For thi
FREE

This Expert Advisor alerts users when the price crosses the chart lines. Horizontal and trend lines can be processed. Number of lines is not limited. Parameters prefix of signal line – prefix for the names of the objects (lines) processed by the indicator. If left empty, all horizontal and trend lines are processed. price Mode – bid or ask. timeout – crossing alert timeout. number of repeats – number of crossing alert repeats. number of comment lines – self-explanatory.
FREE
RSTL dpl AM - (Referense slow trend line - detrended price line) indicator built on the principle of searching for discrepancies between the current real price and the calculated trend value. RSTL - a digital filter that calculates the reference line, the overcoming of which by the current price is considered a change in the long-term trend. Indicator signals: Small red dot - the price continues to fall; Small blue dot - the price continues to rise; Big red dot - the price starts to fall; Big bl
FREE

InpRSIshort =13; // RSI short InpRSIPeriod =34; // RSI long PeriodRs =0; //Price 0C 4HL/2 5HLC/3 mafast =13;//mafast maslow =65;//MAslow
Double line RSI sub graph index. The parameters are adjustable. The RSI lines with two different cycles can be used to observe the trend strength effectively. Meanwhile, a short period cross long period color column image is displayed below. When the cycle (Jin Cha) is on the short cycle, the color of the column map changes from the light green to th
FREE

Follow the trail of the comet to know the development of the trend. This indicator helps you to determine the evolution of the price depending on how these astronomical objects are shown in the chart. When the comet seems to stop, it opens its tails considerably and warns us of a possible change in trend. On the contrary, when it seems to get speed (looks thin because lines of tail are grouped) demonstrates safety and continuity in trend. The head or comet nucleus will show red or green accordin
FREE
The presented indicator allows you to visualize the direction of the trend while cutting off minor price fluctuations. The indicator's customizable parameter (Filter) determines the number of points for the current financial instrument that the indicator cuts off in the process of determining the trend. Despite its simplicity, the indicator can be useful for both beginners and experienced traders. The indicator marks trend reversal points and can send notifications of such signals to the termina
FREE
Introduction and Description The commodity channel index (CCI) is an oscillator originally introduced by Donald Lambert in 1980. Since its introduction, the indicator has grown in popularity and is now a very common tool for traders in identifying cyclical trends not only in commodities but also equities and currencies. The CCI can be adjusted to the timeframe of the market traded on by changing the averaging period. CCI indicator with different colors at levels 0, 100 and -100. The cross is a
FREE

Action Scanner is a market scanner. It’s yet another product in my "Can’t trade with out it" series. Do you want to know what is moving right now? Action Scanner scans your watchlist and opens the 10 currently most moving charts. You can chose between, most moving in points, most moving in your account currency(if you were to trade it with a standard lot size 1.00) and most moving in percentage. The standard version is a complete tool with no limitations. However the pro version has additiona
FREE

Free version of https://www.mql5.com/en/market/product/44606 Simple indicator to calculate profit on fibonacci retracement levels with fixed lot size, or calculate lot size on fibonacci levels with fixed profit. Add to chart and move trend line to set the fibonacci retracement levels. Works similar as default fibonacci retracement line study in Metatrader. Inputs Fixed - select what value will be fix, lot or profit (available in full version, lot is set on free version) Fixed value - value t
FREE

Price action Telegram is designed to follow the price while away from the trading terminal. There is no need to remember how the name of the currency is spelled correctly, those currencies on which expert is installed are available, because the trader does not jump aimlessly from currency to currency, he knows what he wants and what he is waiting for.
Through telegram, you can work with any timeframe and currency on which the expert is installed. You will always be aware of the market situati
FREE
A popular signal indicator marking buy/sell points. Recommended for use in conjunction with a trend indicator to filter signals. The indicator has only one adjustable parameter that determines its sensitivity, which greatly simplifies setting the indicator to the current market and the user's trading style. The indicator can be used to trade any market. Its basic parameters perform well in most situations. At the same time, before starting trading, you should choose the most effective indicator
FREE

This indicator displays the signals based on the values of the classic WPR indicator. The WPR indicator can be used for determining the overbought or oversold areas on the chart. Reaching these levels means that the market can soon turn around, but it does not give signal, as in a strong trend the market can stay in the overbought or oversold state for quite a long time. As with most oscillators, the signals are generated when leaving these areas. This indicator allows to display three types of
FREE
This is a free plug-in for Control-adora Expert adviser. It's main function is to create a Buy Stop arrow on the chart or a Sell Stop arrow when the price crosses above or below a trend line, which will allow Control-adora expert open a new trade when the desired lines will be crossed by the price.
Settings Prefix: Write here the prefix used to identify which trend lines are subject to be watched, value "Trendline" is set by default. Always use On Close Only: When set to true (by default) the
FREE

This is a trend following indicator that identifies optimal entry points in the direction of a trend with an objective stop loss to manage the trade. The indicator allows you to catch trend early and ride it. The Indicator draws resistance line as it detects an Uptrend and draws support line when it detects a Downtrend on the chart. When those levels are broken, that allows you to identify the Trend Direction and Momentum in the direction of prevailing trend which offers optimal entry points in
FREE

Using hotkeys, you can create graphic objects of different drawing styles and different colors on the active chart. You can change the formatting styles for graphics. You can choose default drawing styles, or set them in the advisor properties selection window. Going to the graph, when creating graphic objects, the color, line type and line thickness are selected automatically. Drawing styles for graphical objects will depend on the current timeframe where drawing will be performed. Please watch
FREE

Taxa de variação
Com base na fórmula, ROC = (Close[n] - Close[n-lookback]) / Close[n-lookback] * 100 para plotar a taxa de variação de uma ação de preço de par de moedas durante um período de retrospectiva e fornece duas variáveis globais, SYMBOL_ROC e SYMBOL_ROC_LOOKBACK, que representam o último valor da taxa de variação e a taxa de variação no período de retrospectiva anterior. Chamando o indicador usando a função iCustom, iCustom ( "Market/RedeeCash_Rate_of_Change.ex4" , Symbol (), 5 , 0
FREE
RTL Map (Reference Trend Line Map) - the indicator is based on a complex of digital technical indicators described in the article by Vladimir Kravchuk: " Digital indicators in the technical analysis of financial markets ". The indicator displays buy/sell signals on the price chart for such digital indicators of technical analysis as FTLM and STLM, as well as directly the lines of digital filters RSTL, SATL, RFTL, FATL. Signals are displayed on fully formed bars and are not redrawn. It is recomme
FREE

Introducing Austin Bands—an innovative indicator designed to enhance your forex trading strategy by applying moving averages to the MetaTrader 4 indicator, Bollinger Bands.
Bollinger Bands are a popular technical analysis tool that consists of a middle band (usually a simple moving average), an upper band (calculated by adding a specified number of standard deviations to the middle band), and a lower band (calculated by subtracting a specified number of standard deviations from the middle ban
FREE

Trend Panel Limited is an indicator that allows you to know the trend of a pair in a given timeframe using 2 moving averages. You can modify the period of the moving averages. Allows you to select which pairs you want to monitor in the input parameters. You also decide in what time period you want to follow up. In short, TrendPanel gives you the possibility of knowing the trend of a pair in a certain period of time without having to change the chart. Version limitations: You can only select 2 pa
FREE
This indicator displays the signals based on the values of the classic DeMarker indicator on the price chart. The DeMarker indicator can be used for determining the overbought or oversold areas on the chart. Reaching these levels means that the market can soon turn around, but it does not give signal, as in a strong trend the market can stay in the overbought or oversold state for quite a long time. As with most oscillators, the signals are generated when leaving these areas. This indicator all
FREE
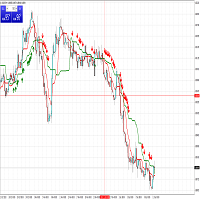
Two Advanced Moving Averages Are you looking for a indicator simple and effective? It will help you! Indicator use two MA to identify trends. User manual: If fast MA(red line) cross over slow MA (green line) and appear first signal buy arrow => you can long. If fast MA(red live) cross below slow MA (green line) and appear first signal sell arrow => you can short.
FREE

Binary Options Pal Studio is analytical tool for constructing a profitable Binary Options trading strategy, combining technical data and money management systems.
Features Most of indicator parameters are optimizable for best win rate or simulated balance, generating best possible outcome. Daily, hourly ITM statistics are displayed on interactive dashboard, every day of the week and hour can be switched to set up specific time patterns. Trade size, payout, spread and money management systems (
FREE

Pisces Expert Advisor for Demo Account test only. "You can lose all money in Forex Market and Stocks market, Please play safe."
***This Demo I made for everyone want to buy Pisces EA but want to test it on demo first, here you go.... Pisces EA Demo Expiry at Mar.1.2019 time 00:00
Full Version u can buy here. https://www.mql5.com/en/market/product/35098#!tab=tab_p_overview
This EA Better work with GBPJPY and USD Pairs. this Expert Advisor has a Scalping, hedging and trend following
FREE

The indicator accurately identifies a short-term trend both on trend and flat markets. The confirmation of the signal is the overcoming by the price of the high/low of the bar on which the signal was given. Signals are given on fully formed bars and are not redrawn. Calculations are based on the system of Moving Averages. The indicator is highly sensitive. Use it together with other technical analysis indicators.
Settings: Sensitivity - amount of bars for the indicator calculation (1 or higher
FREE
Digital filters are (simplified) a way to smooth data. Unlike traditional moving averages, a digital filter will be more effective in most cases. The presented indicator displays in a separate window in the form of a line the data of several (optional) digital filters built at different (optional) prices. The presented indicator is a simplified version of the Digital Filters AM indicator. The indicator does not redraw on fully formed bars. The indicator allows you to effectively follow the trend
FREE
The presented indicator displays a trend line and support/resistance line on the price chart. A change in the direction of the trend line indicates a change in the medium-term trend. A trend line above the support line is a buy signal. A trend line below the resistance line is a sell signal. Specific rules of using the indicator are set out in the comments to it.
FREE

Currency Strength Matrix (CSM) is an indicator that will show you the current strength of the major currencies in several timeframes allowing you to sort the currencies for strength and spot possible trading setups. This indicator is ideal for scalping and in all those events of sudden big moves. This DEMO only shows 4 currencies and 4 timeframes, for the full version please check https://www.mql5.com/en/market/product/24252
How does it work? The CSM compares the value of the current moving av
FREE

Introducing Demarker Jurik—an innovative indicator poised to revolutionize your forex trading strategy. This indicator combines the precision of custom moving averages based on the Demarker indicator with the MetaTrader 4 indicator, Demarker.
Jurik moving averages are renowned for their accuracy and reliability in analyzing price movements in the forex market. They offer traders smoother representations of price action, filtering out noise and providing clearer signals for identifying trends
FREE
The indicator allows you to simplify the interpretation of signals produced by the classical ADX indicator. The position of the thick bars of the histogram relative to zero and the histogram coloring indicate the direction of price movement determined by the intersection of DI+ / DI-. The position of the thin bars of the histogram relative to zero and the color indicate the strength of the price movement. A buy signal is generated when the price moves above the high of the last fully formed bar
FREE
This utility automatically draws the trend channel on the price chart. For the time interval from the specified date to the current bar, the drawn channel is almost optimal. Placing the beginning of the channel at a more distant historical price extremum, you get a visualization of a longer-term trend. Channel slope is not a continuous value, but takes one of discrete values (in AxB format, where A is the number of price points (points), and B is the number of timeframes). This program works
FREE

The indicator marks bars with a simple trend definition“ each subsequent high above/below the previous one and each subsequent low above/below the previous one ”. Charles Dow
Formula:
Max – The current maximum Min – The current minimum MaxK – Maximum per period MinK – Minimum per period Min>MinK & Max>=MaxK – Symbol on top Max<MaxK & Min<=MinK – The symbol on the bottom
Input parameter:
Number of bars in the calculated history Period for current timeframe The distance to the symbo
FREE
"The trend is your friend, until the end when it bends". The "Hexa MA" custom indicator is a trend following indicator. It uses 6 Moving Averages to spot the trend and follow, and also to filter the bad signals for the fast Moving Averages. The basic is simple, yet the strategy is powerful.
Recommended settings for the indicator : - Moving Average periods : SMA 5, SMA 10, SMA 20, SMA 50, SMA 100, SMA 200. - Timeframe : M15 is the default. But any timeframe can be used. - Currency pair : Since
FREE

The parabolic stop and reverse (PSAR) indicator was developed by J. Welles Wilder, Jr. as a tool to find price reversals which can be utilized as stop-loss levels as well as trade triggers. The notable difference about the PSAR indicator is the utilization of time decay. The PSAR indicator forms a parabola composed of small dots that are either above or below the trading price. When the parabola is below the stock price, it acts as a support and trail-stop area, while indicating bullish up t
FREE
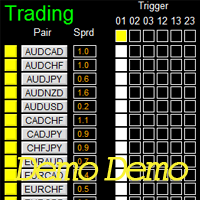
Dashboard Super Three MA Demo is the demo version of Dashboard Super Three MA, LINK , which have full functionalities of the paid version, except MA Time-frame is fixed at M5 Filter Single is not available This system basically utilizes PA and three adjustable Moving Average as the main indicator set to generate trading signal. With the feature that all MA_timeframe, MA_period, MA_applied_price are adjustable, you can easily create almost any Moving Average trading system with this dashboard and
FREE
The indicator analyzes the difference between the current price and the standard MA data. The indicator is not redrawn on the formed bars. To confirm the signal of the indicator, it is necessary to wait for the price to overcome the high (for buying) or the low (for selling) of the bar where the indicator changed color. The indicator is easy to use and configure. The indicator is effective as an element of any trend trading strategy. Custom Parameters: MA_Period - MA period; MA_Shift - MA shift;
FREE

ContiStat restricted - Free DEMO version of the ContiStat indicator
Free version of the indicator is ment as DEMO of full paid version. Full functionality is available, however The indicator work only on M30 chart period . Find the ContiStat indicator for full functionality
Brief description The ContiStat indicator calculate statistic frequency of green (up) and red (down) movement in the chart and determine movement dynamics (silver curve). There are two key parameters to understand the Cont
FREE
Technical analysis indicator described in the article by Vladimir Kravchuk: " Digital indicators in the technical analysis of financial markets ".
In the proposed version, the indicator provides two types of signals: 1. Zero crossing; 2. Change of direction. To use it effectively, it is necessary to take into account the long-term trend and open a position only in its direction. It is recommended to use signal confirmation. A signal is considered confirmed if the current price has overcome the
FREE

Tester BO and Tester Signal Bar is a script that allows you to test your trading strategies. The tester has two buffers with up / down signals. An example of use can be seen in the screenshots below. Using the indicator tester, you can achieve the maximum ratio of profitable trades for binary options. Improvement for forex is also planned. I wrote the idea at the very bottom in the “Planned work” group. You can filter your signals by the following data: 1- start date analyze. Interval (1 day, 7
FREE

If you like trading by candle patterns and want to reinforce this approach by modern technologies, this script is for you. In fact, it is a part of a toolbox, that includes a neural network engine implementing Self-Organizing Map (SOM) for candle patterns recognition, prediction, and provides you with an option to explore input and resulting data. The toolbox contains: SOMFX1Builder - this script for training neural networks; it builds a file with generalized data about most characteristic pric
FREE
This indicator displays in the form of an oscillator the difference between the maximum/minimum prices for the current period of time and the maximum/minimum price for a longer period. An increase in indicator values above zero indicates that the maximum price for the current period is greater than the maximum price for the period selected as an indicator parameter. This situation in most cases indicates an increase in the value of the asset. A drop in indicator values below zero indicates t
FREE

Supporting file (1 of 2) for T3 Cloud MA
Trend indicator derived from T3 moving averages. The cloud is bounded by a fast T3 and slow T3 lines. Buying/Selling opportunities above/below cloud. The fast and slow T3 MA lines can also be used as dynamic support/resistance for more aggressive entries. Use default values for best settings. The number of look back bars is user defined. This indicator can be used in combination with other strategies such as price action. Suitable for all time frames. P
FREE

Trend easy простой трендовый индикатор в виде гистограмы. окно индикатора разделено на две части верхняя гистограма движение в бай, нижняя гистограма движениие в сел. Кроме гистограмы, сигнал индикатора дублируется на графике стрелками. В меню индикатора имеется количество баров в истории индикатора
значения периода для определения тренда разрешение рисования стрелок на графике код и цвета стрелок алерты и отступ стрелок
FREE

IMP
The Panel presents a number of indicators in abbreviated form: 2 oscillators, 2 trend and 1 volume indicator. Location - upper left corner.
Indicators values and colors can be customized by the user. Combined with other market analysis, can greatly improve trading results. This Indicator is a suitable tool for beginners and professional traders as one.
Metta Trader 4 Indicator Version _1.0
FREE
REI Osc is an indicator that measures the rate of price change and signals overbought/oversold conditions if the price shows weakness or strength. The indicator was developed by Tom DeMark and described in the book Technical Analysis - The New Science. The indicator value changes from -100 to +100. REI is an improved oscillator as it attempts to remain neutral in a sideways trend and only shows signals when a significant top or bottom has been reached. Tom DeMark suggests using a default period
FREE
The Chart Navigator is a powerful and user-friendly indicator designed to enhance your chart navigation experience in the MetaTrader platform. With its advanced features and intuitive interface, it enables traders to effortlessly explore multiple timeframes, switch between symbols, and efficiently analyze price movements. Key Features: Timeframe Navigation: Seamlessly switch between different timeframes with just a single click. The Chart Navigator provides a graphical object that allows you to
FREE

This indicator is a system of channels based on the minimum and maximum price values. The task of the indicator is to visualize the trend direction and support/resistance lines. The indicator is designed to be used in combination with indicators of the "Signal" or "Candles" series (a lot of free indicators of this type can be found on my page). At the same time, the indicator can be used independently according to the following rules: Buy/Sell signals are used to open a position only in the dire
FREE
O Mercado MetaTrader é um site simples e prático, onde os desenvolvedores podem vender seus aplicativos de negociação.
Nós iremos ajudá-lo a postar e explicar como descrever o seu produto para o mercado. Todos os aplicativos no Mercado são protegidos por criptografia e somente podem ser executados no computador de um comprador. Cópia ilegal é impossível.
Você está perdendo oportunidades de negociação:
- Aplicativos de negociação gratuitos
- 8 000+ sinais para cópia
- Notícias econômicas para análise dos mercados financeiros
Registro
Login
Se você não tem uma conta, por favor registre-se
Para login e uso do site MQL5.com, você deve ativar o uso de cookies.
Ative esta opção no seu navegador, caso contrário você não poderá fazer login.