ZigZag Indicator with Trend Identification

MQL4 Indicadores

Trabalho concluído

Tempo de execução 2 minutos
Comentário do cliente
With commitment and patience

Termos de Referência

Hi,

i need an ZigZag Indicator which also identifies the higher trendlevels.

The ZigZag indicator should start at a reltive high or low. Relative high is where the previous high of a candle and the next high of a candle was lower, relative low same but the previous low and next low must be higher. There should be an input how many candles in the past the indicator should look for this, e.g. 100, means 100 candles back, if 102 fullfill the creteria of relative high or low, then start with this.

Once the first candle found, the indicator should paint the lines indicating an upward or downward movement.
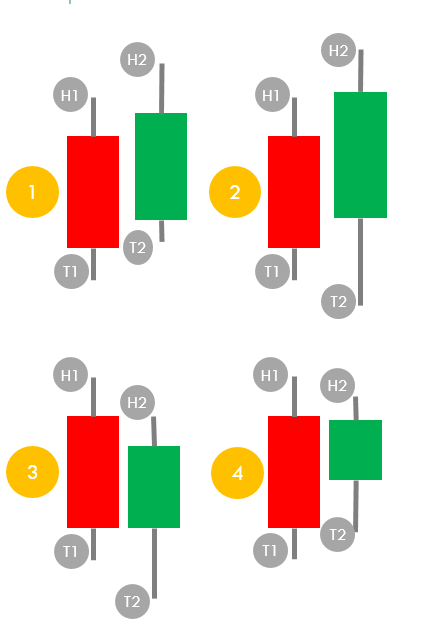
(1) Upward (2) cannot occur as there isnt a relative high or low (3) downward (4) neutral, wait for next candle

Once the initial movement is defined, all of the four situations above may occur. Lets assume there is an upward movement. (1) Continuing upward (3) turning from upward to downward (4) neutral, next candle, still upward .... what about (2)? its having higher high and lower low. Rule here: The existing overrules, if upward, then continuing upward when the candle body is long, if downward, continuing downward, WHEN the candle body is short, else turn.

On this lowest trendlevel the trend is defined. Its going up and down, creating 123 pattern. The next higher trendlevel only refers to the lowest trendlevel. As long the lowest trendlevel is in a downtrend, the upper trendlevel is in a downward movement, if the lowest trend is in an upward trend, the upper trendlevel is in an upward movement.

Ok but when the upward / downward movement of the upper level begin? When the lowest level starts an upward or downward trend by 123 pattern. Attention! When the lowest trend level breaks an upward or downward trend is the same as if a counter trend established.

Input is the number of historic candles. Outcome is the lowest trend level with lines, as per logic, it doesnt repaint. The upper level is painted based on the lowest trendlevel and will not repaint too.

Example
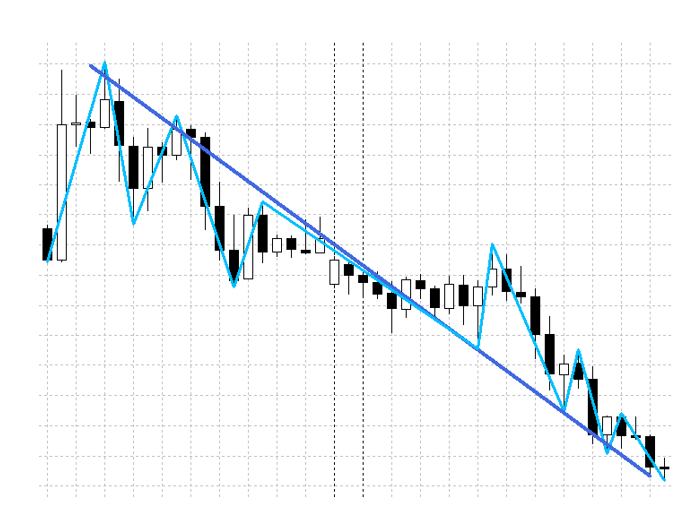
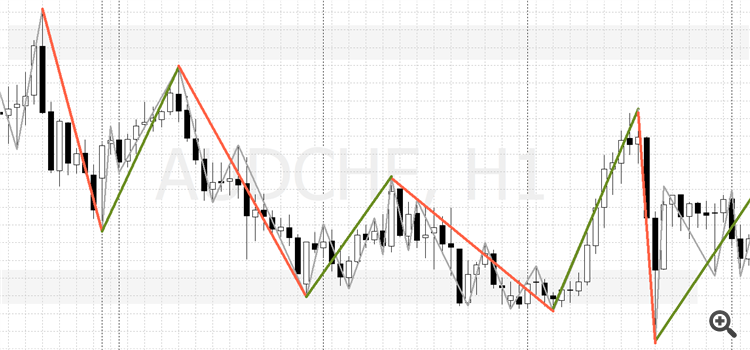
more examples grey line is lowest trend level, green and red are the upper trend


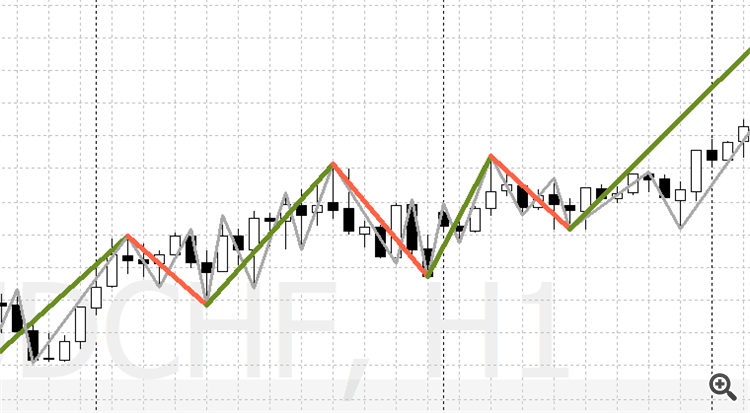
Another example for clarification,the lowest trend level (grey line) follows the highs and lows of the candles. Only the four situations explained above can occur. The upper trend level only follows the lowest trend level. You see how the trend breaks at the lowest level also defines upward or downward movements of the upper level. I have more examples if needed.


Respondido

1
Desenvolvedor 1
Classificação
(49)
Projetos
134
27%
Arbitragem
62
13% / 53%
Expirado
58
43%
Livre
2
Desenvolvedor 2
Classificação
(362)
Projetos
506
40%
Arbitragem
147
18% / 72%
Expirado
99
20%
Carregado
3
Desenvolvedor 3
Classificação
Projetos
0
0%
Arbitragem
0
Expirado
0
Livre
4
Desenvolvedor 4
Classificação
(128)
Projetos
236
65%
Arbitragem
30
37% / 23%
Expirado
49
21%
Livre
5
Desenvolvedor 5
Classificação
(586)
Projetos
1048
49%
Arbitragem
39
28% / 41%
Expirado
49
5%
Livre
6
Desenvolvedor 6
Classificação
Projetos
0
0%
Arbitragem
0
Expirado
0
Livre
7
Desenvolvedor 7
Classificação
(219)
Projetos
370
42%
Arbitragem
145
17% / 41%
Expirado
124
34%
Livre
8
Desenvolvedor 8
Classificação
(4)
Projetos
4
75%
Arbitragem
0
Expirado
0
Livre
Pedidos semelhantes
Connect from Mt5 via binary deriv account api I have mt5 indicator, need to connect with binary deriv account through api. If anyone can setup via API then contact me. everything control mt5
Hello I am looking for a developer to create an 50% retracement Indicator of the previous candle . So once a candle close the Indicator is supposed to take the full candle size from high to low and make a 61% and 50% level on that candle and I would like the candle to show until the next previous candle is done creating. After this I would look to create an ea with it possibly
Hi, I have 2 indicators which are based on the super trend , the alerts on indicator (1) does not work at all , and on the other indicator the alerts do not come on time on time, which is kind of delayed. see attached file below
Looking for an experienced developer to modify my existing TDI strategy , want to add filter for Buy and Sell Signals, Arrows are displayed on chart and what only to leave high accurate arrows Source code to be provided
I have the mq5 file, I need a buffer adding to the indicator, so it appears in the data window so I can reference it later in an EA. As the below screenshot shows, there is a median ray line from yesterday (the dashed horizontal line) - I want this value in the data window called Median Ray. I want this to be a single value per day, so todays Median Ray would be 17868, and so on each day. So I want all the Developing
I would like to develop my own indicator on metatrader 4 and tradingview. We would start with a basic version that we would improve later. It is an indicator based on several analyses and which would provide several indications. I am looking for someone who can develop on MT4 and Mt5, initially I would like to do it on mt4 and then on mt5. If you have expertise in pinescript it is a plus because I would like to
I urgently require swift assistance to convert a complex indicator into a fully functional scanner, capable of automatically sending real-time data, alerts, and notifications via email, ensuring seamless integration and prompt delivery of critical information to facilitate informed decision-making and timely action
I need to improve the code of an indicator that is too heavy and slow when running and when used with iCustom in an EA. No other changes to the indicator are requested: the original features of the indicator should remain as theay are. I'll provide the indicator after job acceptance. I request final source code mq5 file. Thank you Regards
I have a mt5 indicator that is working perfectly but I will like to make it an expert advisor to have an automated trade. I will be glad if I can get a well experienced developer to execute this project. Thanks
O TRABALHO CONSISTE NA MUDANÇA DO HISTOGRAMA DO INDICADOR TREDN DIRECTION AND FORCE DSEMA SMOOTHED PARA O HISTOGRAMA DA FOTO ANEXA, OBEDECENDO AS TRES CORES VERDE (UP, VERMELHOR(DOWN) E CINZA(TREND). O MESMO TEM QUE ODECER O MESMO CALCULO E COLORIR DA MESMA FORMA POREM COM HISTOGRAMA DDE FORMATO DIFERENTE

Informações sobre o projeto

Orçamento
100+ USD
IVA (19%): 19 USD
Total: 119 USD
Desenvolvedor
90 USD
Prazo
para 5 dias