Assista a como encomendar um robô de negociação
Leia as Regras antes começar a trabalhar
Como Encomendar um Robô de Negociação em MQL5 e MQL4
Consulte o exemplo de Termos de Referência para solicitar um robô
Novo na categoria:
30+ USD
30+ USD
Termos de Referência
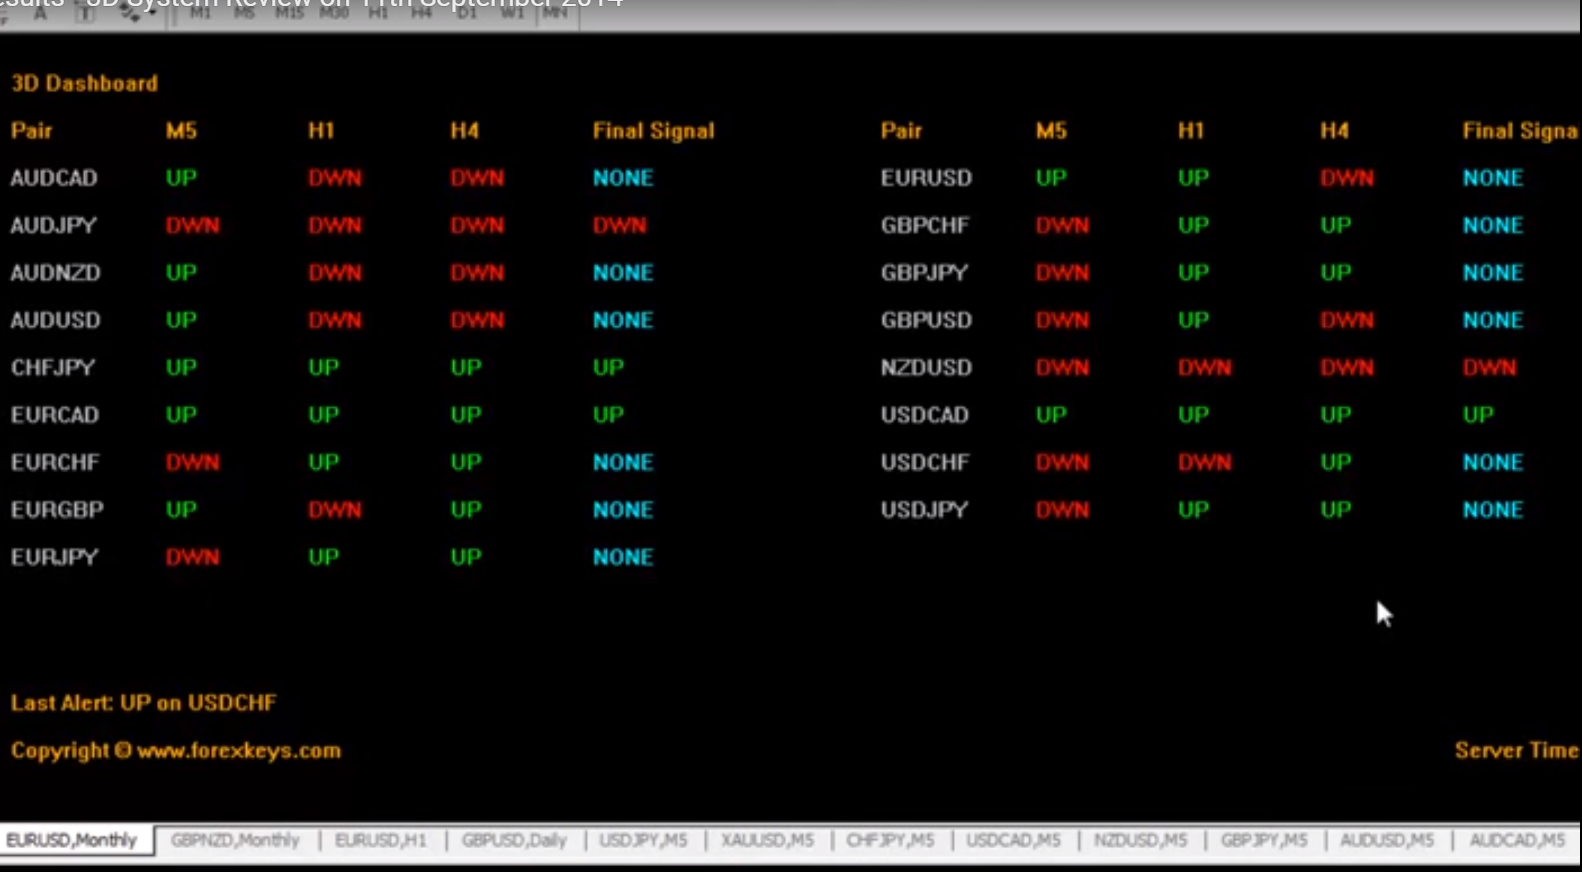
Hello Freelancers , i need a indicator to be made that uses the Moving avarage to show me if price is below or above it.
Indicator Requirements
- It should be able to show ALL time frames from min-1 till 1 month but should be OPTIONAL which timeframe want see on the chart.
- The moving avarage should be OPTIONAL what it should be SMA or EMA or Envelop.
- It should show ALL PAIRS but i OPTIONAL what pairs i want to see on the Chart.
- I need to see all of this in 1 Dashboard window.
- If its posible i want to see also want to see Pop up signal when the FINAL signal is DOWN
Image example Below.
Respondido
1
Classificação
Projetos
933
46%
Arbitragem
31
39%
/
29%
Expirado
93
10%
Trabalhando
2
Classificação
Projetos
369
66%
Arbitragem
10
50%
/
0%
Expirado
46
12%
Livre
3
Classificação
Projetos
1054
40%
Arbitragem
47
49%
/
23%
Expirado
84
8%
Livre
4
Classificação
Projetos
149
36%
Arbitragem
29
3%
/
55%
Expirado
35
23%
Livre
5
Classificação
Projetos
1033
44%
Arbitragem
50
8%
/
50%
Expirado
117
11%
Livre
6
Classificação
Projetos
1437
62%
Arbitragem
21
57%
/
10%
Expirado
43
3%
Trabalhando
7
Classificação
Projetos
162
40%
Arbitragem
20
15%
/
75%
Expirado
73
45%
Livre
8
Classificação
Projetos
156
44%
Arbitragem
22
41%
/
14%
Expirado
16
10%
Livre
9
Classificação
Projetos
19
21%
Arbitragem
1
0%
/
0%
Expirado
4
21%
Livre
10
Classificação
Projetos
341
58%
Arbitragem
7
14%
/
71%
Expirado
9
3%
Livre
11
Classificação
Projetos
1393
67%
Arbitragem
117
32%
/
42%
Expirado
215
15%
Trabalhando
12
Classificação
Projetos
367
56%
Arbitragem
45
22%
/
56%
Expirado
188
51%
Livre
13
Classificação
Projetos
73
16%
Arbitragem
13
8%
/
92%
Expirado
37
51%
Livre
14
Classificação
Projetos
370
42%
Arbitragem
145
17%
/
41%
Expirado
124
34%
Livre
15
Classificação
Projetos
4
25%
Arbitragem
1
0%
/
100%
Expirado
1
25%
Livre
16
Classificação
Projetos
140
46%
Arbitragem
19
42%
/
16%
Expirado
32
23%
Livre
Pedidos semelhantes
Modify indicator
30+ USD
Hello, everyone. I have a supertend indicator. I want to set candle color according to trend like attached image. If you have done it, I will give you more jobs. Thanks
I need an indicator, that displays fibonaccis drawn from ZigZag extreme to ZigZag extreme. The fibonacci levels included must be 0.0, 23.6, 38.2, 50.0, 61.8, and 100.0. For a Fibonacci drawn from ZigZag low (on left) to ZigZag high (on right), fibonacci 0 is at ZigZag low and fibonacci 100 is at ZigZag high. For a Fibonacci drawn from ZigZag high (on left) to ZigZag low (on right), fibonacci 0 is at ZigZag high
Programmer for ninjatrader 8 indicator
40 - 80 USD
STRATEGY : Here’s a comprehensive specification document in English for developing your NinjaTrader bid/ask imbalance indicator: --- ### Bid/Ask Imbalance Indicator for NinjaTrader: Full Specifications #### **Objective**The goal is to develop a custom bid/ask imbalance indicator for NinjaTrader 8. The indicator will calculate and visualize bid/ask imbalances in real-time and on historical tick data using Tick Replay
Master Pattern Indicator
30+ USD
Hello, I need a master pattern indicator. It is important that the lines of the indicator are generated for each candlestick, as there are also master pattern indicators where this is not the case. In the link is an example of a TradingView indicator, how the lines should be. It is also important that the lines are a buffer and I also need the source code. Here is the link
MT5 Indicator which Highlights HTF Wicks
30 - 50 USD
MT5 Indicator which Highlights Wicks Hi. I require an indicator which highlights the Wicks of a selected Time frame. So that even if I go to another time frame, the selected Time frame Wicks remain highlighted. For example If I select 'Weekly wicks' to be displayed, then if I got to a 4 hour chart, the Weekly wick area should remain highlighted. The Time Frame selections I want are: Monthly Wicks Weekly Wicks Daily
I need someone to code NinjaTrader 8 indicator
50 - 80 USD
Here’s a comprehensive specification document in English for developing your NinjaTrader bid/ask imbalance indicator: --- ### Bid/Ask Imbalance Indicator for NinjaTrader: Full Specifications #### **Objective**The goal is to develop a custom bid/ask imbalance indicator for NinjaTrader 8. The indicator will calculate and visualize bid/ask imbalances in real-time and on historical tick data using Tick Replay. It will
Convert tradingview indicator into tradelocker ea
80 - 100 USD
I would to develop a trading bot with some confluences I use TradeLocker Settings must be adjustable…… I am based in uk and very keen to move my strategy to trade automatically 1. Market Structure Break And Order block. By EmreKb 2. Rainbow Adaptive RSI By LuxAlgo 3. Multiple Moving Average using only 1 indicator By Myfye13 4. Average True Range Trailing Stops By HPotter we have to combine this four indicator into a
Preciso de um orçamento. Conversão de estratégias do TradingView para uso em MQL5. Todas são estratégias abertas, porém, não consigo contato com o desenvolvedor. 🔑 Principais recursos: - 🛠 Configurações personalizáveis do PSAR: ajuste o ponto inicial, o incremento e os valores máximos do PSAR para adaptar o indicador à sua estratégia. - 📏 Padronização: suavize a volatilidade padronizando os valores do PSAR
I am looking for an experienced MQL5 developer to build a custom indicator that displays retail stop-loss (SL) clusters on the chart. This indicator should integrate with an external data feed (preferably free, though I’m open to a paid solution if necessary) to show the order book of retail traders, highlighting where stop-losses are likely positioned. The goal is to use this information for entry and take-profit
Hello, i would like to have a fix on my plotted lines I use a liquidity strategy on the 1 hr time frame but the indicator that i am using for plotting the 1 hr lines is having a issue and printing the plot lines all over the place on the current 1 and 4 hr plot line as you can see in the screenshot this is very disturbing while i am trading can u fix that or just remove the current 1 hr plot line ?and or only show
Informações sobre o projeto
Orçamento
10 - 50 USD
Desenvolvedor
9
- 45
USD
Prazo
de 1 para 3 dias