Trabalho concluído
Tempo de execução 2 dias

Comentário do cliente
Comentário do desenvolvedor
Looking to develop an indicator that plots line for every distinct high/lows. Upon successfully plotting, the lines shall be drawn and extended until encountering a new candle in the future. 2 scenarios can happen here:
a) the line meets a candle that engulfs through the line, in this case the line shall stop there.
b) the line meets and get "wicked" by another distinct high/low and in this case, the line shall stop there as well. For highs, rename and display name of the line as (ChartTimeframe + " Topped"). the name shall be display above the line. For lows, rename as (ChartTimeframe + " Bottomed"). The name shall be displayed below the lines. NOTE: only display the names for this scenario. Do not show name when it meets another candle.
Finally, a line delete function that deletes all the lines except for scenario B.
The attached indicator contains ALL The source code for all the function above, so it is merely a copy/paste + some very simple structuring of the code.
This indicator, upon attached to a chart, can be activated by pressing "Q", and clicking onto any area of the chart. What it does is, from the place you clicked, the period is derived and the lines shall be drawn 200 candles to the left. What i would be expecting is using the same source code, use "Q" as drawing lines and use "W" as deletion unnecessary lines(scenario A). Feel free to play around with the indicator. Source code shall be provided for selected programmer.
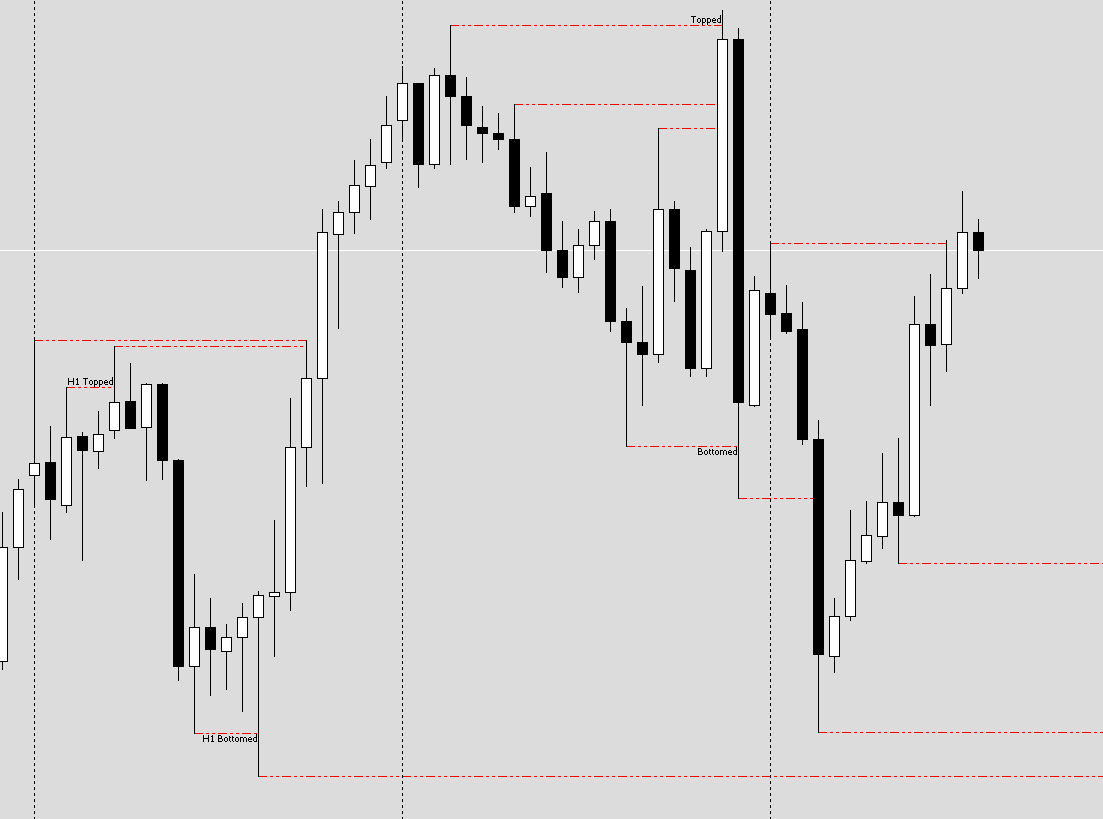
Image A showing example of what would happen when "Q" is pressed and clicked onto a chart
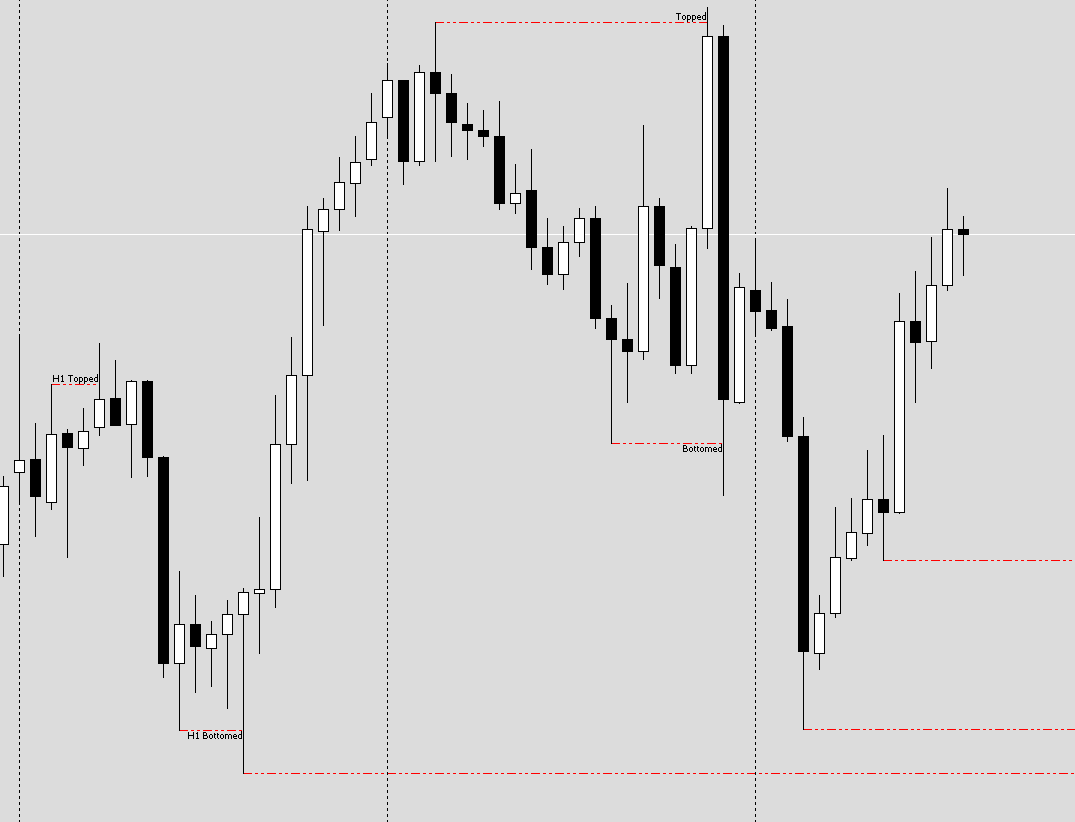
Image B showing what it should looked like upon pressing "W" and clicked onto the chart. Do note that lines that have yet to encounter any candles in the future shall remain extended.
As emphasized, source code is provided upon being selected. But pls download and play around the indicator to have a feel on it. The current indicator does not have the "encountering" a candle logic yet. But the checks for distinct high/low wicking another distinct high/low is in place already. The code for pressing a keystroke and clicking on chart is also made available for you to use
Pedidos semelhantes
Dear Freelancers, I'm seeking a skilled MT4/MT5 developer to collaborate on a valuable trading indicator. Project Description: I'm looking to develop a powerful Elliott Wave indicator compatible with the MT4 and MT5 trading platforms. This indicator will be based on the highly successful [LuxAlgo] indicator currently available on TradingView. Key Features: In-indicator Alerts: The ability to receive pop-up
//+------------------------------------------------------------------+ //| SimpleEA.mq4 | //| Generated by MetaEditor | //| https://www.mql5.com/en/docs  ; | //+------------------------------------------------------------------+ #property strict // Input parameters input double LotSize = 0.1; // Lot size input int MovingAveragePeriod = 50; // MA
1. **Timeframe and Liquidity:** Focus on the 5-minute timeframe for liquidity analysis.(timeframe for liquidity should be editble) 2. **Candlestick MSS:** Monitor 1-minute candlestick patterns for entry signals.(should be editble) 3. **Swing Points:** Identify swing points using the high and low of the last three candles.(ict swimg high and low) 4. **Sell Setup:** - Wait for a 5-minute candle to take out the swing
i am looking for experienced programmer to create indicator for me. i am willing to pay for the service. and if it works amazingly like i expected. i will tip more money
High Low intraday ticker to display the most recent high low of up to 40 stock symbols. As a stock makes an intraday high low it will populate at the top and so on. Regardless of chart that's display it will continue to track high lows of the 40 stocks inputed. The 40 stocks can by manually changed. A high will display as green with the time (hour:minute:second), symbol, and last price. A low will be displayed as red
Modify an existing Python bot to trade bollinger bands, with iqoption api Currently the bot strategy is wrong, I am limited in my knowledge here and hope to fix this Hope to work with more experience people out there in relation to iqoption api and python
I need an EA to automate Tradingview alerts on MT4 using webhook alerts. The bridge/connector should be python based GUI. Required features at a minimum Mapping Tradingview alert formats to MT4 Automating market, limit and stop orders with entry price, stop loss, multiple TPs and trailing stop Lot sizing - fixed/% of balance/fixed amount breakeven, partial close and trailing stop Mapping pair name prefixes/suffixes
hi guys, I have a script, that I have been struggling to work. most of the work is done, just final touch of an expert is needed. The script Is using Fibonacci and Pivot standard in its base. look forward to hear from an expert! Best regards Sina
I want to find a Developer to perform this work and settle payments in this Application. I undertake not to communicate with Applicants anywhere else except this Application, including third-party messengers, personal correspondence or emails. I understand that violators will be banned from publishing Orders in the Freelance service. I have read the Rules of using the Freelance service and accept them. I agree