Auto Plot Rectangles & Trendlines around High/Low Wicks & Open H/L PriceLevel trendlines specified by Timeperiods

Trabalho concluído

Tempo de execução 7 dias
Comentário do cliente
Excellent Developer, Great Job, Support and Communication, Double Thumbs Up!!
Comentário do desenvolvedor
Perfect. Clear Rules are provided. Good communication and help to find and solve issues.

Termos de Referência

I am looking for an MQL5&4 Indicator for Automatic Plotting of Rectangles around High and Low of Finished Wicks and Trendlines of Open H/L Price Levels within Selected Time Periods using following Basic Requirement Specification and features of Concept, this is conceptual basics and not completely refined or definite yet, work in progress.

I.e.
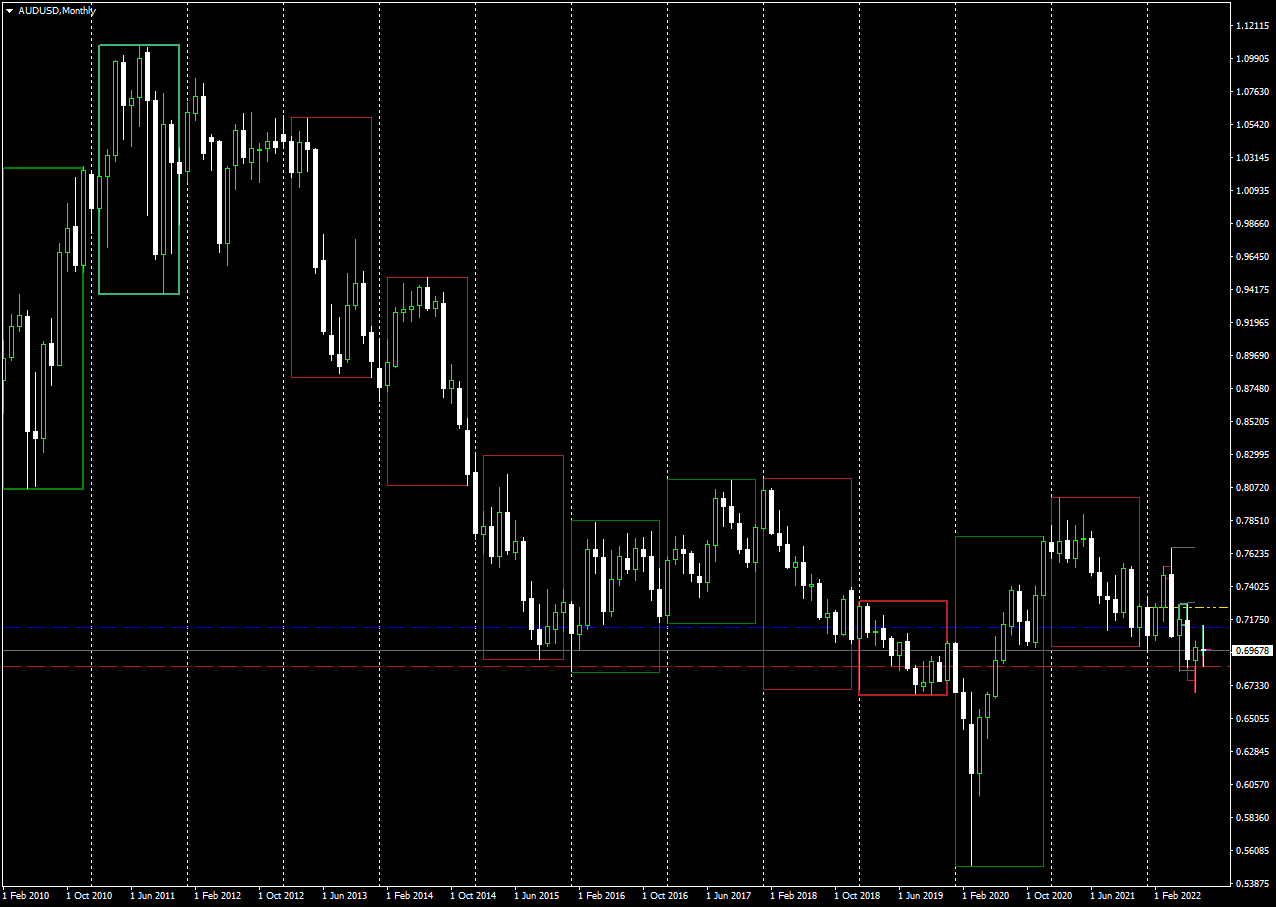
Autoplot Rectagles on Monthly/Weekly Chart around High&Low of each finished 12 Months Period
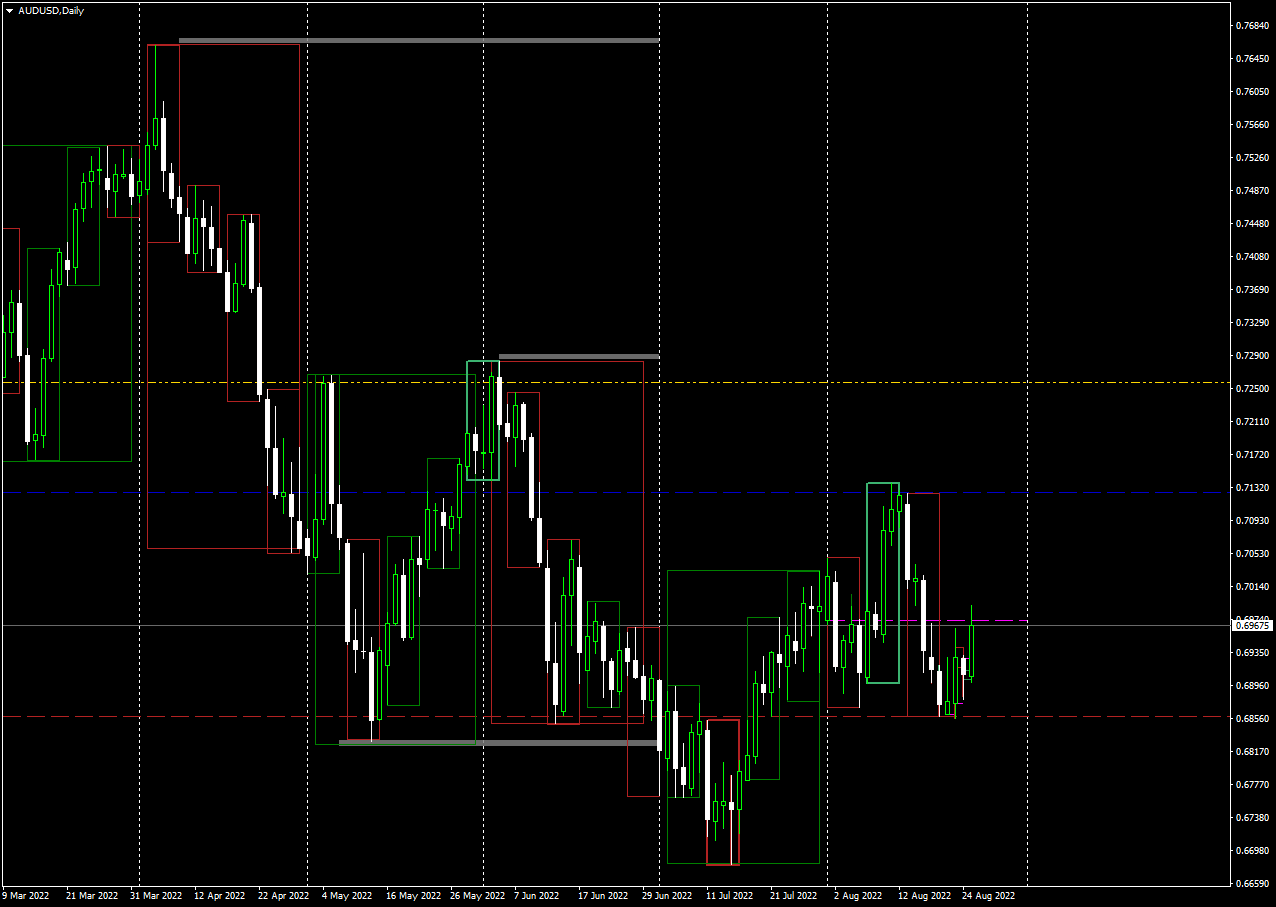
Autoplot Rectagles on Daily Chart around High&Low of each finished Monthly Period
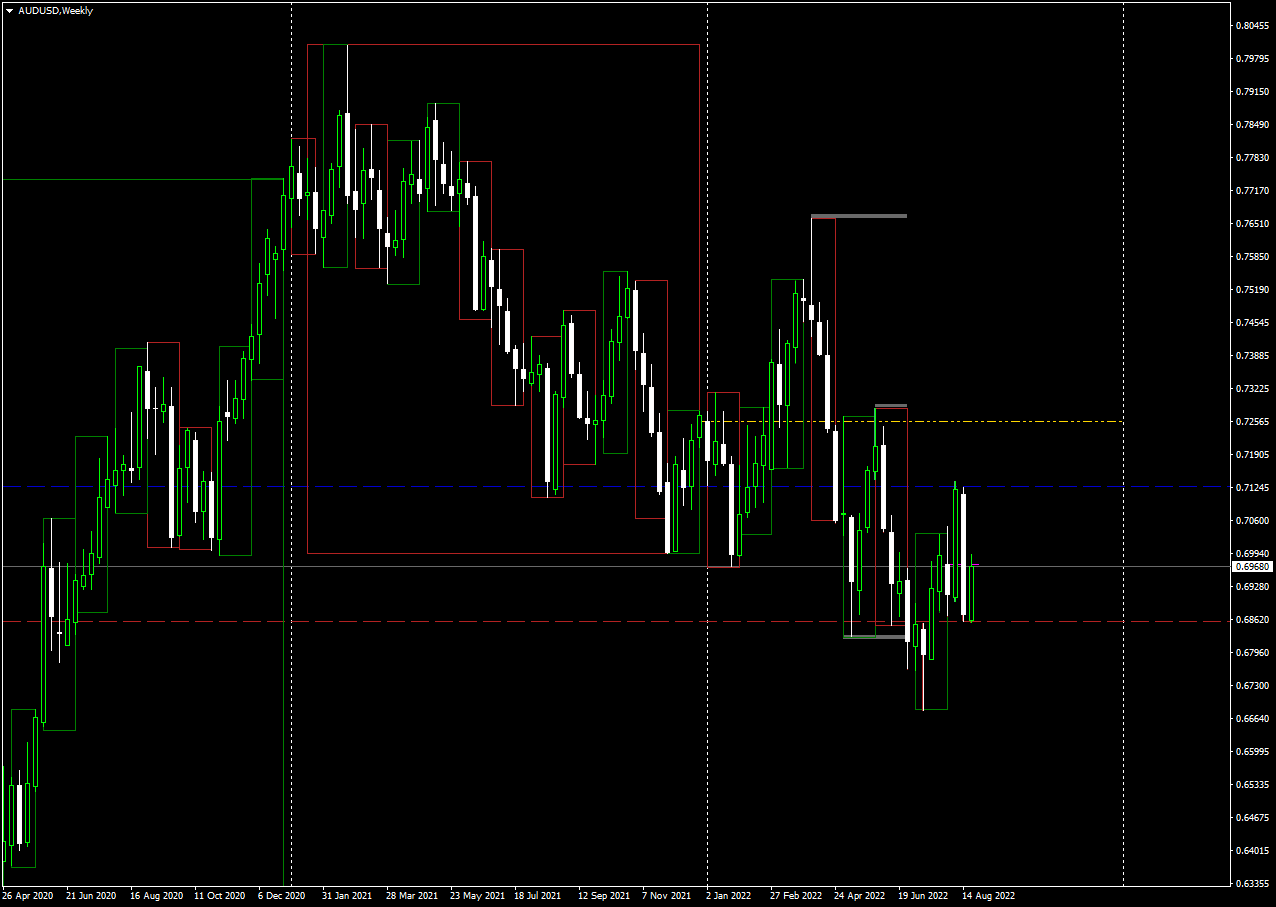
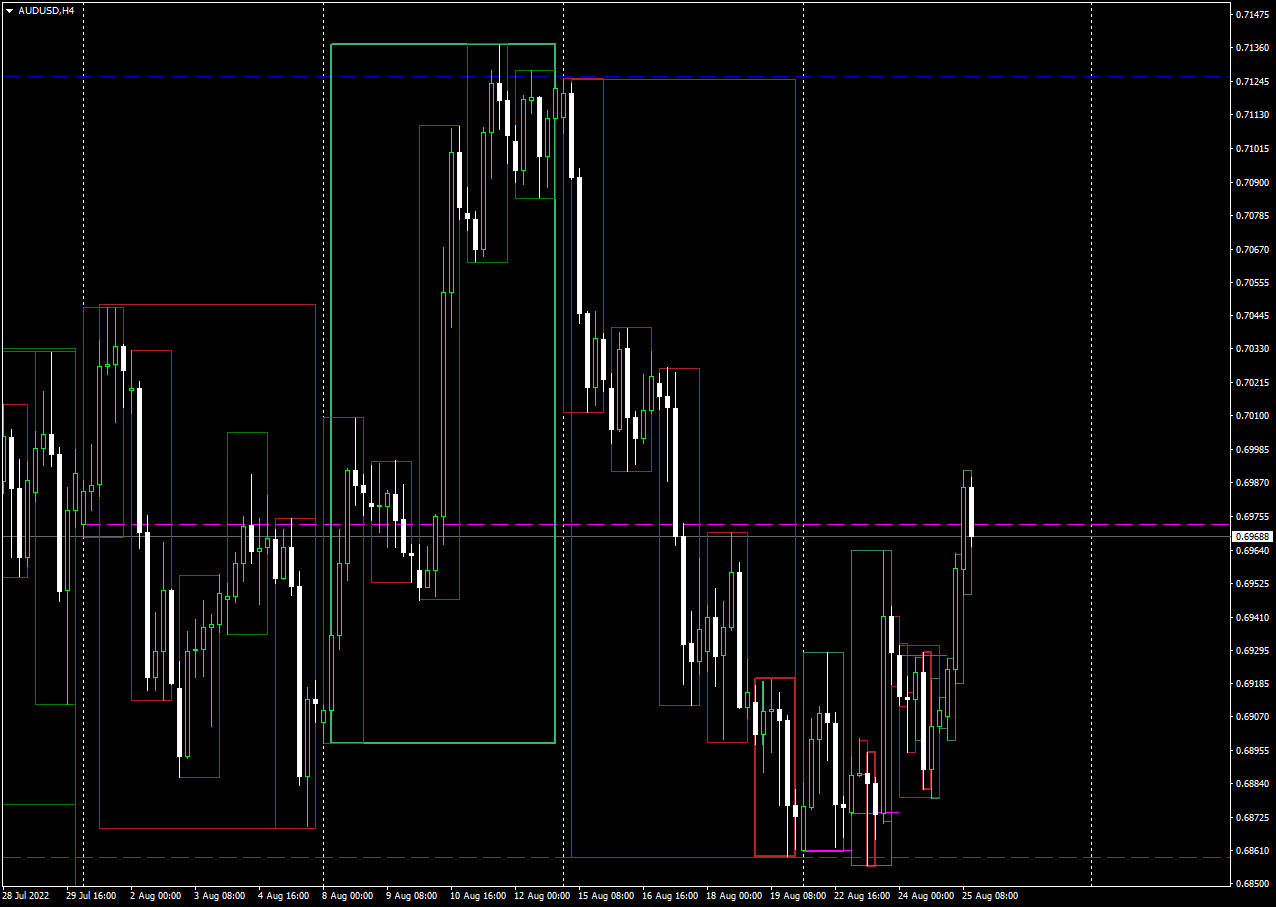
Autoplot Rectagles n 4H Chart around High&Low of each finished Weekly Period
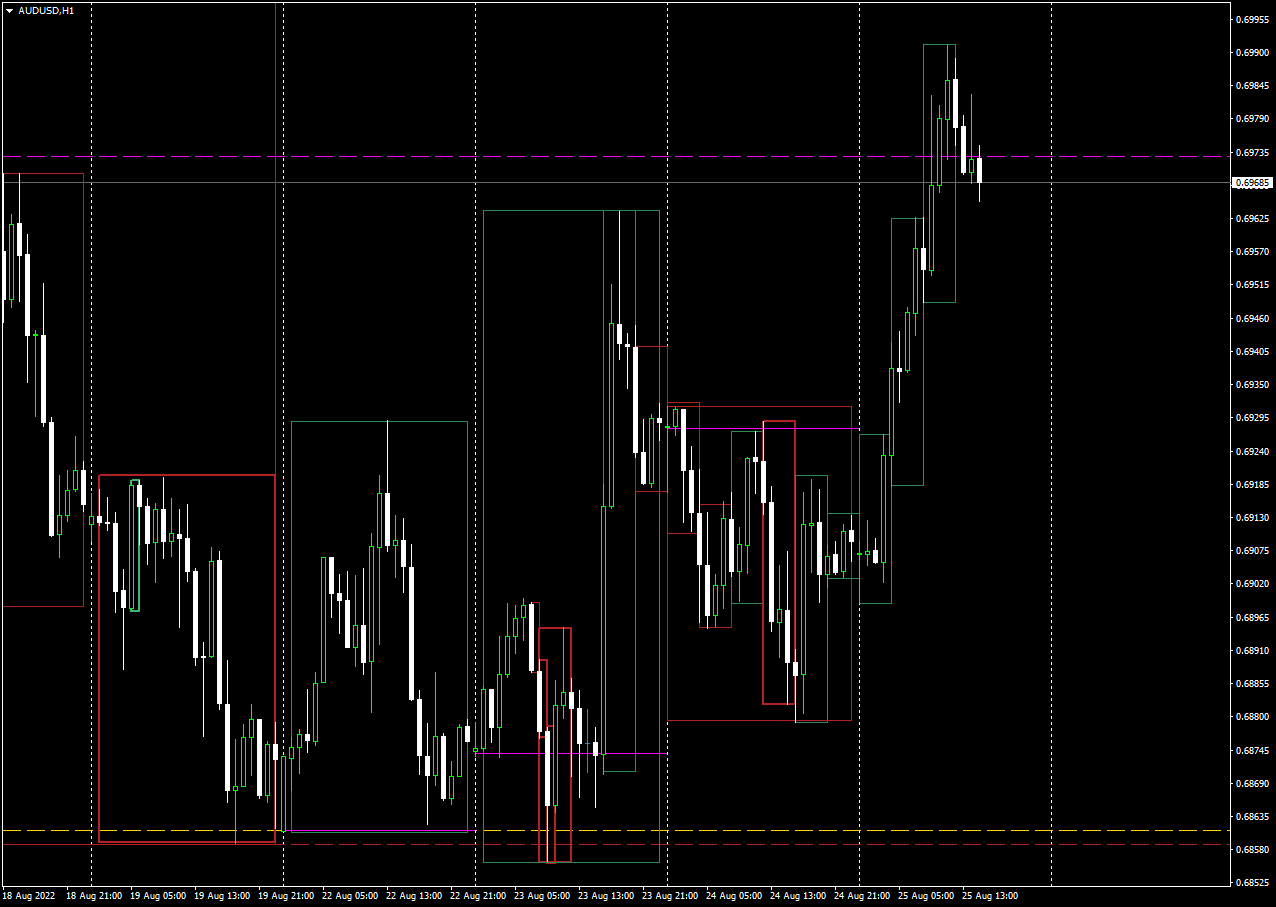
Autoplot Rectagles on 1H Chart around High&Low of each finished Daily Period
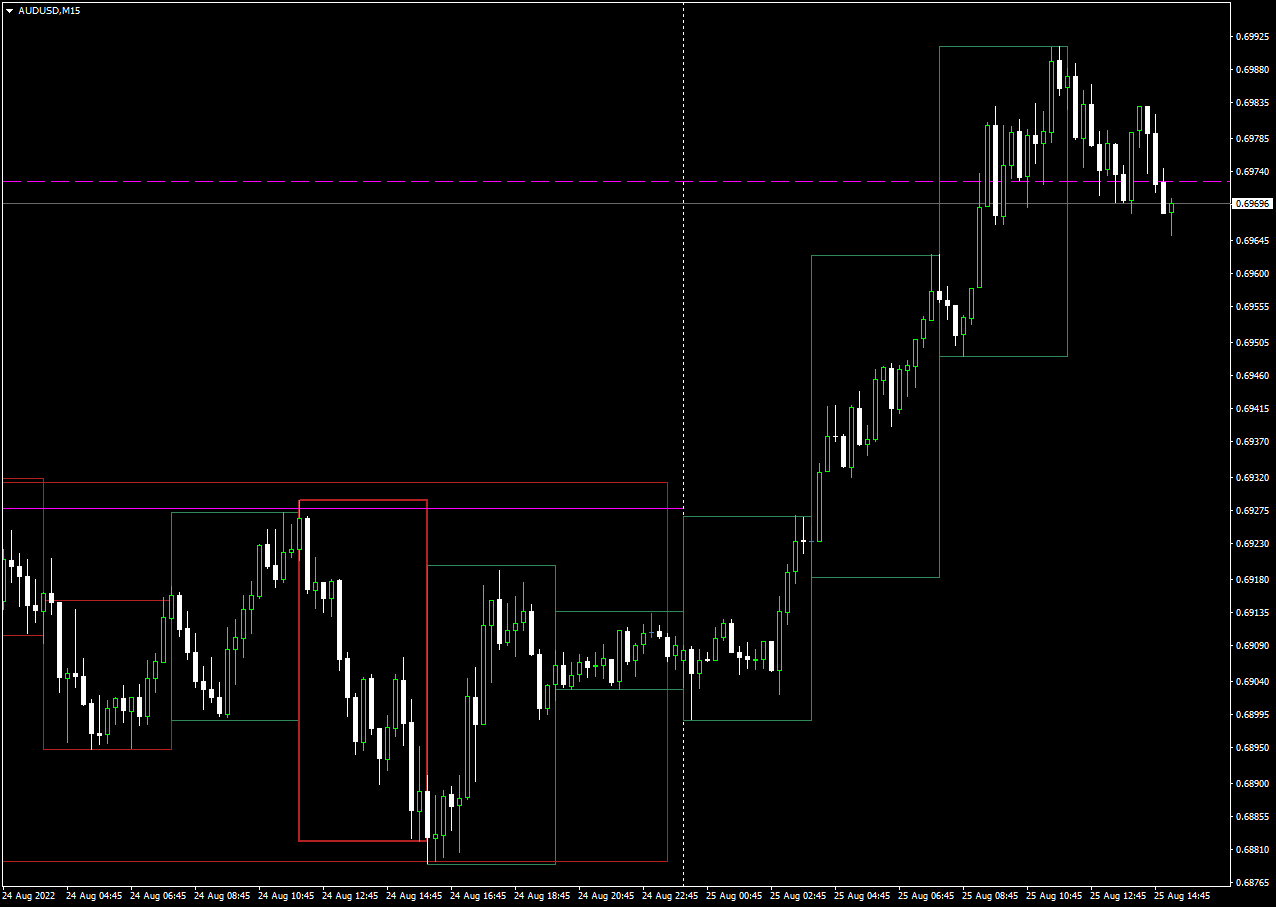
Autoplot Rectagles on 15M Chart around High&Low of each finished 4H Period
Autoplot Rectagles on 5M Chart around High&Low of each finished 1H Period


-Toggle per Instrument which TimePeriods (M,W,D,4H,1H,15M,5M)should need to be activated and filled with Rectangles around finished Periods.

- Default Color SeaGreen for bullish Rectangle, FirebrickRed for Bearish Rectangle

- Highest and Lowest rectangle per Time period Thickness Bold

- Toggle selection Per Instrument which of the above TimePeriods needs to be drawn

- Toggle Selection Per Time periods how many/long need to be drawn in history

- Individual rectangle modification size,color,thickness should remain possible


Yearly Open Price level -Dashed Dot Dot Yellow Trendline for the Current open 12Months
Monthly Open Price Level -Dashed Magenta Trendline for Current Open Month
Weekly Open Price Level -Dashed Gold Horizontal Line for Current Open Week
Daily Open Price Level -Solid Magenta Trendline for last finished 2 Days and Current Open Day

Previous Finished Weekly High Level -Medium Blue Dashed Horizontal Line
Previous Finished Weekly Low Level -Firebrick Red Dashed Horizontal Line

Fully Functional Indicator to be energy efficient, no real time drawing needed, update drawing using platform refresh is fine.

Open for Suggestions, Alternative or Modification of Specification Parameters

See guided pictures as examples of concept


Arquivos anexados:

PNG
AUDUSDH4.png
70.5 Kb
PNG
AUDUSDH1.png
71.6 Kb
PNG
AUDUSDM15.png
44.2 Kb

Respondido

1
Desenvolvedor 1
Classificação
(725)
Projetos
1045
39%
Arbitragem
47
49% / 23%
Expirado
84
8%
Trabalhando
2
Desenvolvedor 2
Classificação
(568)
Projetos
641
41%
Arbitragem
21
57% / 29%
Expirado
47
7%
Trabalhando
3
Desenvolvedor 3
Classificação
(368)
Projetos
398
70%
Arbitragem
3
100% / 0%
Expirado
2
1%
Carregado
Pedidos semelhantes
Dear Developers, I would have a very simple request. I have a ML model developed in Python for EURUSD daily trading. I would like to backtest it in Meta Trader 5 using the Strategy Tester tool. For that I would need an Expert Advisor program. The input would be a csv file that contains two columns: - dates (going back for a few years on a daily basis) - trading signal (it can have only 2 values, either 1: Buy, or -1
Hello The EA will work on particular zone choose by the user and can mark it on any TF and with some rules can open trades and mange the trade by some unique rules. the EA need to check the difference by RSI as well and with some extra rules . developer should have good attitude and good communication (englsih) with high performence and knowledge with coding EA
Hi I have the code in pinescript for an indicator that I need done in Ninja Trader 1. The Trading View indicator code needs to be converted into and adapted for Ninja Trader 8 2. An indicator and Automated Trading Strategy needs to be developed. 3. Any parts of the Trading View Indicator that can't be replicated needs to be discussed with me and agreed before excluding. (there should not be any) 4. Trailing stop and
Hello The EA will work on particular zone choose by the user and can mark it on any TF and with some rules can open trades and mange the trade by some unique rules. the EA need to check the difference by RSI as well and with some extra rules . developer should have good attitude and good communication (englsih) with high performence and knowledge with coding EA
1. The Trading View indicator code needs to be converted into and adapted for Ninja Trader 8 2. An indicator and Automated Trading Strategy needs to be developed. 3. Any parts of the Trading View Indicator that can't be replicated needs to be discussed with me and agreed before excluding. (there should not be any) 4. Trailing stop and Trailing Draw Down options need to be implemented 5. Risk needs to be in % of
Create mt4 ea 50+ USD
To convert the provided MT4 indicator script into an Expert Advisor (EA) and implement prompt functionality for user input, we need to modify the code to handle external parameters and provide a user-friendly interface. Below is the EA code that incorporates prompts for user inputs
I WRITE a code i want to conect this for automatic trading through vps .and als advanced features for this code .i attached afile please watch .and give me perfect ea
Hi I have the code in pinescript for an indicator that I need done in Ninja Trader, I wanted this indicator in NT bcs I chart in NT, and if the indicator could also have been an automated strategy even better. Please confirm that it will be an indicator and Automated Trading Strategy
Hello potential Freelancers I’m very new to trading so please bear with me as I try to explain what ‘m looking for. I'm currently getting signals ( XAUUSD )sent to me and I’m looking to find a person who can look at the data either watch account live, or I send the trade history. The bot my provider is using makes 100’s of trades a day and does very well on average. I’m also looking to have the following features
Hello I need a very simple indicator This indicator should show the highest floating or history drawdown of the account It means that it can display the highest number that the account drawdown to be displayed on the chart in this format max drawdown account(xxxx$$) ...date(00/00/00)time:(00:00) max drawdown currency ..( currency name with max drwadown) . (xxxx$$) date(00/00/00)time:(00:00) thanks

Informações sobre o projeto

Orçamento
30 - 99 USD
IVA (21%): 6.3 - 20.79 USD
Total: 36.3 - 119.79 USD
Desenvolvedor
27 - 89.1 USD
Prazo
para 14 dias