Momentum (M) Indicator for MT4

MQL4 Indicadores Forex

Trabalho concluído

Tempo de execução 3 dias

Termos de Referência

Momentum (M) Indicator:

This is a simple indicator where the indicator looks at the Momentum (M) value of all the candles.  Starting with the latest formed candle, the indicator compares its M value with the previous formed candle.  If the M value of the latest formed candle is higher than previous candle it places an upward pointing arrow (up arrow) below the bottom wick (BW) of the candle and if it is lower than previous candle’s M value, it places a downward pointing arrow (down arrow) above the top wick (TW) of the latest candle.  It should place arrows for all candles in all time frames (TF) by comparing their M values with the M value of their previous candles.  


I am giving you an example of a previously designed indicator by another developer.  This is another indicator (called BSR indicator), this is NOT M indicator.  I am simply showing you this as an example.  The arrows for the M indicator should also look like this BSR indicator.  I have attached here the ex4 file of this indicator and you can place it on an MT4 chart for you to see how it places arrows above and below all the candles. 

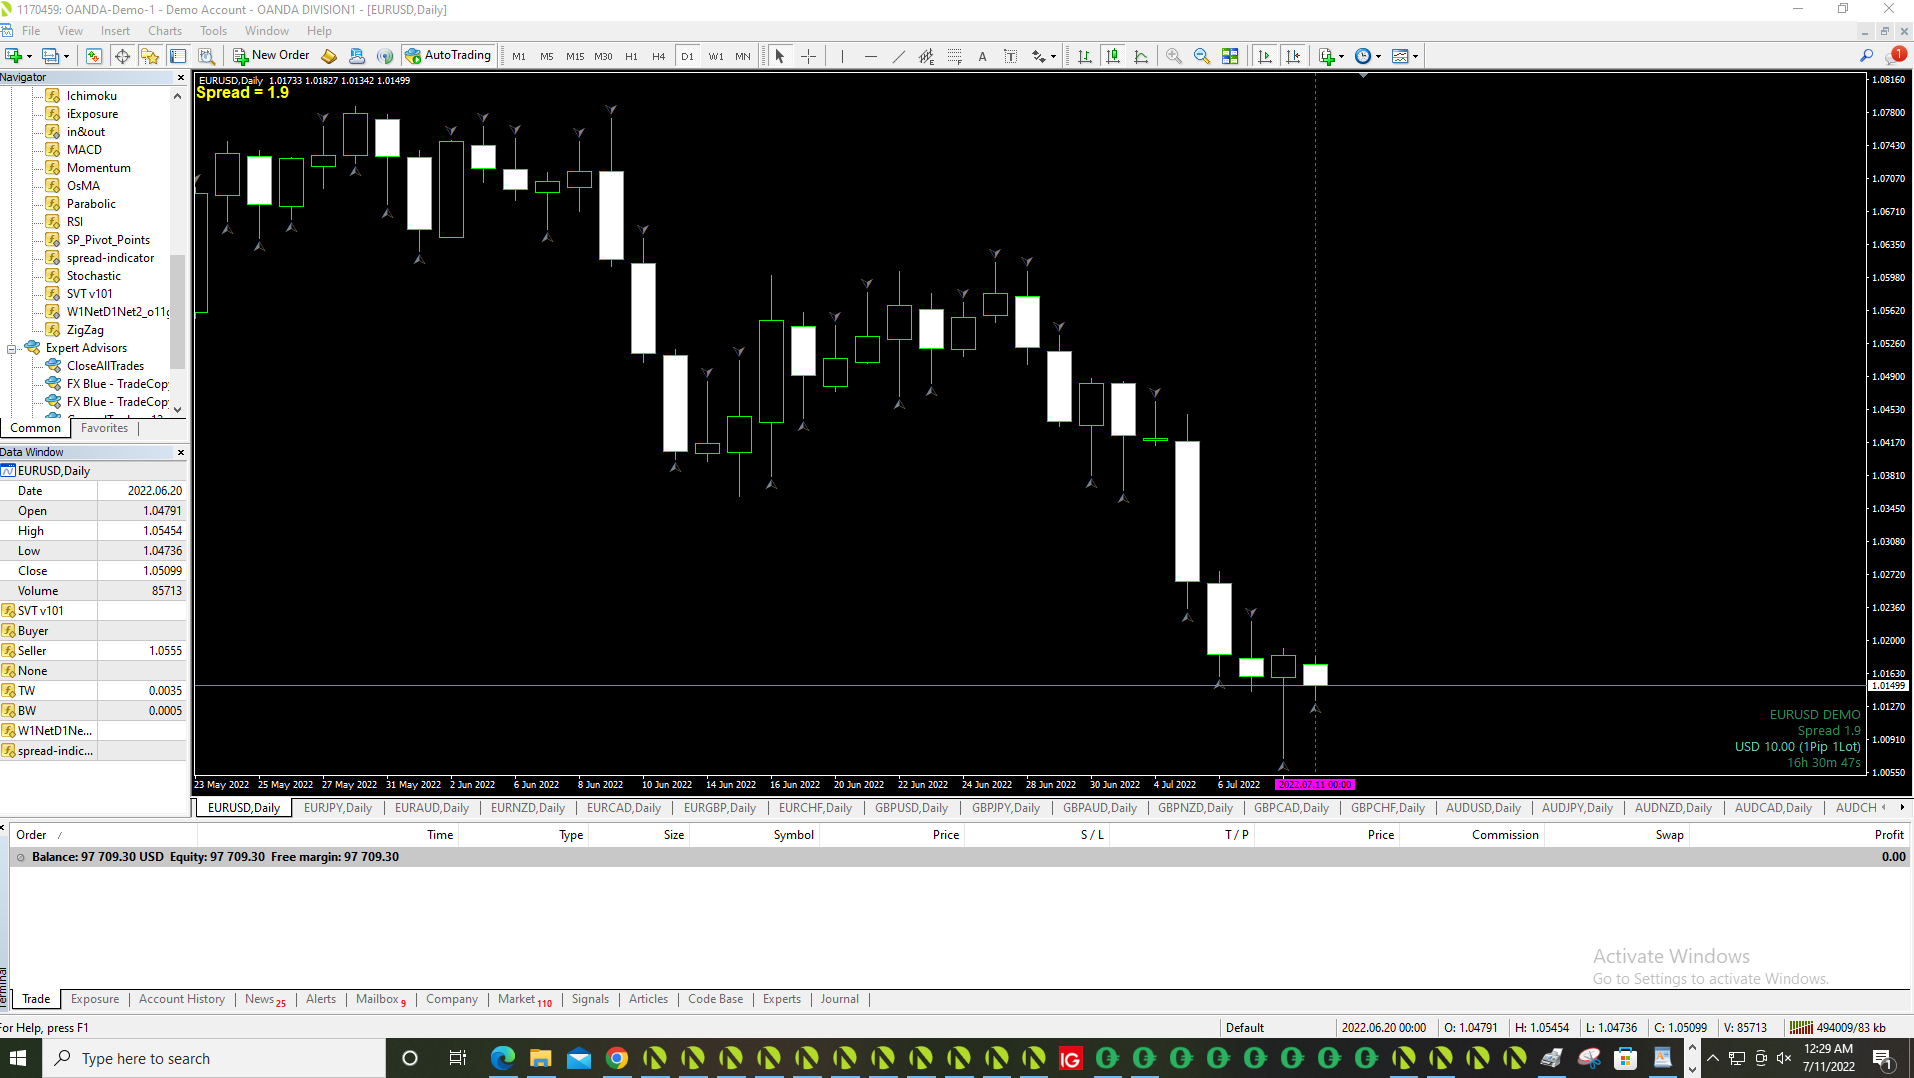
I have attached a screenshot of a eurusd pair’s D1 chart where this indicator placed the arrows.  The M indicator that you will be designing should place arrows in the same way above and below all the candles. 


In order to get the M values for candles, place Momentum (M) Indicator on the bottom of your chart.  This is a standard indicator on MT4 platform.  After placing the indicator on your chart, place your cursor on an already formed latest candle, then the indicator will show the M value in the Data Window. 


For your information, these are the M values of different D1 candles of different days on a eurusd currency pair:


July 8 2022: 96.8972

July 7 2022: 96.8487

July 6 2022: 96.5171

July 5, 2022: 98.2634


Now to get the arrow of the latest formed candle of July 8, the indicator compares the previous candle of July 7 M value with July 8 value.  July 8 value is larger than July 7 value.  Hence July 8 candle gets an up arrow placed under its BW.  Now, to get the arrow of July 7 candle, indicator compare its M value with July 6 candle’s M value.  July 7 value is larger than July 6 value.  Hence July 7 candle also receives an up arrow placed under its BW.  Now to get the arrow of July 6 candle, the indicator compares July 5 candle M value with July 6 candle’s M value.  July 6 value is smaller than July 5 candle value.  Hence July 6 candle receives a down arrow placed above its TW.  Likewise, every candle receives either an up arrow or a down arrow either below or above it, by comparing its M value with its previous candle’s M value.  All the formed candles of all time frames should have these arrows placed either below or above them with a visualization setting, so that we can place them selectively only in some TFs if we choose to.  The default setting should be arrows placed in all TFs. 


If there are any questions, please contact me ASAP.  This is a very simple indicator with very simple and clear logic.  It is important that you understand it clearly before designing it.  I can help you understand the logic if there are any questions on it.      


Respondido

1
Desenvolvedor 1
Classificação
(237)
Projetos
419
34%
Arbitragem
53
36% / 40%
Expirado
154
37%
Carregado
2
Desenvolvedor 2
Classificação
(363)
Projetos
389
70%
Arbitragem
3
100% / 0%
Expirado
2
1%
Carregado
Pedidos semelhantes
Existing Supertrend Indicator -Create summary Panel to display trade results -Calculate SL and TPs based on the given requirement -Calculate totals - Calculate consecutive wins etc. For details please message
I'm seeking assistance in developing a sophisticated trading robot with the following features: Core strategy: Harmonic pattern recognition Supply and demand analysis Fibonacci zigzag for trade optimization Additional components: News filter Dashboard for easy monitoring Customizable settings: Lot size Trailing stop Trading session parameters Maximum number of orders Option to use market or limit orders Resources
I need an experienced programmer to create an automated EA that will open trades based on different candle stick formation strategies and indicators. The EA will first scan the market, find a current market trend and define area of support and resistance. On ranging market the EA doesn’t place trades . (1) EA should use a straddle strategy from either the S/R level, (2) indecision Doji candle from the S/R area, (3)
Need ea according to stochastic divergence (both hidden and regular) plus candlestick flip .. need for experinced developers to complete my order with 99percent accuracy. So bet for it the budged is fixed and other plugins will be added in the v2
Looking for an EA which can produce less than 5% drawdown. Also profit factor above 1.5 (preferably 2.0) Please give me proper explanation how your EA works too Has anyone programmed it before? is it limited to forex only
I want to make a new dashboard using 3 common indicators and the ADX indicator , which you must supply I have a MA dash which you can strip & reuse if it helps you I tried to cover all questions in the attached but i'm sure there'll be more
I want the script in mql5 language for my martingale strategy. The script should open trades in both directions buy and sell and if any trade closes in loss then open new trade in that direction by using the next volume and when trade closes in profit then reset the volume to first from volume list and also maximum consecutive losses limit will apply. If trades closes consecutively in losses and hits the limit then
I installed the E.A. into the Experts folder in MT4. When I double click on it nothing happens. When I right click and "attach to chart" nothing happens. The E.A. is not grayed out, it simply will not attach. Any help would be greatly Appreciated
hi hi there i have an strategy on tradingview and i want to automate it like metatrader EA so i want the strategy to open and close trade automaticlly on tradingview
The wiper 35 - 48 USD
a ll traders want to find market behavior patterns, which could help identify favorable moments for performing trading operations. They also want to eliminate randomness and influence of external factors, such as rumors, news releases, fatigue, and so on. Traders monitor charts and may formulate some formal rules, which enable objective analysis of price or tick charts. Technical indicators can facilitate such

Informações sobre o projeto

Orçamento
30+ USD
Desenvolvedor
27 USD
Prazo
para 3 dias