First of all, I need you to confirm with me that you fully understand the job-description and specification for the job. You`ll need to re-explain me what I want, so that there are no misunderstandings whatsoever on what I want you to create for me. If you are unclear about something, first ask me, if needed a hundred times, so that you fully comprehend my desired indicator, because nobody wants to go through the hassle of requesting arbitration.
I need a multi-indicator that will show me what the current status is of all timeframes. This multi-indicator will show multiple statuses based on multiple indicators such as the Parabolic SAR, the Stochastic Oscillator, MA 50 vs 200, MA 9 vs 21 and Bill William’s Awesome Oscillator.
The indicator will also show the Overbought or Oversold status based on the Stochastic Oscillator when both the Signal and Stoch line are either above 80 or below 20 points. And it will also show if the price is under or above the 200 MA line.
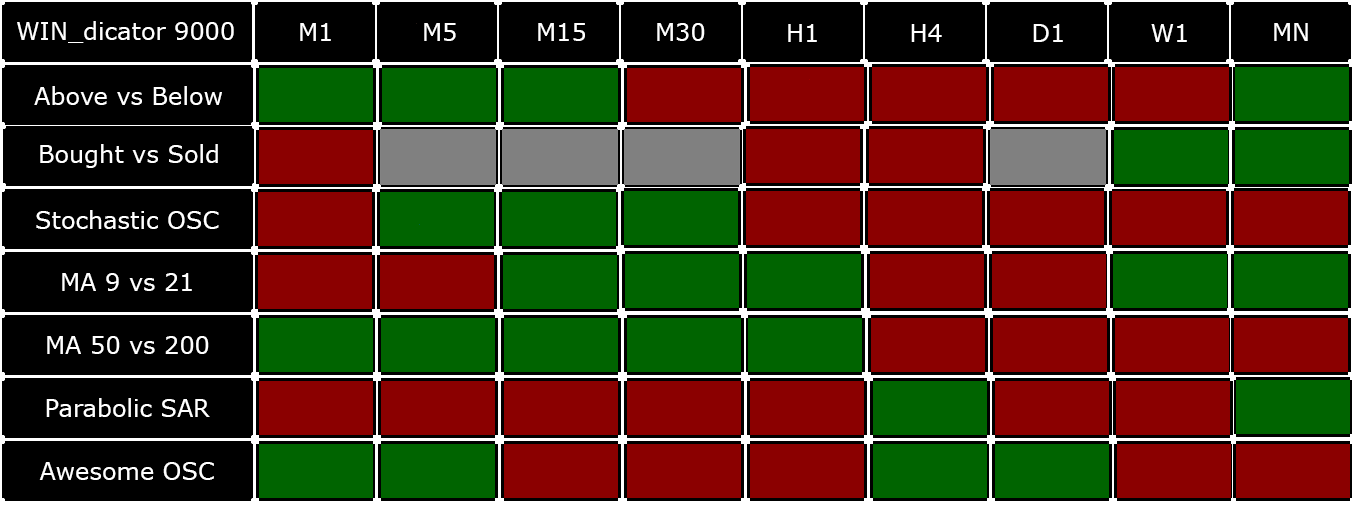
The status will be shown inside a new window like the example below. I want the indicator to look and behave exactly like the image below:
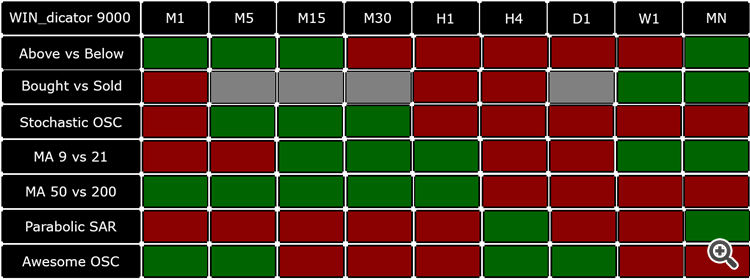
The following counts for any of the 9 timeframes.
Above vs Below = When the price is above the 200 Moving Average, the box will instantly turn green, but when the price is below the 200 Moving Average, the box will instantly turn red.
Bought vs Sold = When both the Stoch and Signal -line numbers of the Stochastic Oscillator are above 80 points, the box will instantly turn red, but when both the Stoch and Signal -line numbers of the Stochastic Oscillator are below 20 points, the box will instantly turn green. When both the Stoch and Signal -line numbers of the Stochastic Oscillator are in between 20 and 60 points the box will instantly turn grey.
Stochastic OSC = Based on the default settings of 5,3,3. When the Stoch line number is above the Signal line number, the box will instantly turn green, but when the Stoch line number is below the Signal line number, the box will instantly turn red.
MA 9 vs 21 = When the MA (9) number is above the MA (21) number, the box will instantly turn green, but when the MA (9) number is below the MA (21) number, the box will instantly turn red.
MA 50 vs 200 = When the MA (9) number is above the MA (21) number, the box will instantly turn green, but when the MA (9) number is below the MA (21) number, the box will instantly turn red.
Parabolic SAR = Based on the default settings. When the Parabolic SAR is above the candle, the box will instantly turn red, but when the Parabolic SAR is below the candle, the box will instantly become green.
Awesome OSC = When the AO number of the current candle is higher than the AO number of the previous candle, the box will instantly turn green. When the AO number of the current candle is lower than the AO number of the previous candle, the box will instantly turn red.
The indicator menu should give me the following settings to change:
· Stochastic Oscillator
o K% Period 5
o D% Period 5
o Slowing 3
· Moving Average
o Period 9
o Period 21
o Period 50
o Period 200
· Parabolic SAR
o Step 0.02
o Maximum 0.2
· Bear-box
o Color (default red)
· Bull-box
o Color (default green)
Pedidos semelhantes
Hey MQL COMMUNITY, I have some ideas trading that needed to come to life based on my expected trading target, I have the details strategy ready so I wanted to be programmed as PineScript Indicators based on my trading specifications for TradingView platform, please reach out if you are well skilled in programming algo trading system for tradingview using PineScript coding solutions and can run without any problem
Hello i am seeking a skilled MetaTrader 5 (MQL5) developer to modify an existing Telegram signal copier. The goal is to enhance the copier's functionality, reliability, and user experience. kindly bid this job to get started immediately
Hello, I’m looking for assistance with creating or customizing a TradingView indicator to suit my trading needs. If you have experience in this area, please reach out. Your help would be greatly appreciated. Thanks
Where are my developers colleagues . i want you to support me on existing work i just need a little addon on it. Am still a student kindly support me. You will be get paid at the end of the work. If you want more details maybe the worth of the project or any other thing let me know. THNAKS FOR THE SUPPORT
** Entry Condition **: - ** For Long**: The trade is entered **after BB + ** is confirmed. - ** For Short *: The trade is entered **after BB -* is confirmed. ### 2nd **Stop Loss **: - ** For long Entries *: stop loss is triggered on a ** candle close above the high* of the breaker block shown by the indicator. - ** For Short Entries **: stop loss is triggered on a ** candle close below the low ** of the breaker block
Hello, am in need of a developer that can help in developing a trading bot that can effectively navigate the foreign exchange (Forex) market or other financial markets to generate passive income. My objective is to create a sophisticated algorithmic trading system that can consistently produce profitable trades with minimal manual intervention. I am seeking a reliable and efficient solution that can be tailored to my
am looking for who help me convert tradingview indicator to mt5 car trading strategy and make sure you are an expert before u apply to this and also my budget for this is 30$ so the name of the indicator is Breaker Blocks with Signals (LuxAlgo) ### 1. ** Entry Condition **: - ** For Long**: The trade is entered **after BB + ** is confirmed. - ** For Short *: The trade is entered **after BB -* is confirmed. ### 2nd
I have a custom MT4 indicator that I need converted to MT5. I'll share the source code with the applicants. Please only apply if you have vast experience in converting complex indicators successfully to MT5, and making sure that the MT5 version functions exactly the same as the MT4 version
I need an expert to help me convert chopzone traingview pinescript to mt4, I need an expert to get it done for me on between 1 to 2 days i hope this will be done by then, i will attach the file and my budget is $30 as of minimum here
Looking for someone to edit/optimize and existing NN (neural network) in my EA so it is more compatible/profitable with the multiple strategies. The expert advisor is a portfolio expert advisor consisting of 33 separate advisors/strategies compiled into one. A NN has been added to the EA but it does not compliment or help the EA's performance. I've attached the original EA (without NN) as well as the EA with the NN