Participe de nossa página de fãs
Coloque um link para ele, e permita que outras pessoas também o avaliem
Avalie seu funcionamento no terminal MetaTrader 5
- Visualizações:
- 16364
- Avaliação:
- Publicado:
- 2009.07.10 07:24
- Atualizado:
- 2014.04.21 14:54
-
 Você está perdendo oportunidades de negociação:
- Aplicativos de negociação gratuitos
- 8 000+ sinais para cópia
- Notícias econômicas para análise dos mercados financeiros
Registro LoginVocê concorda com a política do site e com os termos de uso
Se você não tem uma conta, por favor registre-se -
 Precisa de um robô ou indicador baseado nesse código? Solicite-o no Freelance
Ir para Freelance
Precisa de um robô ou indicador baseado nesse código? Solicite-o no Freelance
Ir para Freelance
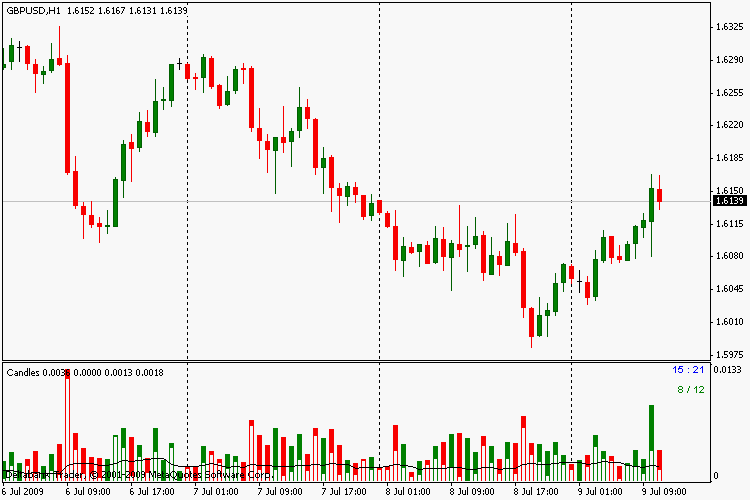
Гистограмма показывает высоту свечи с тенями и высоту тела свечи (белый цвет внутри). Высота тела сглаживается МА. В правом углу время до закрытия свечи и отношение количества свечей вверх/вниз за период Т (зеленый текст - больше зеленых баров, красный - больше красных).
P.S. Отношение вверх/вниз хотел привязать к началу определенного периода, например к началу дня или максимуму/минимуму, но пока не знаю как. Код собрал как мог. Это мой первый индикатор.
 MACD Histogram WIS
MACD lines and histogram for the Impulse trading system.
 VisualOpenOrderWithMM
Drag & Drop the script at chart on point where StopLoss should stay. Script will compare desired StopLoss with the current price and determine the type of the order - Buy or Sell. The next step is calculating the volume according Free Margin and the Risk
easy trend visualizer
easily shows trend or range
Edited RVI indicator
Lighty edited RVI Indicator.If drawing bug please recompile(Make normal drawing). Currently version SRVI@1 and SRVI@2.