Participe de nossa página de fãs
Coloque um link para ele, e permita que outras pessoas também o avaliem
Avalie seu funcionamento no terminal MetaTrader 5
- Visualizações:
- 42009
- Avaliação:
- Publicado:
- 2020.11.27 16:58
- Atualizado:
- 2020.11.27 19:06
-
 Você está perdendo oportunidades de negociação:
- Aplicativos de negociação gratuitos
- 8 000+ sinais para cópia
- Notícias econômicas para análise dos mercados financeiros
Registro LoginVocê concorda com a política do site e com os termos de uso
Se você não tem uma conta, por favor registre-se -
 Precisa de um robô ou indicador baseado nesse código? Solicite-o no Freelance
Ir para Freelance
Precisa de um robô ou indicador baseado nesse código? Solicite-o no Freelance
Ir para Freelance
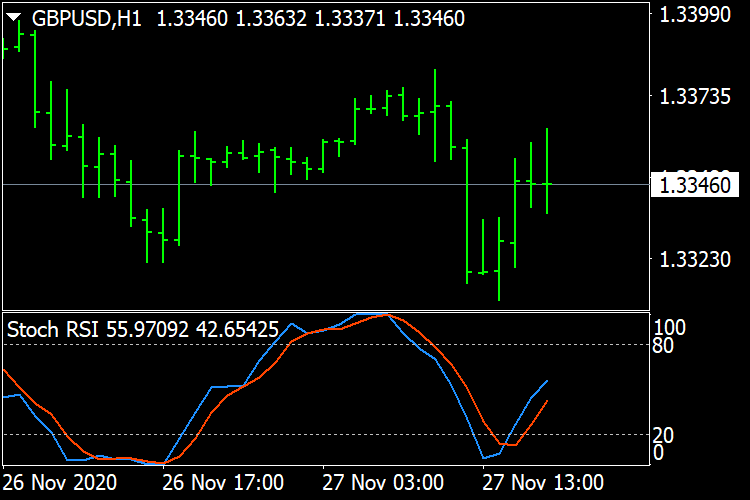
The Stochastic RSI indicator (Stoch RSI) is essentially an indicator of an indicator. It is used in technical analysis to provide a stochastic calculation to the RSI indicator. This means that it is a measure of RSI relative to its own high/low range over a user defined period of time. The Stochastic RSI is an oscillator that calculates a value between 0 and 1 which is then plotted as a line. This indicator is primarily used for identifying overbought and oversold conditions.
 Fibonacci Potential Entry - MT4
The 8 effective steps to build a robust day trading plan using Fibonacci retracement
 Doulble MA Cross Draw Histogram
Use the intersection of two moving average lines to draw a vertical line
Identify potential Trends/Range (Pivot Points) - MT4
This script was developed in order to help us detect if a chart is actually trending or going nowhere.
AverageRangeLines_v1.6
ADR,AWR,AMR,Draws Average Range Lines