Tatiana Shvedova / 판매자
제품 게시

All 11 indicators quickly turn off and turn on quickly!
Set of indicators:
2 indicators "TREND" :
- fast = line 4 colors - slow = dots 4 colors
The coloring of the indicators depends on the direction of the trend and the RSI indicator: 1) uptrend and RSI<50% 2) uptrend and RSI>50%
3) downtrend RSI<50%
4) downtrend RSI > 50% Set indicator periods for each timeframe: M5 M10 M15 M30 H1 H2 H4 H6 H12 D1 W1 MN
Do not enter trades if at least 1 of the indicators is horizontal. For a

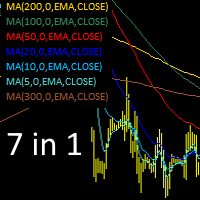
Moving Average indicators - 7 in 1. Installing 7 indicators at once, setting their parameters and properties. The indicators used (with basic properties) are shown in the upper left corner of the chart. When you click on the properties, the indicator turns on (activates) or turns off. The properties of the active indicator are displayed by its color. The properties of a disabled (not active) indicator is grayed out.
In the ind_ma indicator parameters: 1. Display the indicator on the chart (yes

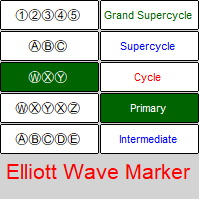
Elliott Waves Marker is a panel for marking up a chart based on Elliott waves.
The utility allows you to quickly mark the graph (mark up, edit and delete).
Input parameters: Font : Ewapro, Arial, ElliottWaveMine. download fonts : https://disk .yandex.ru/d/Pxwg7cI_cYh6_Q the second "X" in triple combination ("X" or "XX") colors for wave levels (Grand Supercycle, Supercycle, Cycle, Primary, Intermediate, Minor, Minute, Minuette, Subminuette)
For convenience, implemented: quick

정보 - NETTING 계정용 패널 메인(상단) 라인은 현재 거래에 대한 현재 이익(손실)을 보여줍니다. 계산 에 의해 결정됩니다. 하단 라인에는 전체 거래에 대한 정보가 표시됩니다. 이 정보는 기록에서 수집됩니다. "모든 주문" 및 "재무 결과 포함" 버튼은 현재 위치의 데이터와 내역(현재 거래에 대한)의 모든 주문을 표시합니다. 설정 옵션: 영어, 러시아어 배경색 , 텍스트 색상 , 이익 색상 , 손실 색상 차트에는 시가선이 표시됩니다. 도구 정보의 사용자 정의 가능한 목록: (패널 왼쪽) 초기 구매 마진 초기 판매 마진 가격 단계 가치 포인트 가격 단계 가격 단계 비용 1포인트 가격 계약 규모 경매 종료일 포인트로 퍼짐 최소 허용 가격 최대 허용 가격 상품의 기준 통화 이익 통화 균형 여유 증거금 시설 마진 수준 마진 콜 그만