Nguyen Dinh Quy / 프로필
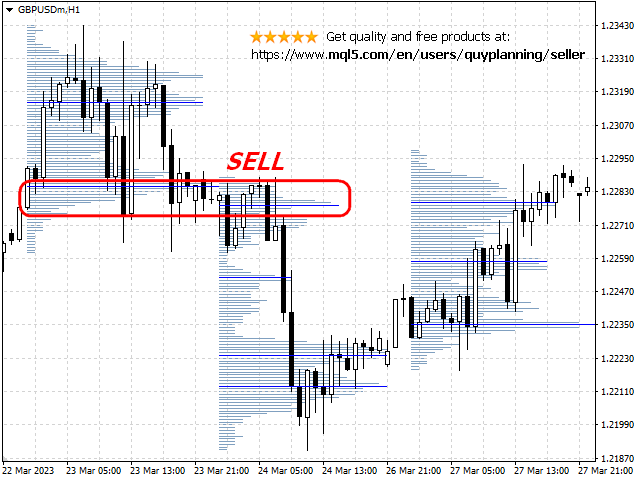
Volume Area is a very useful indicator. It allows you to spot the price levels where important price action took place. Since trading activity with increased volumes is often associated with price reversals, forex traders consider these areas important. Volume Area indicator for mt4 provides forex traders with low volumes, high volumes, and a volume point of control, VPOC. VPOC or POC is considered an important support or resistance area where trading volumes are at a peak level. As a
FREE: https://www.mql5.com/en/market/product/95633
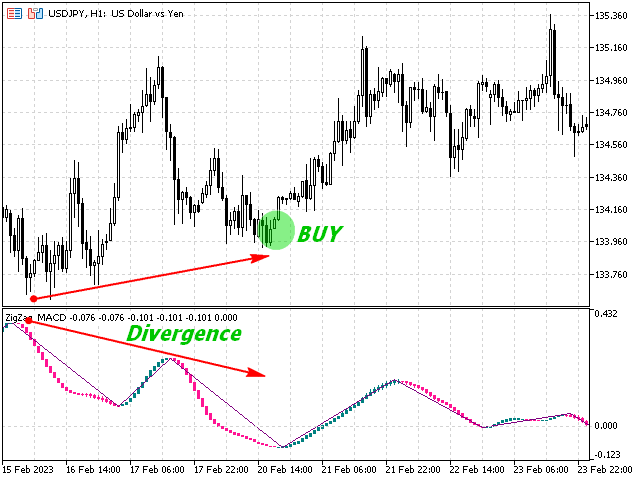
MT4 Expert: https://www.mql5.com/en/market/product/93694
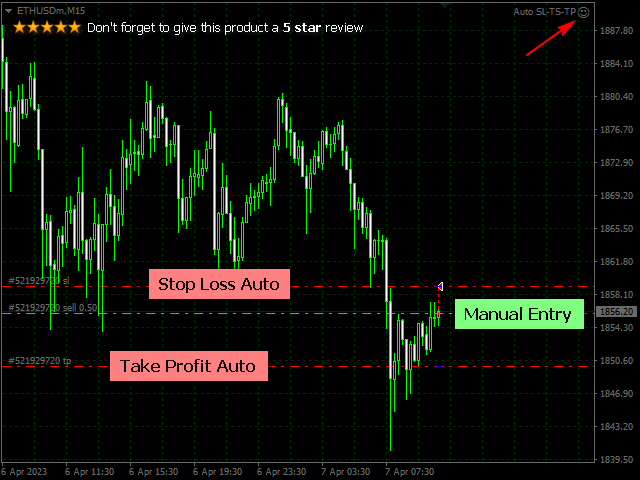
MT4 Expert: https://www.mql5.com/en/market/product/94613
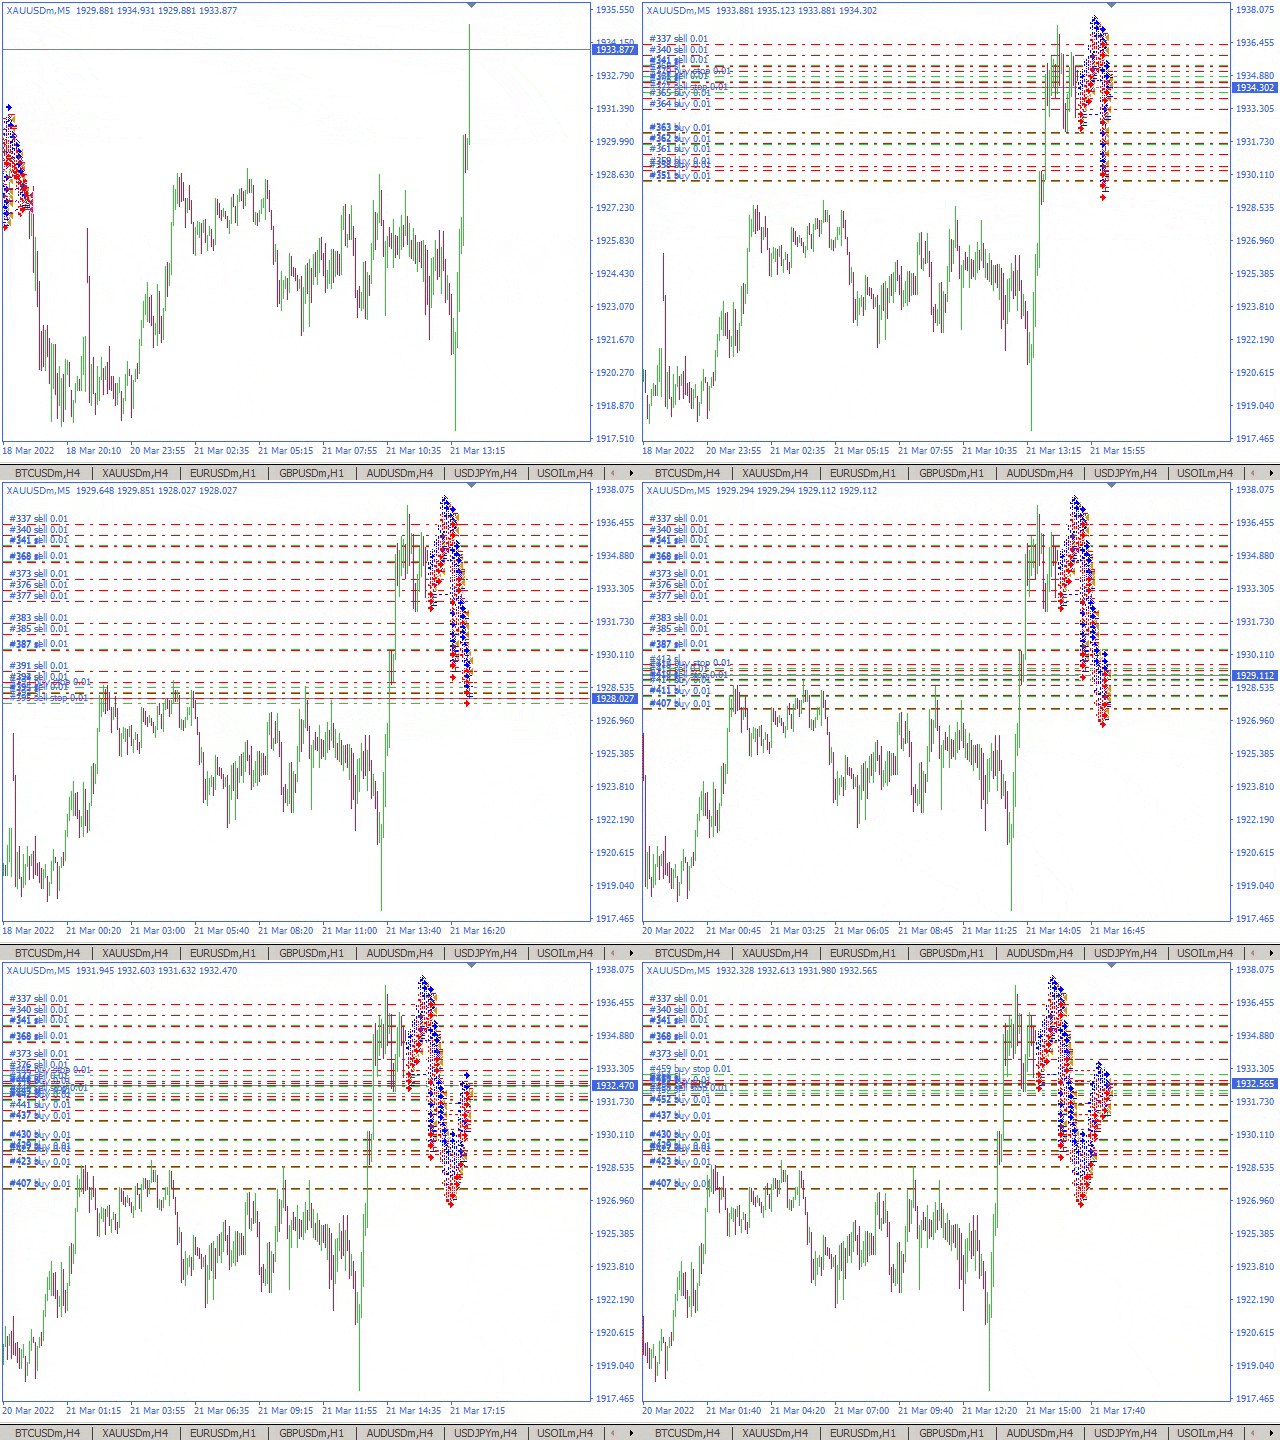
https://www.mql5.com/en/market/product/93667
+ as "trending" indicator;
+ as indicator to be used for stop loss targets.
https://www.mql5.com/en/market/product/96387
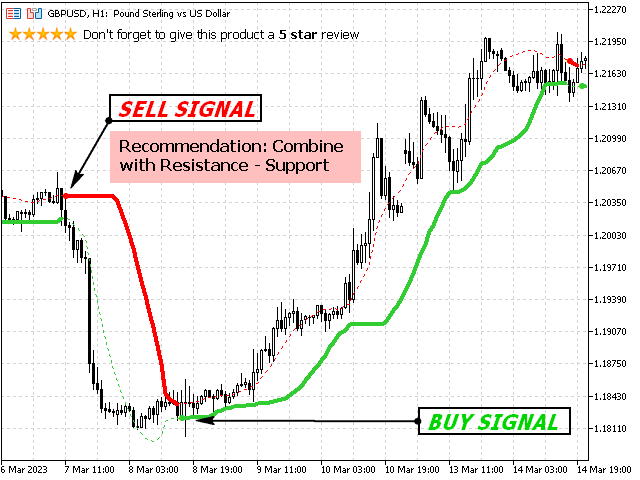
Bollinger Bands Stops Signals - indicator for MetaTrader 5 - mostly can be used two ways: as "trending" indicator; as indicator to be used for stop loss targets. In either case, the "direction" of the current market estimation is displayed, and the target value (when the "direction" will be changed) is displayed in this version — to help in decision making. Parameters are adjusted for the common usage. Some parameters experimenting is advised in any case (to be able to adjust the
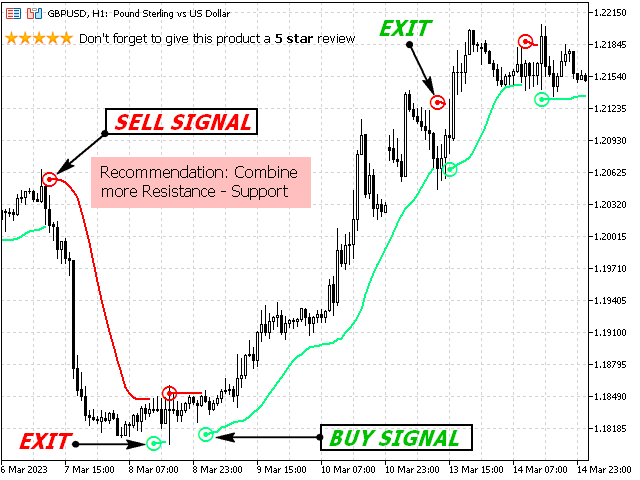
This is a custom technical indicator for Forex trading developed in MQL5 programming language. It is called " Upper Lower 2MA Signs " and to be a trend-following indicator that uses two Moving Average (MA) lines to generate trading signals. The indicator has four plots: two lines and two dots. The first line (indicator 1) is a red line called "Upper" that represents the upper MA line. The second line (indicator 2) is a green line called "Lower" that represents the lower MA line. The
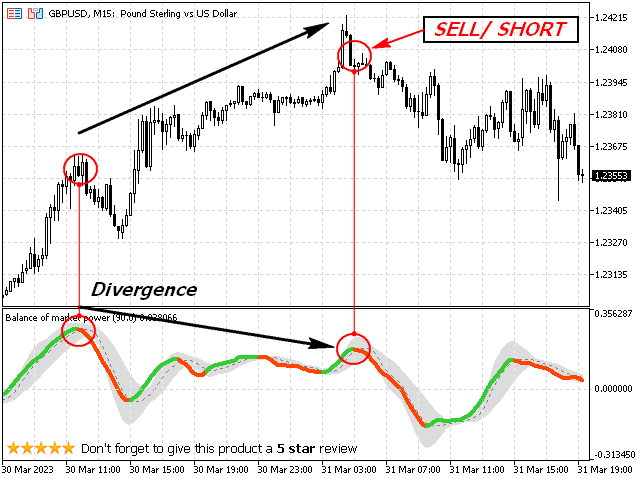
Jurik deviation for BMP (Balance of Market Power) indicator for MetaTrader 5 - This is an oscillator that measures the strength of buyers versus sellers in the market. The indicator's purpose is to identify potential reversal points in the market by showing when there is a shift in the balance of power between buyers and sellers. Bands are calculated using something that could be called "Jurik deviation" instead of using standard deviation and that way this becomes much faster in response
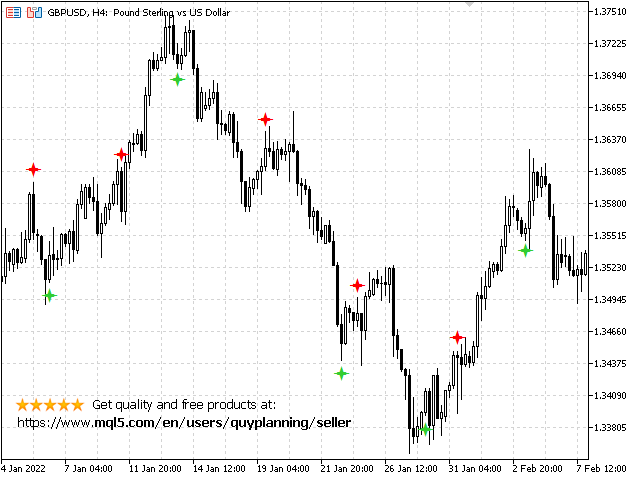
Shuriken Ninja sign - This is an MQL5 indicator displays shuriken Ninja star on the chart to indicate buy or sell signals It have two indicator buffers, one for buy signals and one for sell signals, which allows the user to access the generated signals programmatically. The main features of this indicator are: It uses two oscillators to identify market conditions: the DSS and Bressert oscillators. The indicator generates buy and sell signals based on overbought and oversold conditions in
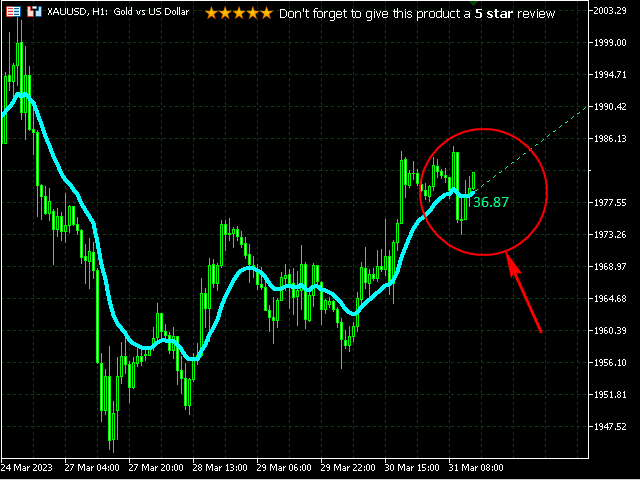
Predict Trend Angle indicator for MetaTrader 5 MT5 - The indicator calculates the inclination angle of the last segment of moving average and shows it in the chart together with the MA line and the line drawn from the last segment of moving average. It has seven input parameters: MA period - MA period; MA method - MA calculation method; Applied price - MA calculation price; Line color - color of the line drawn from the last MA segment; Line width - width
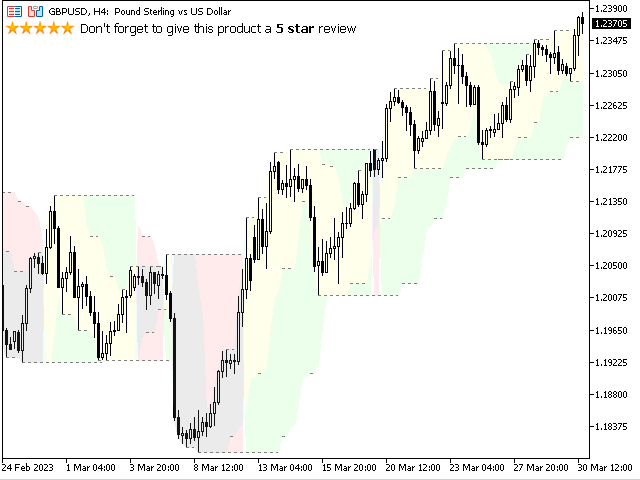
Support Resistance by HH-LL (Highest high & lowest low) indicator for MetaTrader 5 Idea : using the Highest high & lowest low as Support Resistance. It is combining two highest high & lowest low calculations. The "slow" channel formed that way is treated as the "trend" determining channel. The "fast" channel is is the short term channel drawn within the "main" longer term channel. That way you have a combination of fast and slow estimations of SR and short term trends within the
Don't miss out on this powerful tool - download it now for free and start improving your trading strategy today!.. https://www.mql5.com/en/market/product/96254
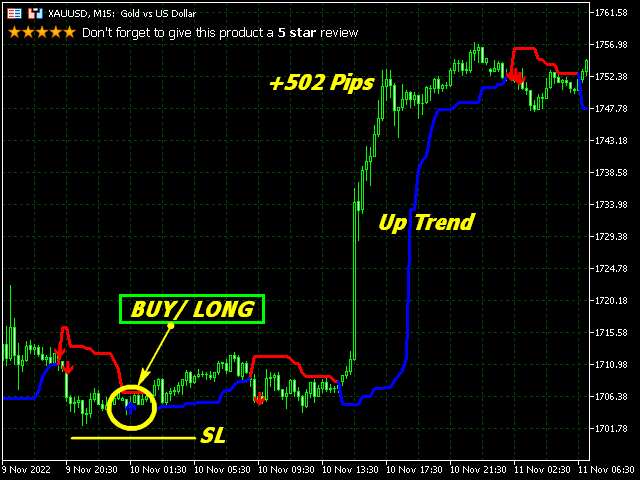
Asymmetric Trending with Arrows - This is a custom trading indicator for the MetaTrader 5 platform, aims to identify asymmetric trends in forex markets by drawing a line and arrows on the price chart. It has two input parameters: Period - calculation period; Percent - "strengthening percent" (*). The main features and benefits of the indicator are: Identification of asymmetric trends : The indicator identifies situations where the price is trending more strongly in one direction


