Luis Paulo Rodrigues Pastor / 판매자
제품 게시

Indicator designed to give investors the advantage of identifying strong candlestick patterns in real time by staining candlesticks representing these patterns, using possible buy or sell performance. The color for each pattern identified by the parameter indicator according to your taste. The candlestick patterns identified by this indicator are: Inside Bar Closing Price Reverse Top (PFRA)
Closing Price Reverse Bottom (PFRB) Dave Landry Bullish Engulf Bearish Engulf Advantages: Real Time At eac

Indicator to mark the opening of the current day, and also the high, low and close of the previous day. It is possible to define which markings will be made and also the colors for each of the markings. It can be used in various trading assets such as Futures Markets, Stock Market, Forex, etc. You can choose to mark just the current day or for all days. When selected to mark only the current day, only that period will be marked on the graph. The markings that this indicator makes are very relev

Indicator designed to measure the distance from the price on a given moving average.
The indicator, in addition to displaying the value of the spacing, has an average of the spacing itself, to assist and confirm analyses. Both the type of the average and the average on which the spacing value will be calculated, as well as the spacing average, are parameterizable.
With the option "SET AUTO LEVEL AND SHOW SIGNALS" enabled, the indicator displays buy and sell signals on the graph. Buy and sell

A very assertive and easy-to-view indicator, which can be used in any financial asset.
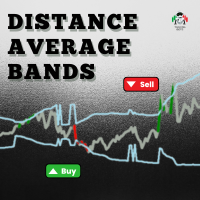
This indicator aims to show moments when the average price deviation in relation to the average deviation exceeds the configured standard deviation.
Step 1: We measure the distance between the price and the average configured in the "MAPrice" parameter;
Step 2: We calculate the average "MADistancePeriod" of the distances measured in Step 1.
Step 3: We calculate the standard deviation "Deviation" from th

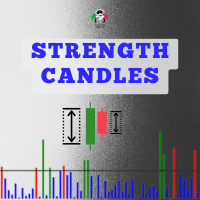
Indicator in histogram format, which is calculated using data on financial volume, tick volume and the body of the bar.
It is possible to visualize moments where there was a large entry of volume, both financial and in ticks, and that the market managed to progress and advance in one direction (up or down) due to the size of the bar body, which is where there really was a victory for one side of the negotiation (buyers and sellers).
By default, all bars in the indicator's histogram are colore