Flavio Javier Jarabeck / 프로필
- 정보
|
5+ 년도
경험
|
87
제품
|
82
데몬 버전
|
|
0
작업
|
0
거래 신호
|
0
구독자
|
Our Motto: Disrupt. All Ways. Always.
🇳🇪🇼🇸 & 🇹🇪🇨🇭🇳🇮🇨🇦🇱 🇸🇺🇵🇵🇴🇷🇹
If you want to follow our latest additions to the MQL5 Marketplace or ask for Support on our products, follow and reach us on Telegram (English/Portuguese/Spanish language group):
https://t.me/MinionsLabsOfficial
Or, choose the way you can follow us in your own environment, at your own pace:
🇼🇪🇧 www.MinionsLabs.com
🇮🇳🇸🇹🇦🇬🇷🇦🇲 www.instagram.com/MinionsLabs
🇾🇴🇺🇹🇺🇧🇪 www.youtube.com/c/MinionsLabs
🇱🇮🇳🇰🇪🇩🇮🇳 www.linkedin.com/in/jarabeck
🇫🇦🇨🇪🇧🇴🇴🇰 www.facebook.com/MinionsLabs
🇹🇼🇮🇹🇹🇪🇷 www.twitter.com/MinionsLabs
🇷🇪🇩🇩🇮🇹 www.reddit.com/r/MinionsLabs/
🇻🇰 www.vk.com/MinionsLabs
🇲🇪🇩🇮🇺🇲 https://medium.com/@MinionsLabs
🇹🇺🇲🇧🇱🇷 http://minionslabs.tumblr.com/
🇹🇪🇱🇪🇬🇷🇦🇲 https://t.me/MinionsLabsOfficial
🇵🇮🇳🇹🇪🇷🇪🇸🇹 https://br.pinterest.com/MinionsLabs/news-from-minions-labs/
Live Long and Prosper.

Imagine a Buy and Sell Pressure monitor on your chart that shows in REAL-TIME this data, bar by bar? Well, imagine no more. We present you an exclusive creation of Minions Labs : Aggression On Bars indicator. On every new bar on you chart this indicator will start counting in real-time the BUY/SELL pressure and present this data statistics directly inside your chart. As soon as a new bar is created in your chart, the counter restarts. Simple and effective. Just watch the video to see it running

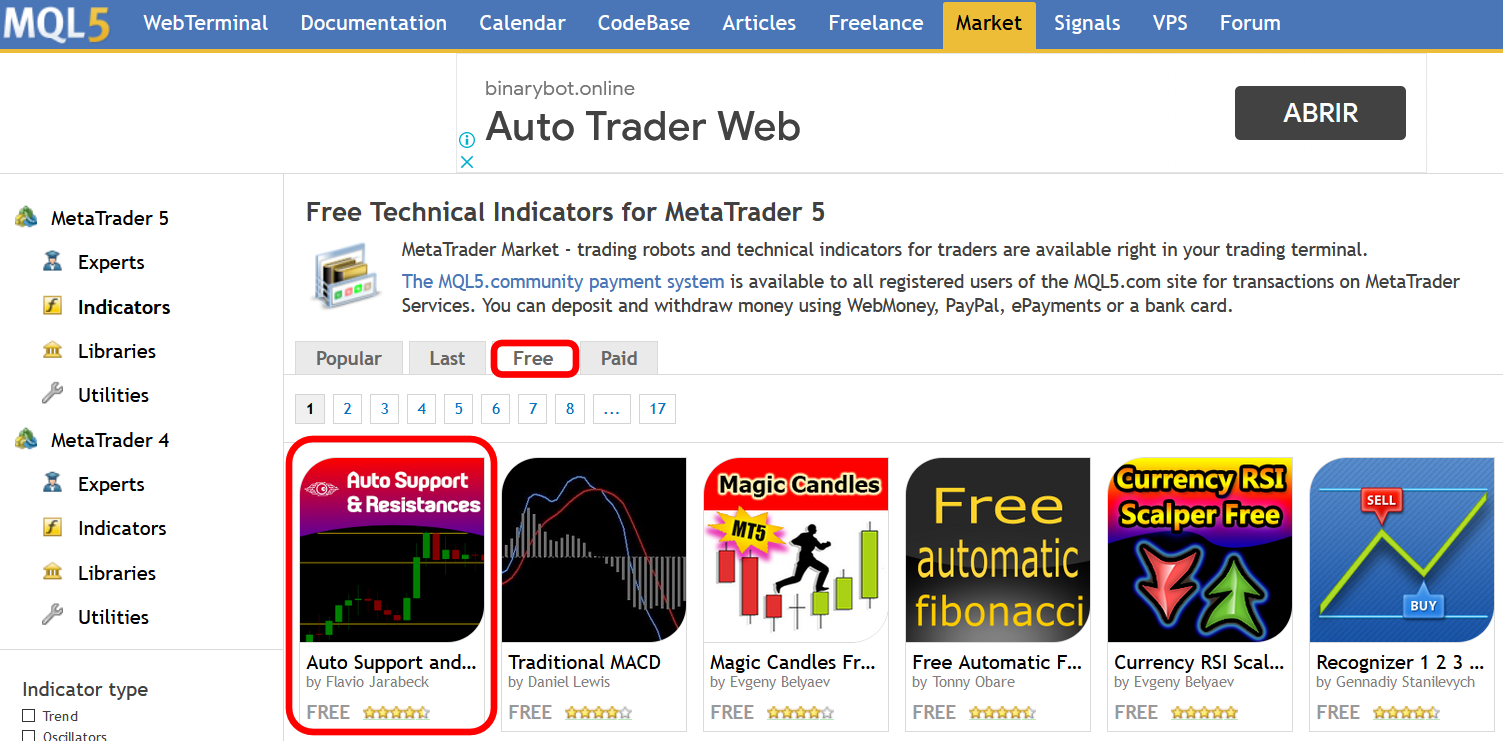
As of today, my Auto Support and Resistances indicator reached (in the FREE category) the first place in the world! And second place in the world on the POPULAR category!


The Hull Moving Average is not very well know in novice and maybe in intermediate trading circles, but it is a very nice solution created by the trader Alan Hull - please visit www.AlanHull.com for full details of his creation. The purpose of this moving average is to solve both problems that all famouse and common moving averages have: Lag and Choppiness . The implementation we did has, apart of the Period configuration and Price type to use in the calculations, a "velocity" factor, which could
Do you want to know how much, how frequent and at what level a candlestick retraces over the previous one, just drop Candles Retracement over your chart and see it visually! Just choose your desired timeframe and the indicator will show it graphically. As simple as that... In addition you have the option to calibrate a Moving Average over this sub-window chart monitor. This indicator could be used to study candle retracements levels so you can comfortably expect during a trade what to expect
Do you love VWAP? So you will love the VWAP Cloud . What is it? Is your very well known VWAP indicator plus 3-levels of Standard Deviation plotted on your chart and totally configurable by you. This way you can have real Price Support and Resistance levels. To read more about this just search the web for "VWAP Bands" "VWAP and Standard Deviation". SETTINGS VWAP Timeframe: Hourly, Daily, Weekly or Monthly. VWAP calculation Type. The classical calculation is Typical: (H+L+C)/3 Averaging Period to
A very useful Price Action point is the previous day Closing VWAP. We call it Big Players Last Fight . This indicator will draw a line showing on your chart what was the last VWAP price of the previous trading session. Simple and effective. As an additional bonus, this indicator saves the VWAP value on the Public Terminal Variables, so you EA could read easily its value! Just for the "Prefix + Symbol name" on the variables list and you will see! SETTINGS How many past days back do you want to
For those Price Action traders who love to trade strong Price points, like today's Opening Price (or even yesterday's Price), here is an indicator to ease the identification of those values, drawn directly on your chart! Opening Price will automatically draw a line showing you this point for you, AND, if you like any OPENing price in the past, not just today's price. A must-have in your Price Action toolbox! SETTINGS How many past days do you want to be drawn? Do you want to draw the current
For those Price Action traders who love to trade strong Price points, like yesterday's HIGH and LOW, here is an indicator to ease the identification of those values, drawn directly on your chart! MIN/MAX of the Day will automatically draw 2 lines showing you those points for you, AND, if you like any HIGH and LOW in the past, not just yesterday's prices. It can also be configured to additionally show today's HIGH and LOW prices - just configure the refresh rate of those lines at your own
This indicator is EXCLUSIVELY to be used on the Brazilian stock exchange "B3". It automatically calculates the yesterday's Settlement Price (Ajuste) of the Symbol "DOL". It uses a mathematical calculation over the ticks received from the borker server, it DOES NOT access external sources (websites, HTTP connections, etc) so it is safe and totally reliable! For practical purposes and to maintain the longevity of the indicator it was added in the Parameters the ability to control the Time Range in
Volume Weighted Average Price (VWAP) is a trading benchmark commonly used by Big Players that gives the average price a Symbol has traded throughout the day. It is based on both Volume and price. Additionally we put in this indicator the MVWAP (Moving Volume Weighted Average Price). For those who do not know the usage and the importance od this indicator I recommend a great article about this subject at Investopedia ( https://www.investopedia.com/articles/trading/11/trading-with-vwap-mvwap.asp

Value Chart indicator presents the Price evolution in a new form. This indicator, Price Momentum , was developed taking all the calculations presented in the book " Dynamic Trading Indicators " by Mark W. Helweg and David Stendahl (2002). The technique involves de-trended Prices from a user-defined Period of analysis and the addition of a Volatility index correction. The result is an Oscillator with 3 zones: Fair Price Value, Overbought/Oversold and Extremely Overbought/Oversold zones. Adding


