Ashkan Hazegh Nikrou / 프로필
- 정보
|
6+ 년도
경험
|
28
제품
|
50
데몬 버전
|
|
90
작업
|
1
거래 신호
|
0
구독자
|
내 서비스를 이용하고 아래 링크를 클릭하여 거래 전략을 만들어 보세요:
https://www.mql5.com/en/job/new?prefered=ashkan.nikrou
저는 외환 시장을 위한 신뢰할 수 있는 전략을 만들기 위해 열심히 노력하고 있습니다. 제 제품 페이지를 방문하고 제 외환 솔루션을 테스트해보세요:
https://www.mql5.com/en/users/ashkan.nikrou/seller#products
MSB (Market Structure Break Out) Article :
https://www.mql5.com/en/blogs/post/755387
YouTube에서 제 외환 비디오를 시청하세요:
https://www.mql5.com/en/blogs/post/740668
ProEngulfing 채널에 가입해보세요:
https://www.mql5.com/en/channels/proengulfing
Ashkan Hazegh Nikrou

new version of Market Structure Break Out(MSB) is contain trend line , most power full signals appear on trend line, like this image :
https://www.mql5.com/en/market/product/109958
https://www.mql5.com/en/market/product/109958

Ashkan Hazegh Nikrou
Congratulation , Market Structure Break Out(MSB) has been upgraded to version 1.7
upgrade information is :
🚀 MarketStructureBreakOut v1.7 Update 🚀
We’ve added two trendlines for each direction:
🟢 Buy Direction: Green trendlines connect the latest higher low of the structure.
🔴 Sell Direction: Red trendlines connect the latest lower high of the structure.
Test Demo Version Now :
https://www.mql5.com/en/market/product/109958
Ashkan Hazegh Nikrou

What do you know about ProEngulfing ?
ProEngulfing is indicator can detect profesional engulf patter, it means qualified engulf pattern, based on body size , shadow some more parameters like ATR and distance from moving average
Find more here :
https://www.mql5.com/en/market/product/52023
ProEngulfing is indicator can detect profesional engulf patter, it means qualified engulf pattern, based on body size , shadow some more parameters like ATR and distance from moving average
Find more here :
https://www.mql5.com/en/market/product/52023

소셜 네트워크에 공유 · 1
Ashkan Hazegh Nikrou

Welcome to our free FVG Indicator
Download it for free now
https://www.mql5.com/en/market/product/108907
Download it for free now
https://www.mql5.com/en/market/product/108907

Ashkan Hazegh Nikrou

Our research on Market Structure Break Out Indicator show higher win rate when ATR is less
We have upgraded this power full indicator to new version by ATR Filter and we reached better performance now.
Visit latest update here :
https://www.mql5.com/en/market/product/109958
We have upgraded this power full indicator to new version by ATR Filter and we reached better performance now.
Visit latest update here :
https://www.mql5.com/en/market/product/109958

Ashkan Hazegh Nikrou
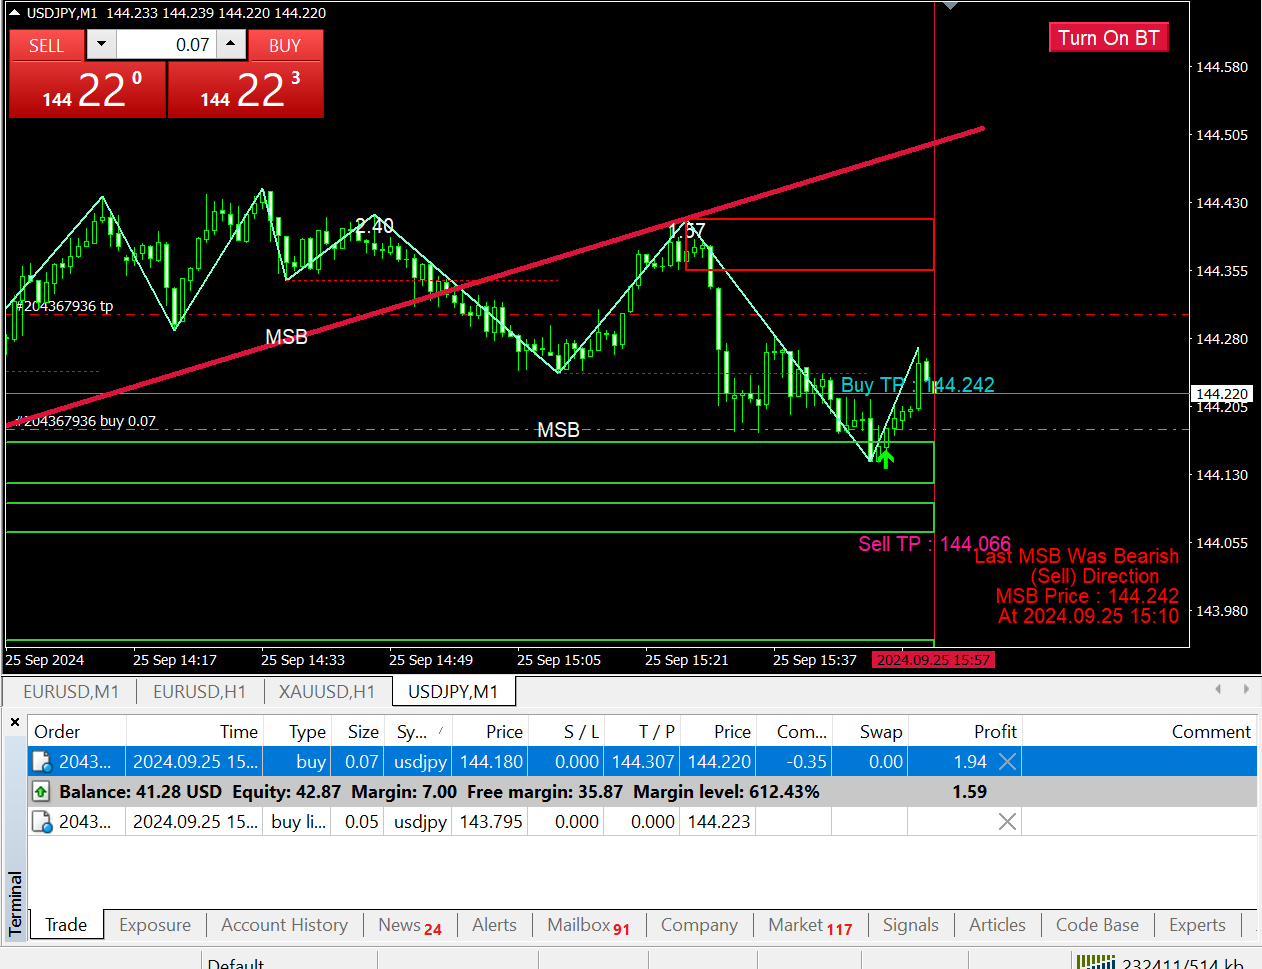

Real Buy Trade By MSB Indicator Signal.
Market Structure Break Out Show Buy Signal On USDJPY on M1
https://www.mql5.com/en/market/product/109958
Market Structure Break Out Show Buy Signal On USDJPY on M1
https://www.mql5.com/en/market/product/109958

소셜 네트워크에 공유 · 2
Ashkan Hazegh Nikrou
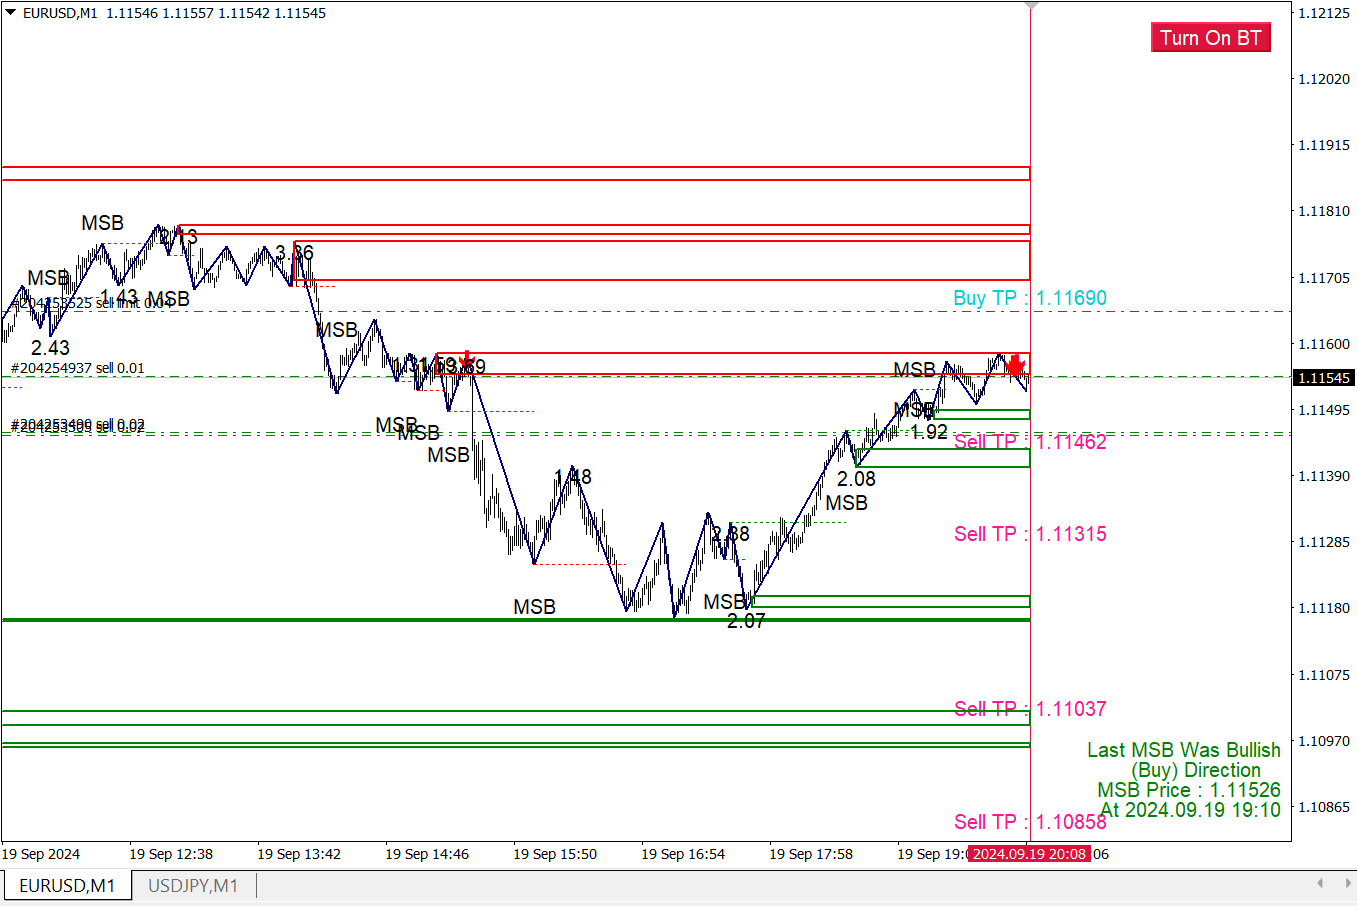
Market Structure Break Out Upgraded To Version1.6
https://www.mql5.com/en/market/product/109958
https://www.mql5.com/en/market/product/109958

소셜 네트워크에 공유 · 1
Ashkan Hazegh Nikrou
🌟 What is Market Structure? 🌟
Market structure refers to the arrangement and behavior of price movements within a financial market. It’s like the DNA of price action! Understanding market structure helps traders identify trends, reversals, and potential breakout points.
🚀 Market Structure Breakout 🚀
A breakout occurs when price decisively moves beyond a significant level—like a coiled spring suddenly released! Market structure breakouts can lead to powerful trading opportunities. Keep an eye out for those key support or resistance levels getting breached.
💡 Supply and Demand 💡
Supply and demand are the heartbeat of any market. When demand exceeds supply, prices rise (bullish). Conversely, when supply overtakes demand, prices fall (bearish). Our indicator combines these essential concepts to give you a fresh perspective on the charts!
🔗 Welcome to the Combination of Market Structure and Supply Demand! 🔗
https://www.mql5.com/en/market/product/109958
Ashkan Hazegh Nikrou

Welcome to Free Indicator, this is Your Chart, Your Chart is chart maker , can create custom charts like M2 , M35 and other custom combinations you need, download it for free here :
https://www.mql5.com/en/market/product/123133
https://www.mql5.com/en/market/product/123133

소셜 네트워크에 공유 · 1
Ashkan Hazegh Nikrou
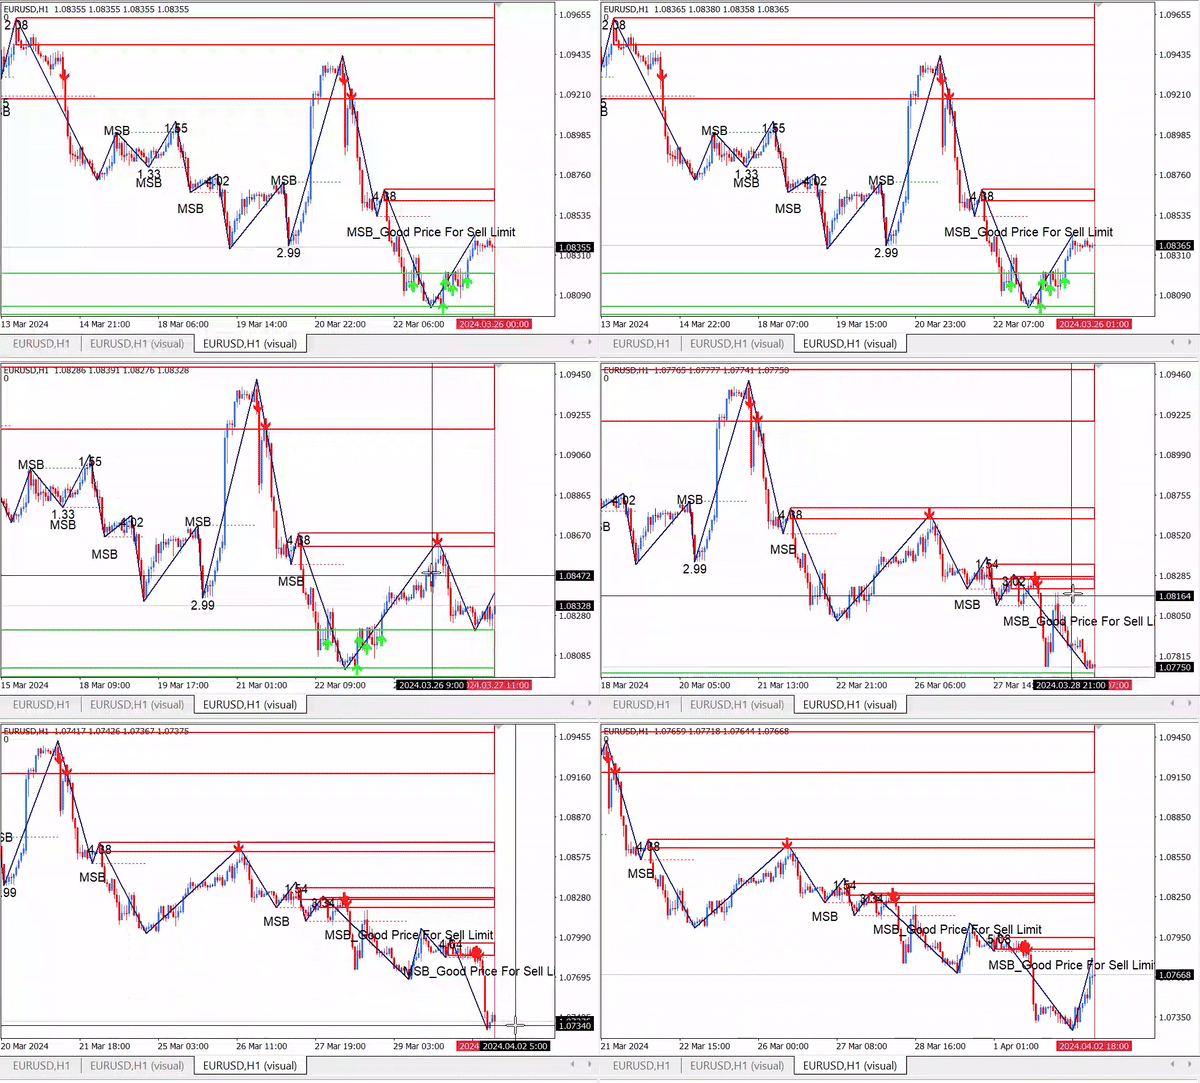
New Label That Show Where Is The Best Price For Place Pending (Market Structure Break Out)
https://www.mql5.com/en/market/product/109958
https://www.mql5.com/en/market/product/109958

소셜 네트워크에 공유 · 1
Ashkan Hazegh Nikrou
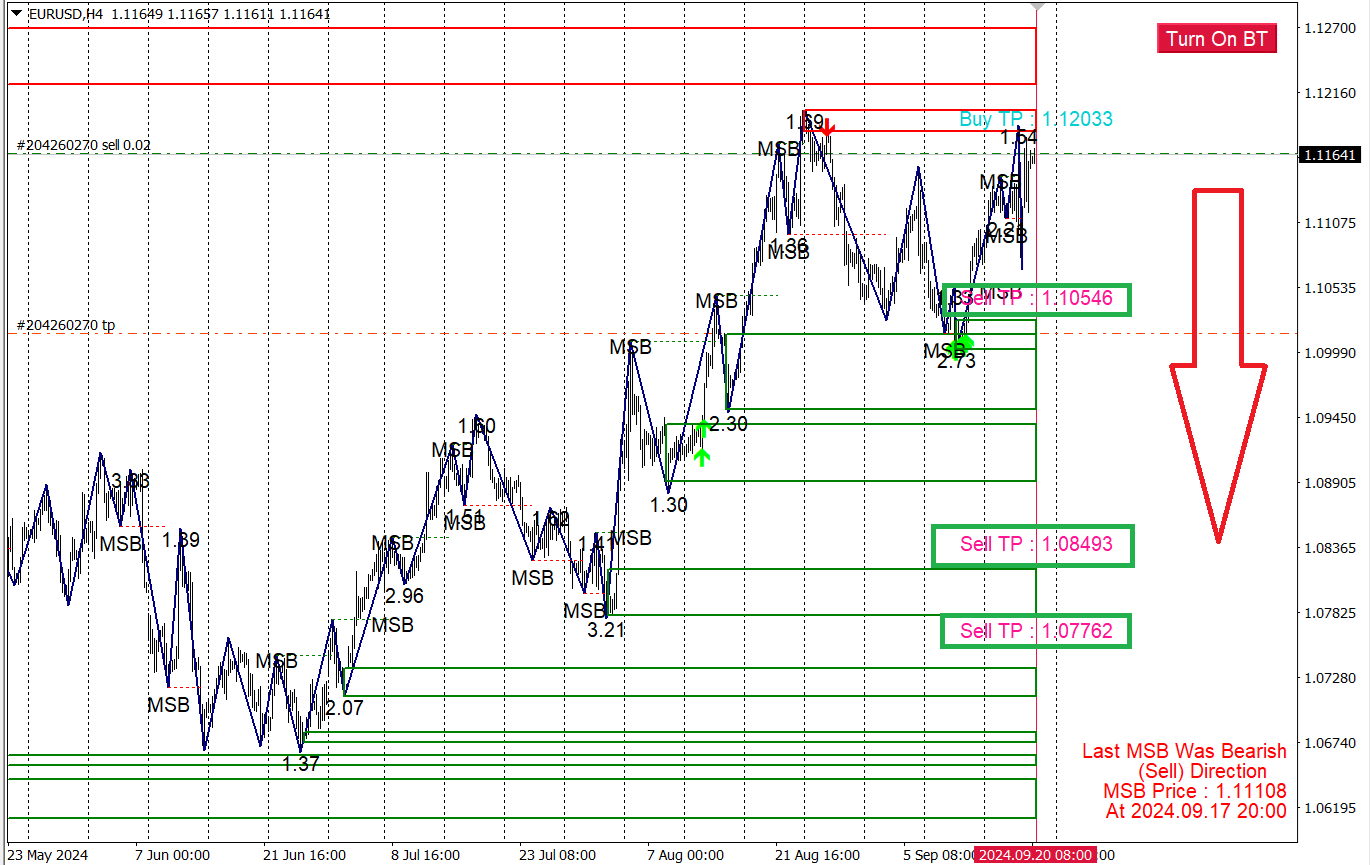
EURUSD Analysis Based On Market Structure Break Out Indicator :
We are in H4 power full supply zone , we have potential for bearish movement, we you see in this image , we have some unbroken demands they can work as our targets on Next Bearish Movement.
Nice Time For Open Sell Position
Find More About MSB Indicator Here :
https://www.mql5.com/en/market/product/109958

Ashkan Hazegh Nikrou

Exciting Update: New Version of Market Structure Breakout Coming Soon!
We're thrilled to announce the release of the latest version of our Market Structure Breakout indicator, packed with powerful new features to enhance your trading experience! 🚀
✨ What’s New:
Buy & Sell Targets: Get clear insights on the best take profit levels for both buy and sell positions.
Last MSB Direction: Stay informed with a display of the most recent Market Structure Breakout direction for better decision-making.
Enhanced Visual Modes: Customize your chart with new beauty modes for light, dark, or personalized themes.
Live Backtest Toggle: Easily turn live backtesting on or off with the new on-screen button.
Stay tuned – the new version will be available in the market in just a few hours! 🌟
https://www.mql5.com/en/market/product

Ashkan Hazegh Nikrou

Our New Free Product Is Here
Your Chart
Your Chart is custom chart maker can marge some candles in one and draw new chart based on your custom setting, Find out more and download it for free by link below :
https://www.mql5.com/en/market/product/123133
Your Chart
Your Chart is custom chart maker can marge some candles in one and draw new chart based on your custom setting, Find out more and download it for free by link below :
https://www.mql5.com/en/market/product/123133

Ashkan Hazegh Nikrou
출시돈 제품
Your Chart 인디케이터로 트레이딩 경험을 향상시키세요! 이 무료이면서 고도로 커스터마이징 가능한 도구는 여러 시간대를 하나의 깔끔한 캔들 차트로 통합하여 원본 차트를 변경하지 않고 표시할 수 있습니다. Your Chart를 사용하면 각 맞춤형 캔들에 대한 바의 개수를 설정할 수 있습니다. 예를 들어, M1 차트의 18개 캔들을 하나로 결합하여 시장 트렌드를 더 넓은 시각으로 볼 수 있습니다. 주요 기능: 맞춤형 캔들 생성 : 하나의 캔들로 합칠 바의 개수를 선택하여 유연한 시장 뷰를 제공합니다. 비침투적 디자인 : 원본 차트 데이터는 그대로 유지되며, 맞춤형 캔들은 오버레이로 그려져 캔들의 본체와 그림자를 표시합니다. 색상 사용자 정의 : 상승 및 하락 방향의 캔들 색상을 원하는 대로 설정할 수 있습니다. 간소화된 트레이딩 : 차트 뷰를 맞춤화하여 트레이더는 독특한 인사이트와 보다 개인화된 가격 움직임에 대한 시각적 관점을 얻을 수 있습니다. MetaTrader 4의 단순성을
Ashkan Hazegh Nikrou
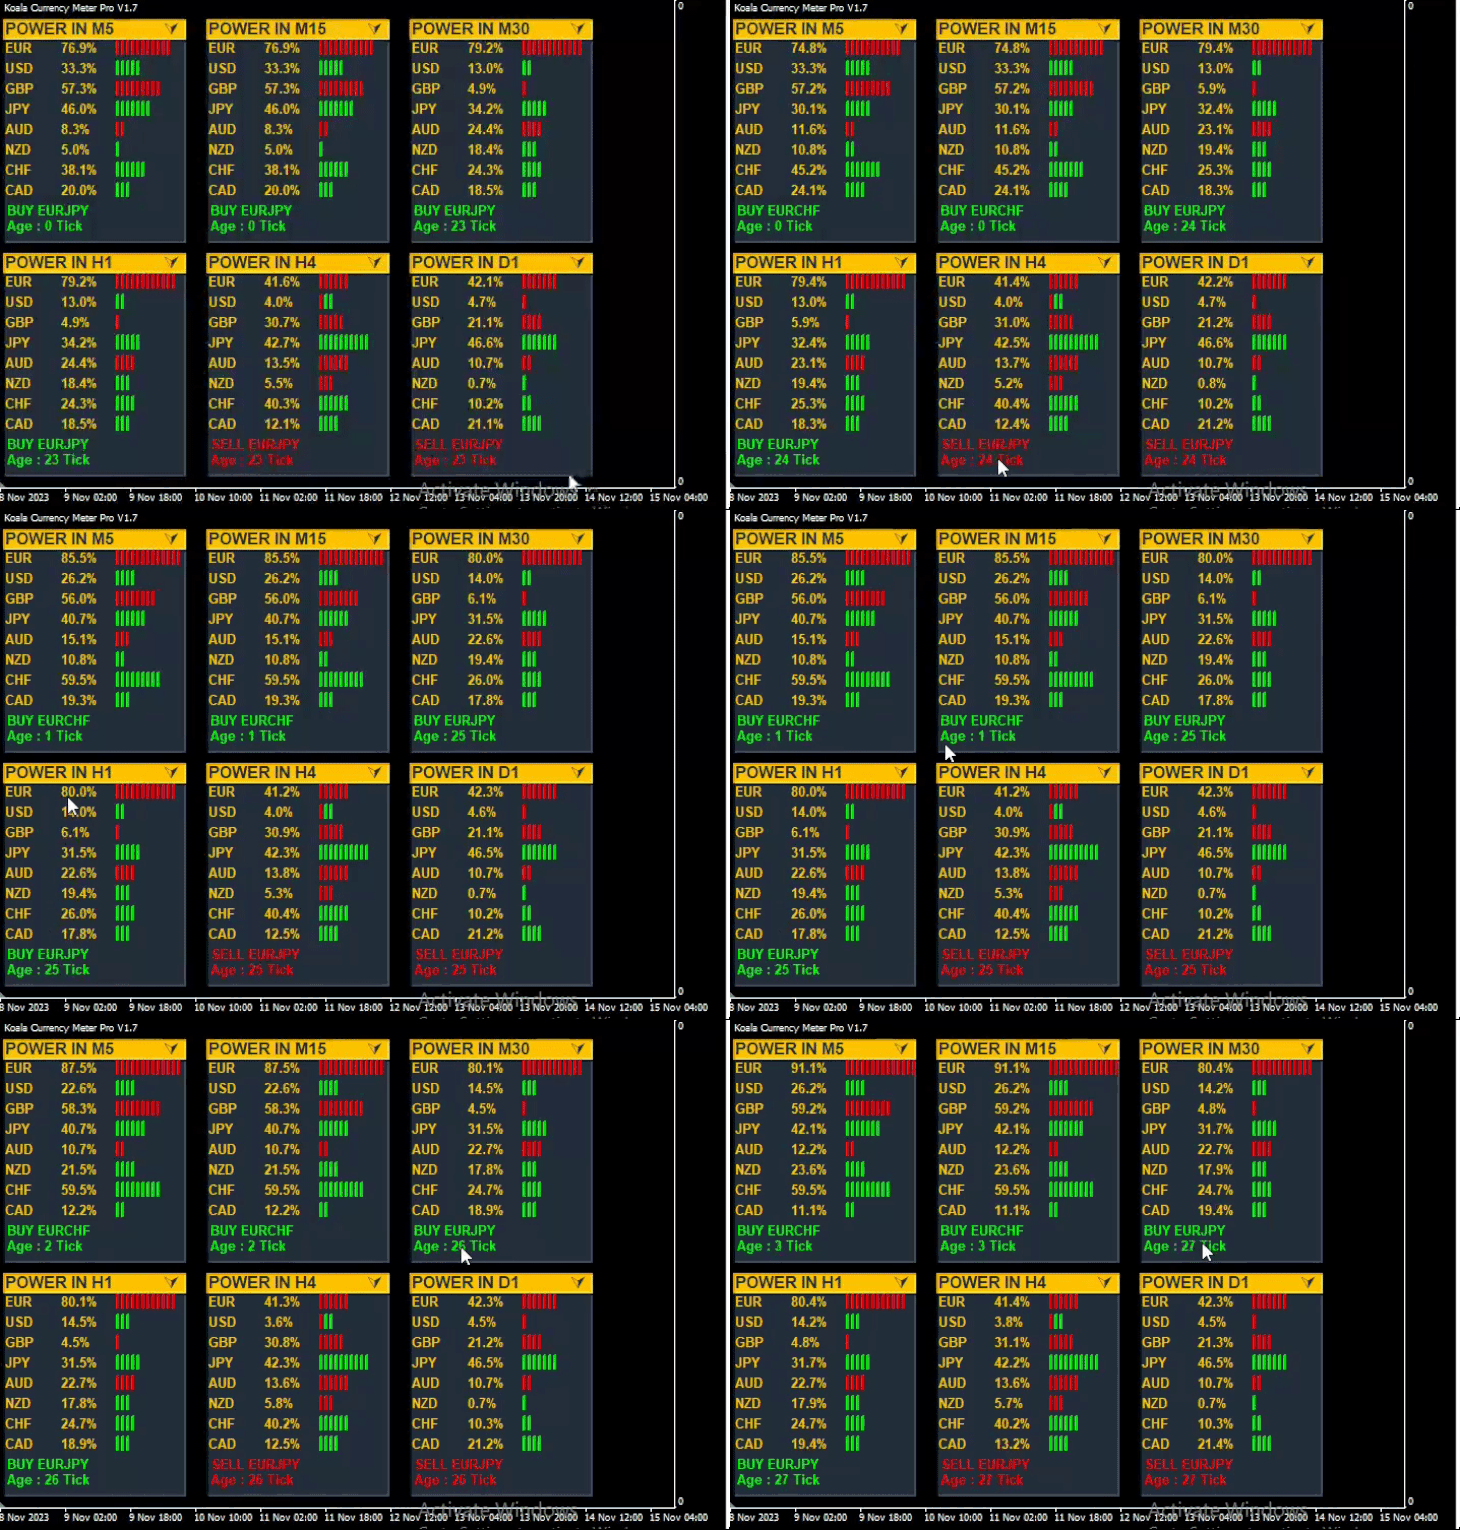
Find out currency meter here , it can be guide trader to find out each currency power
https://www.mql5.com/en/market/product/51181
https://www.mql5.com/en/market/product/51181

Ashkan Hazegh Nikrou

Did you see new trade assistant ability ?
Doing Trade Easier Than Ever
https://www.mql5.com/en/market/product/114546
Doing Trade Easier Than Ever
https://www.mql5.com/en/market/product/114546

Ashkan Hazegh Nikrou
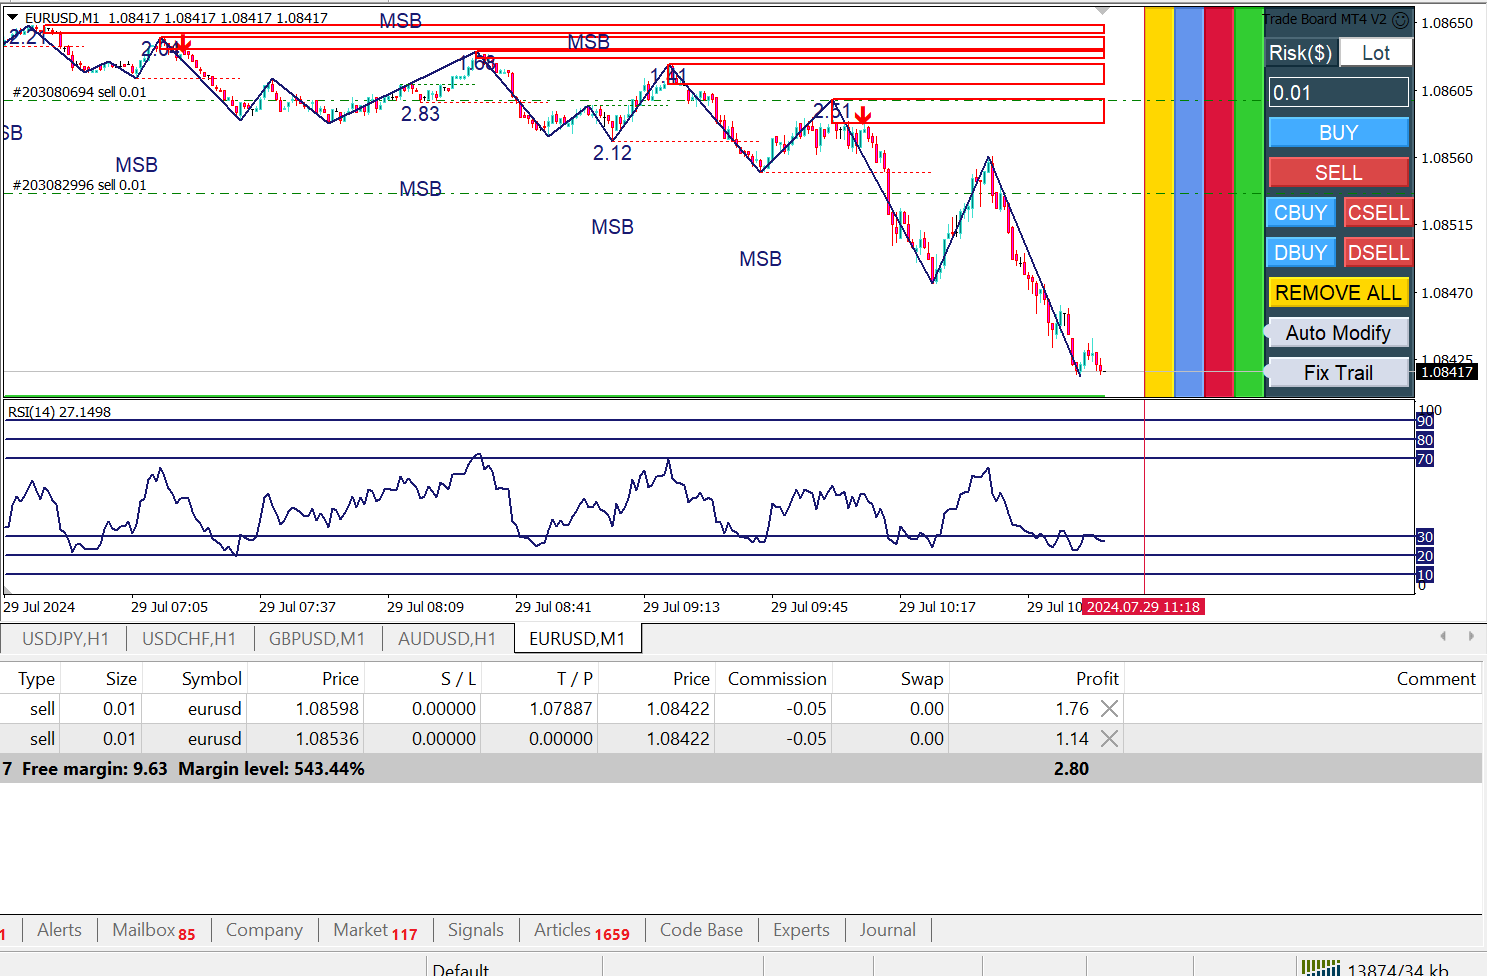
Today I am in SELL on EURUSD , Based on Trend i have detected by MSB indicator
https://www.mql5.com/en/market/product/109958
https://www.mql5.com/en/market/product/109958

Ashkan Hazegh Nikrou
https://www.mql5.com/en/market/product/108907
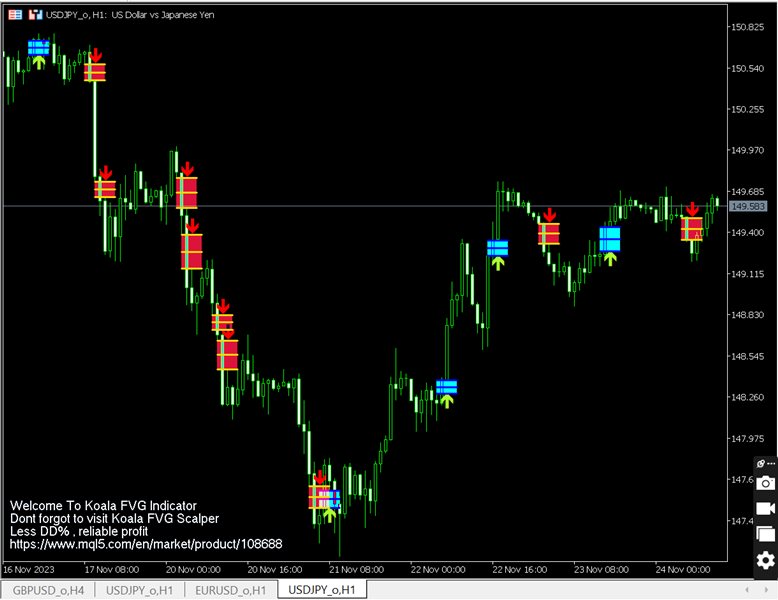
Welcome to free tools, this time FVG indicator,
FVG or Fair Value Gap form when market has sharp movement, in most of cases FVG point retouch by retrace market and again market will continue its own direction,
So FVG can be good point for entry in direction
Welcome to free tools, this time FVG indicator,
FVG or Fair Value Gap form when market has sharp movement, in most of cases FVG point retouch by retrace market and again market will continue its own direction,
So FVG can be good point for entry in direction

Ashkan Hazegh Nikrou
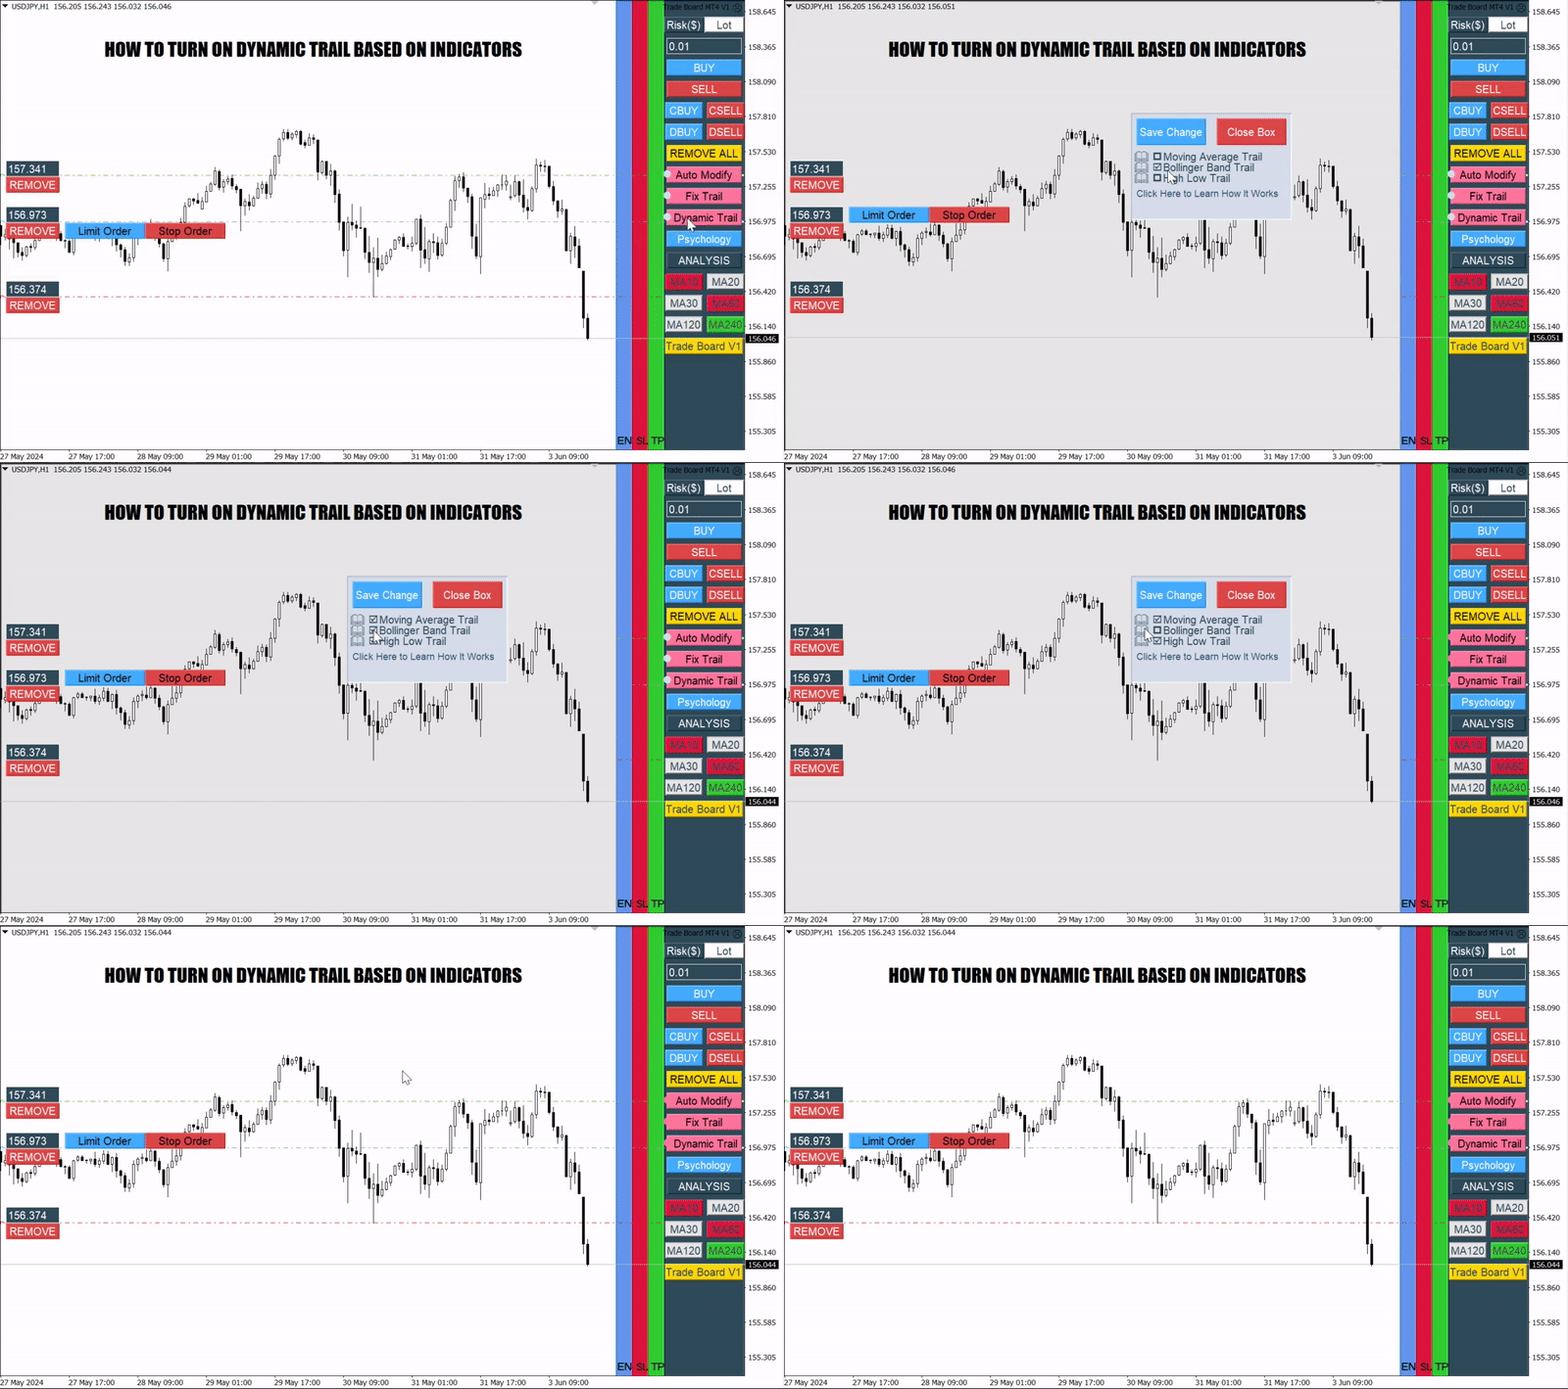
How to use dynamic trailing stop
Dynamic trailing stop is trail based on moving average , Bollinger band and last supply demand
Find out more here in Trade Board
https://www.mql5.com/en/market/product/114546
Dynamic trailing stop is trail based on moving average , Bollinger band and last supply demand
Find out more here in Trade Board
https://www.mql5.com/en/market/product/114546

:

