Van Nhan Huynh / 판매자
제품 게시

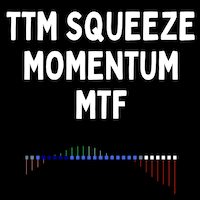
This indicator is based on John Carter's "TTM Squeeze" volatility indicator, as discussed in his book "Mastering the Trade". In this version, this indicator has some improved features: Multiple timeframes (MTF) is supported. You can analyze multiple timeframes in the same window. Histogram is plotted in a different way to help reduce noise. 3 customizable thresholds to help adjust when the dots change color. The dot color indicates the market volatility: d ark blue: very low volatility blue: low

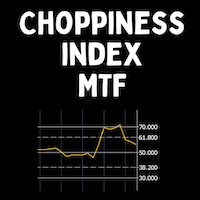
The Choppiness Index was created by Australian commodity trader E.W. Dreiss. It is designed to determine if the market is choppy (trading sideways) or not choppy (trading within a trend in either direction). A basic understanding of the indicator would be; higher values equal more choppiness, while lower values indicate directional trending. The values operate between 0 and 100. The closer the value is to 100, the higher the choppiness (sideways movement) levels. The closer the value is to 0,