Hans Raj Goswami / 프로필
- 정보
|
no
경험
|
0
제품
|
0
데몬 버전
|
|
0
작업
|
7
거래 신호
|
0
구독자
|
Hans Raj Goswami

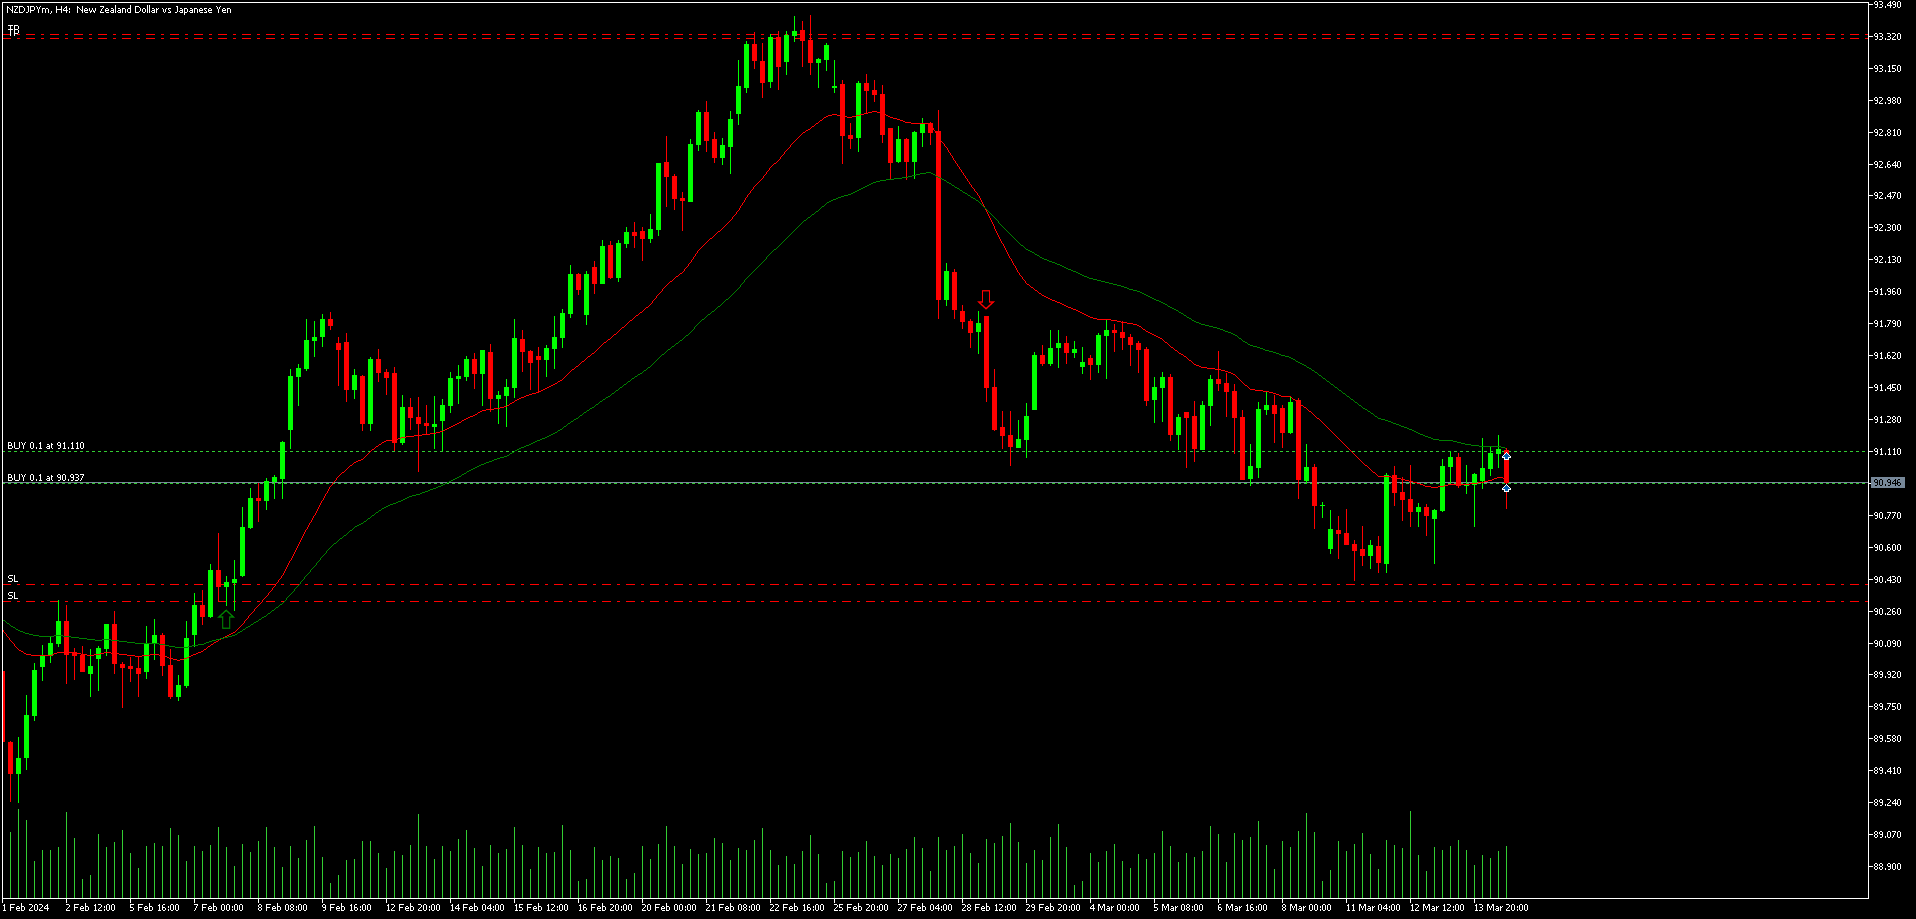
Current Price: 91.100 (as of your prompt, actual price may vary) (March 14, 2024, 18:20pm IST)
Target: 93.310
Stop Loss: 90.310
Analysis:
Since I cannot access live charts and historical data, this analysis is based on general technical indicators and should not be considered financial advice.
Moving Averages:
A 20-day or 50-day moving average crossing above a 100-day or 200-day moving average (golden crossover) could indicate an upward trend.
Check if the price is currently above its short-term moving averages (e.g., 20-day) and if there's recent upward momentum.
Relative Strength Index (RSI):
An RSI value below 30 suggests the currency might be oversold, potentially indicating a buying opportunity.
If the RSI is currently below 30 and has recently turned upward, it could signal a potential reversal towards the upside.
Support and Resistance:
Identify any support levels (areas where the price has bounced off previously) near the current price or below.
A break above a resistance level (areas where the price has struggled to surpass previously) could indicate a continuation of the uptrend.
Trade Justification:
If the above indicators suggest a potential uptrend (golden crossover, RSI below 30 and rising, break above resistance), the long trade from 91.100 with a target of 93.310 could be justified.
Risk Management:
The stop loss is placed at 90.310, maintaining a reasonable risk-reward ratio (ideally, at least 1:2).
Always place a stop loss to limit potential losses.
Additional Considerations:
This is a limited analysis based on basic indicators. Consider incorporating other technical indicators like MACD or Stochastic Oscillator for a more comprehensive view.
Fundamental factors like economic data, central bank policies, and risk sentiment can also impact the NZDJPY pair. Analyze these factors alongside technical indicators for a well-rounded trading decision.

: