Symbol Strength Meter
- 지표
- Mohammad Ali Ghaffari
- 버전: 1.0
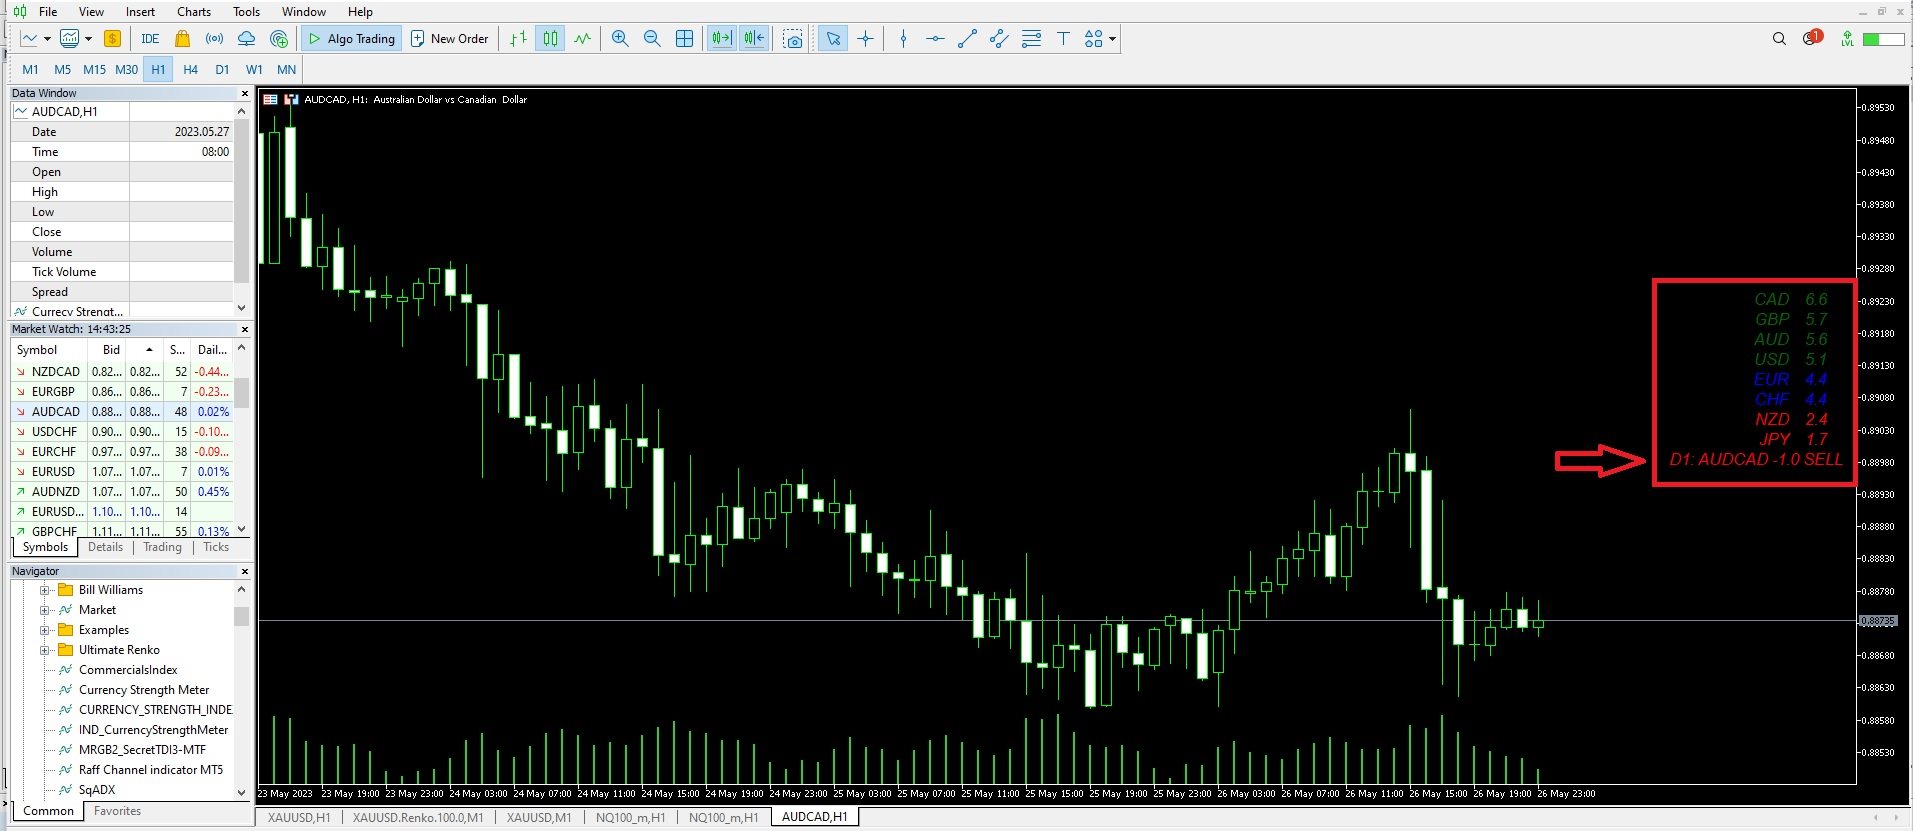
The seven currencies mentioned are:
- GBP (British Pound): This is the currency of the United Kingdom.
- AUD (Australian Dollar): This is the currency of Australia.
- NZD (New Zealand Dollar): This is the currency of New Zealand.
- USD (United States Dollar): This is the currency of the United States.
- CAD (Canadian Dollar): This is the currency of Canada.
- CHF (Swiss Franc): This is the currency of Switzerland.
- JPY (Japanese Yen): This is the currency of Japan.
Currency strength indexes provide a way to assess the performance of a currency relative to others in the foreign exchange market. These indexes can be calculated using various methods, such as comparing exchange rates, trade balances, interest rates, and economic indicators.
By analyzing currency strength indexes, traders and investors can make informed decisions about currency trading and investment opportunities. A stronger currency index suggests that a currency is performing well compared to others, while a weaker currency index indicates relative underperformance.
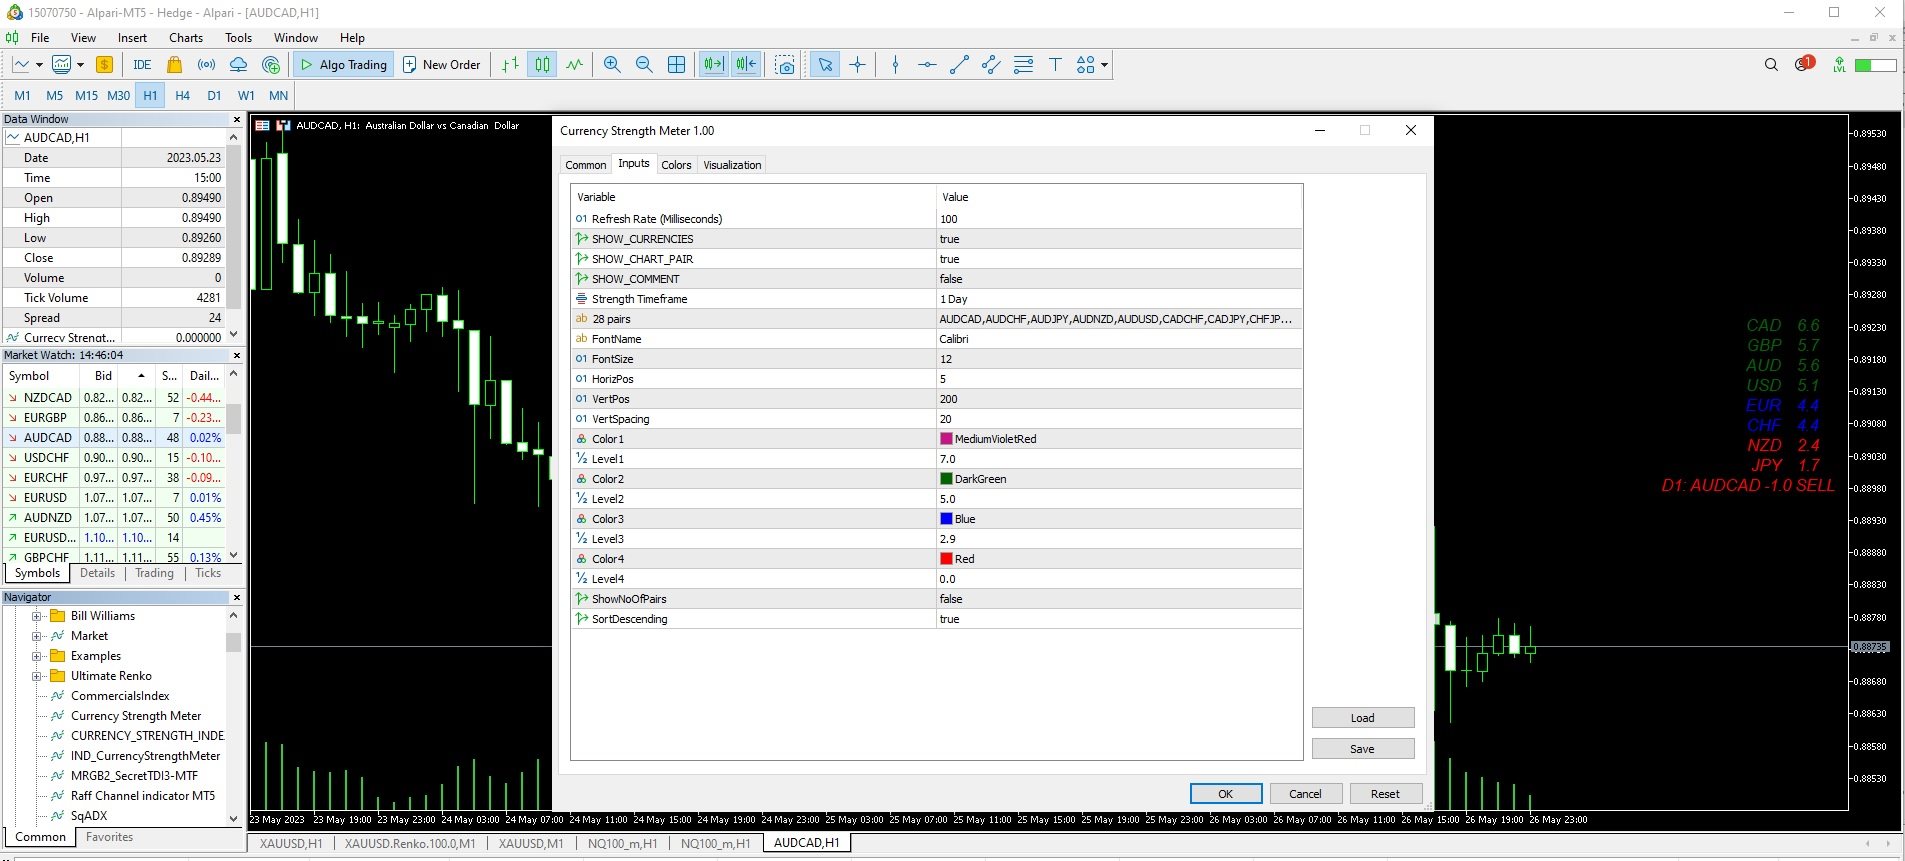

it works great for me. I have several installations with different TFs on one chart