Abcde MT4
- 지표
- Mahsa Farjami
- 버전: 1.0
- 활성화: 5
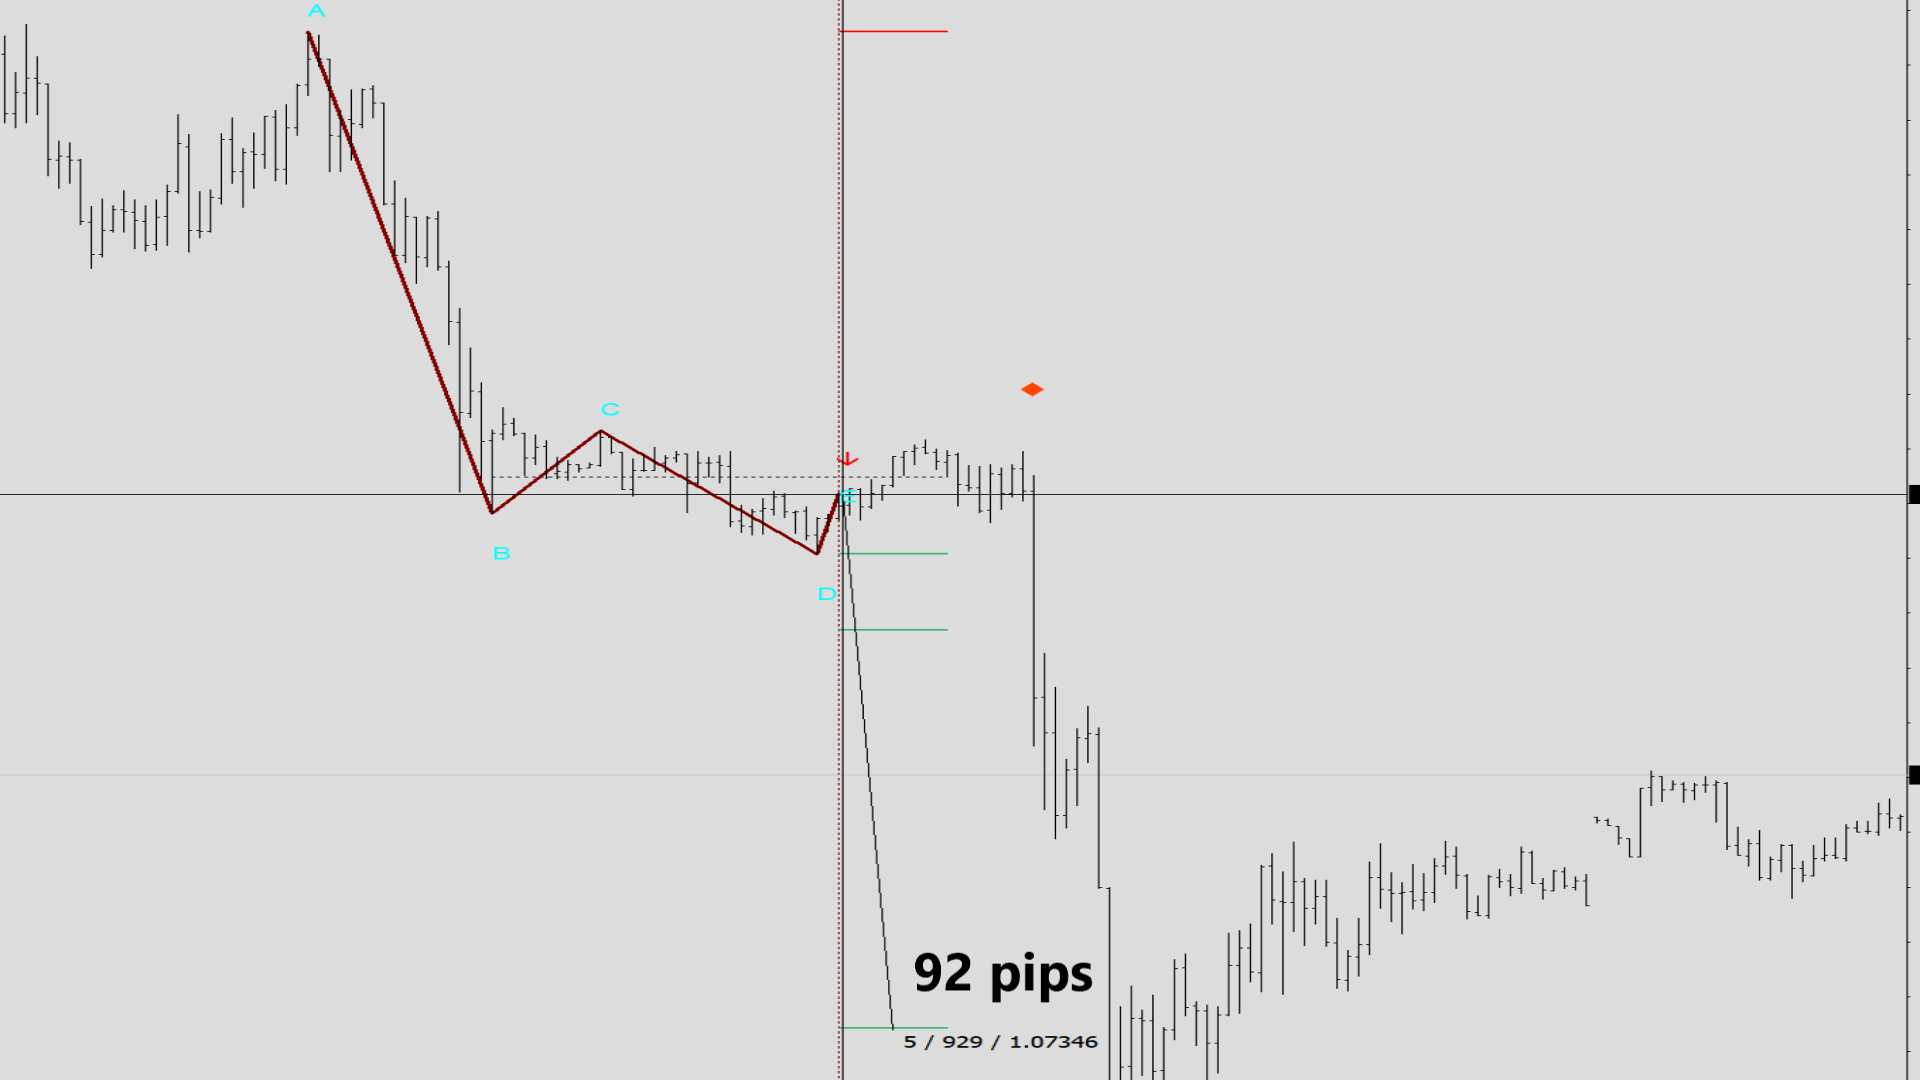
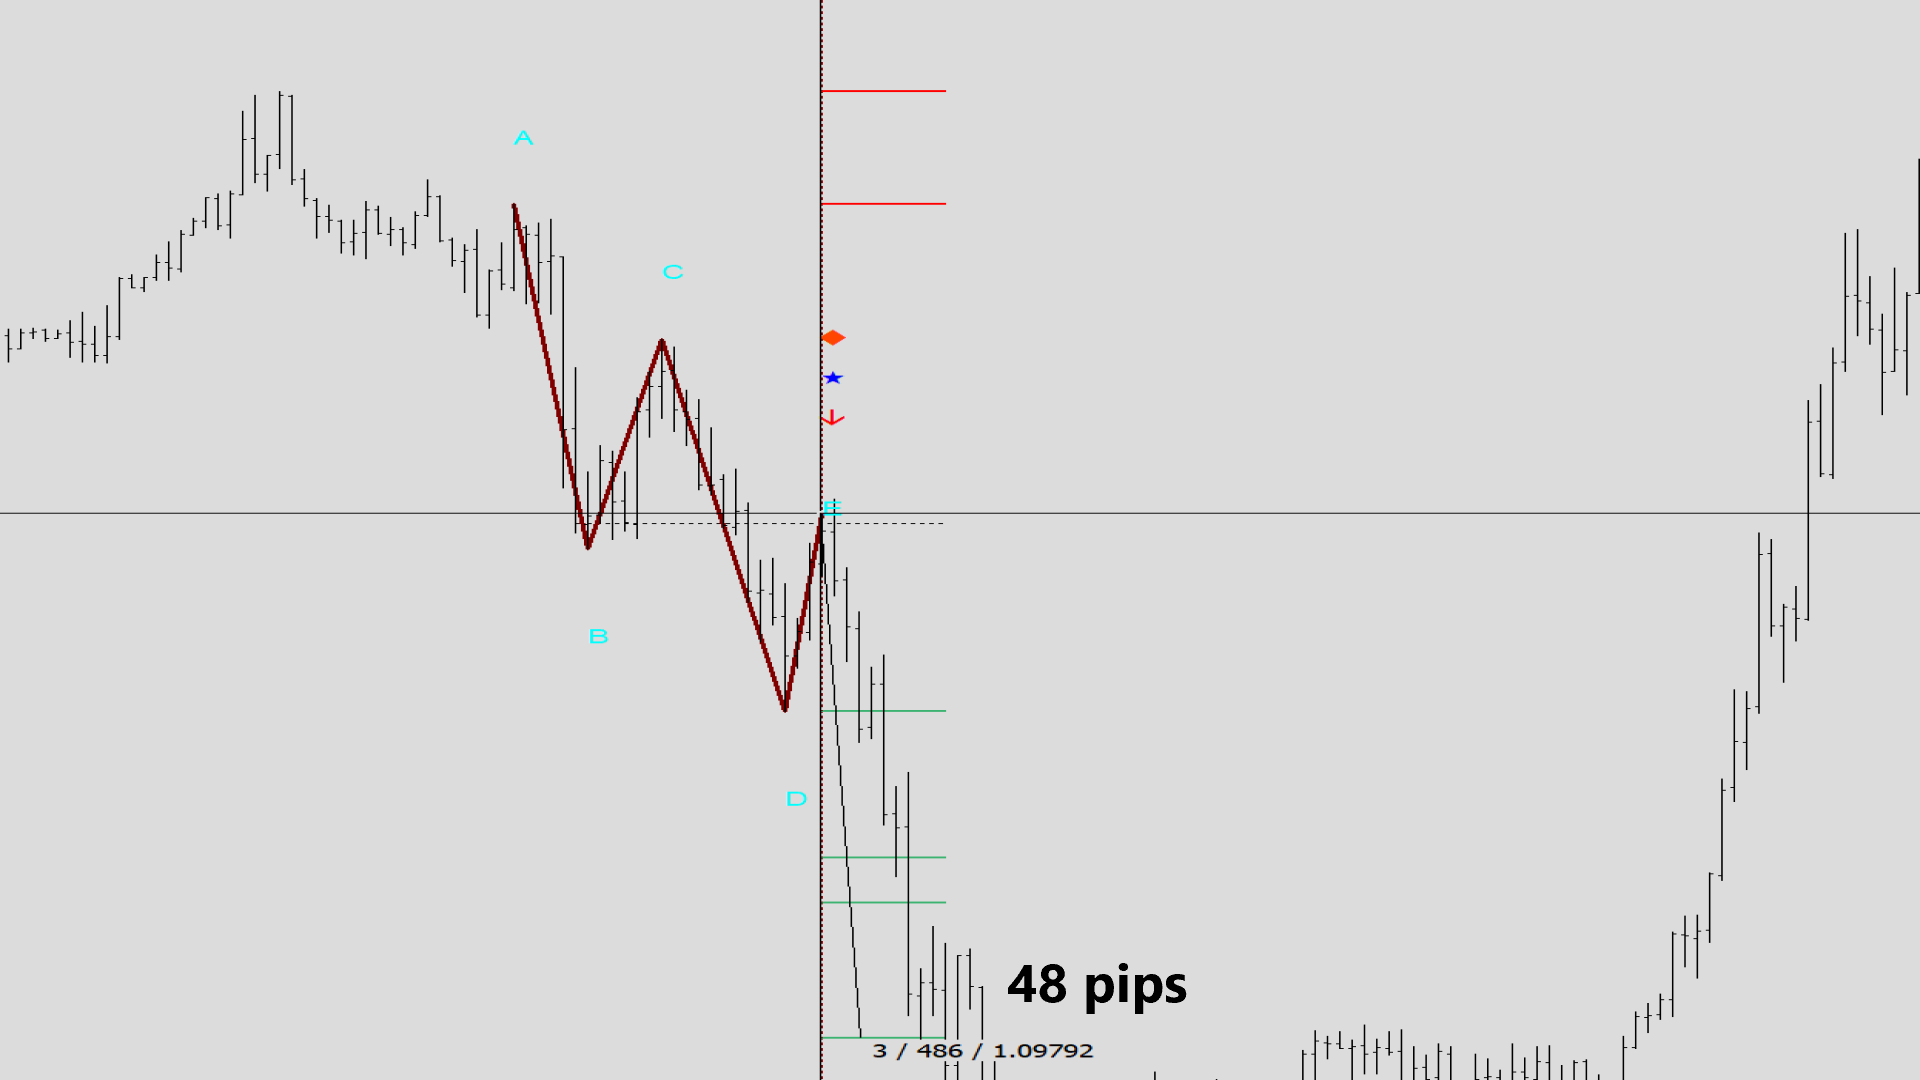
ABCDE 지표
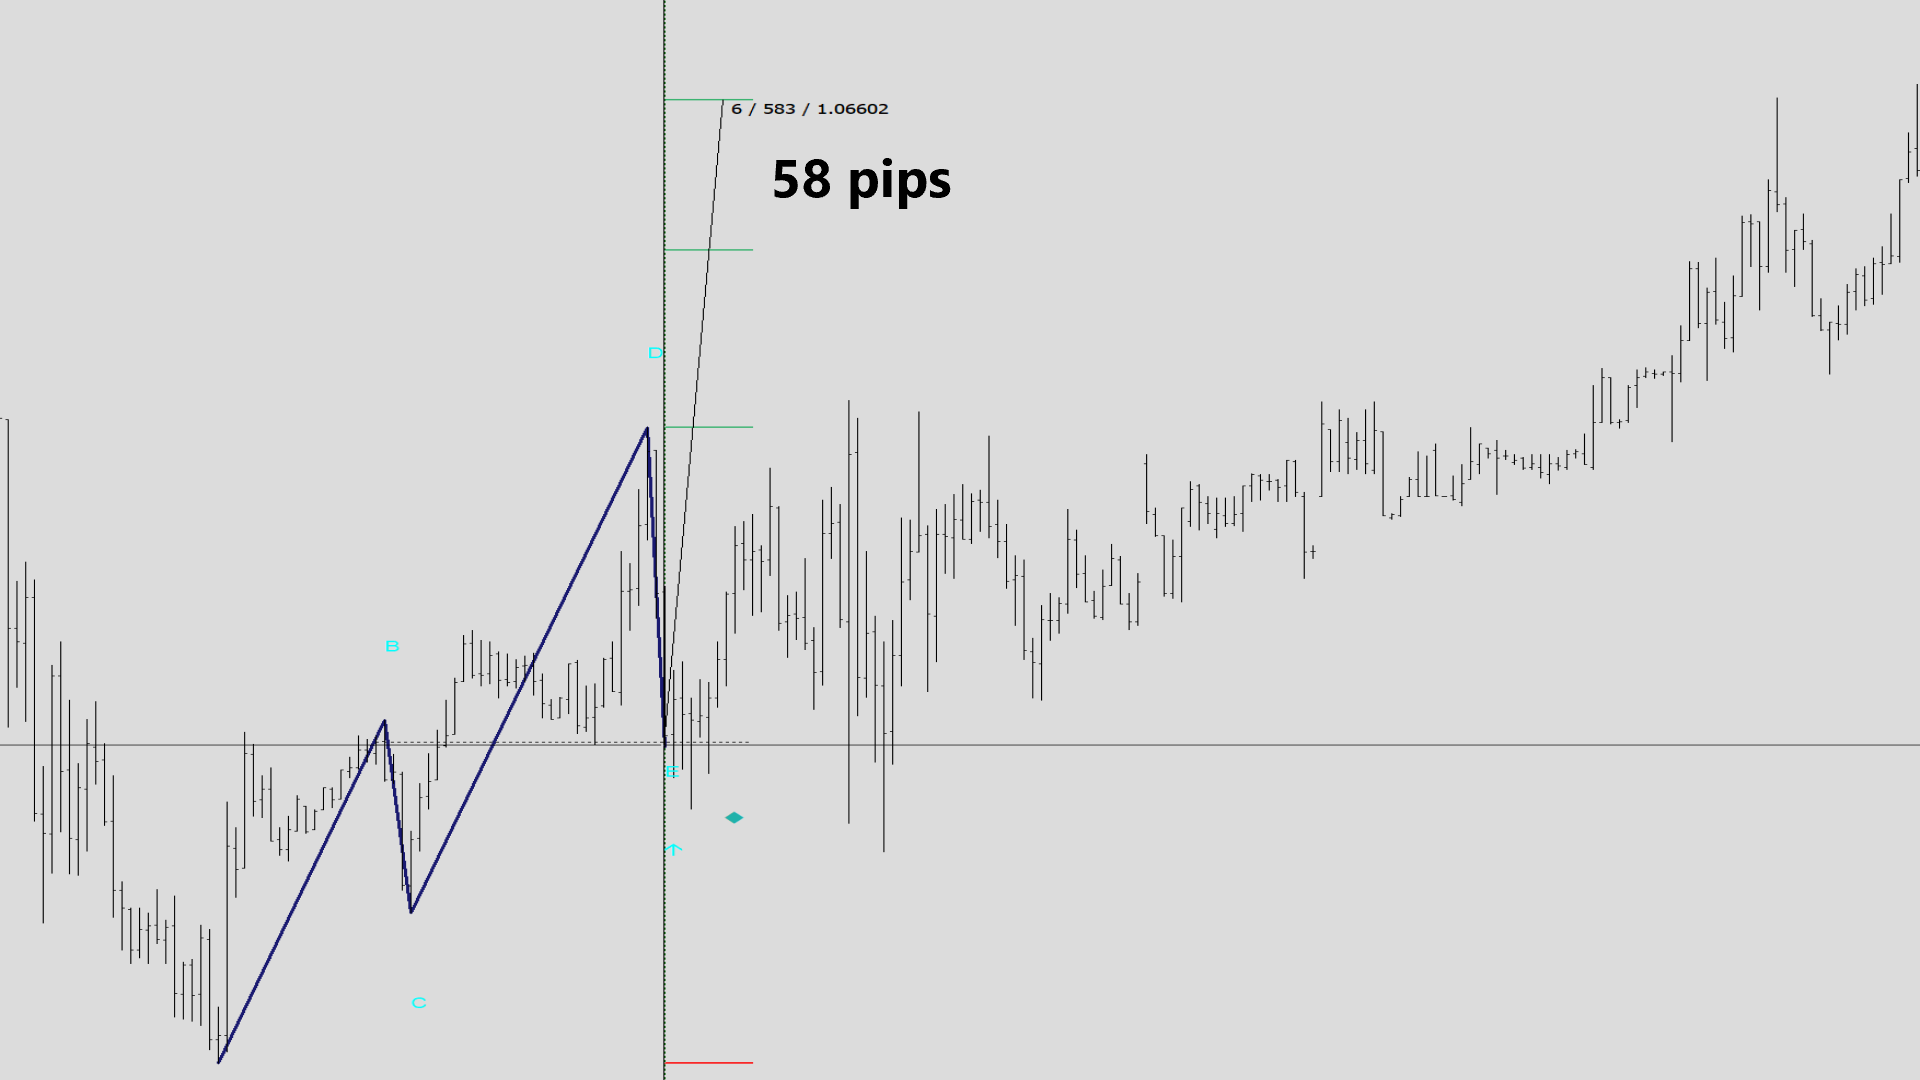
이 지표는 가격 행동의 기본 abc 패턴에 기반합니다 (즉, 돌파, 당기기, 이동).
거의 정확한 거래 신호를 제공하며 거래를 열고 닫을 때 최적인 시점을 알려줍니다. 외환, 암호화폐, 금속, 주식, 지수 등 모든 금융 자산에 적용할 수 있습니다.
주요 기능:
• 사용이 매우 쉽습니다.
• 다중 시간대 알림
• 고정 가격으로의 손실 제한 및 이익 실현 주문.
• 어떤 거래 기기와도 작동 가능합니다 (외환, CFD, 선물 등).
• 이메일 알림
• 전화 알림
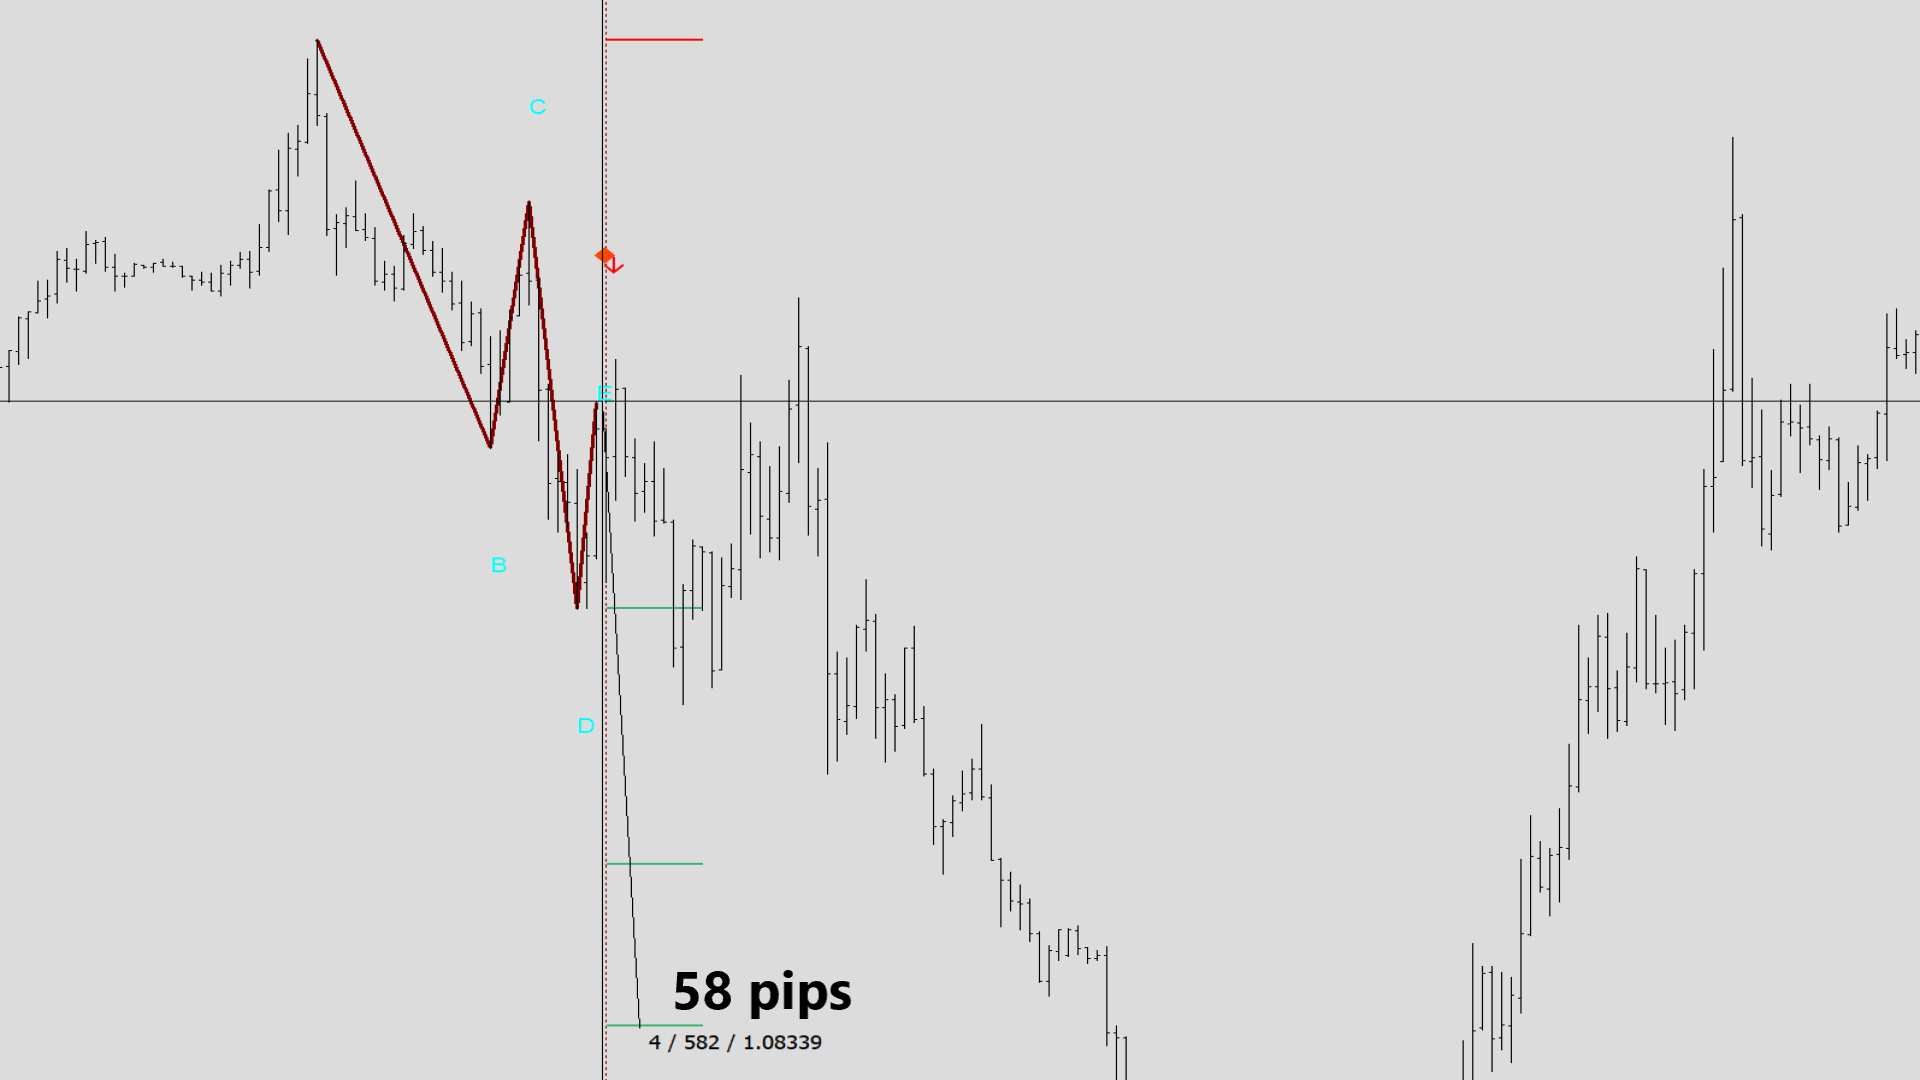
• 상당히 정확한 거래 신호를 제공하며 거래를 열 때와 닫을 때 최적인 시점을 알려줍니다.
• 차트에서 개시 라인, 손실 제한, 이익 실현 여부를 보여줍니다.
• 무료 데모 사용이 가능합니다.
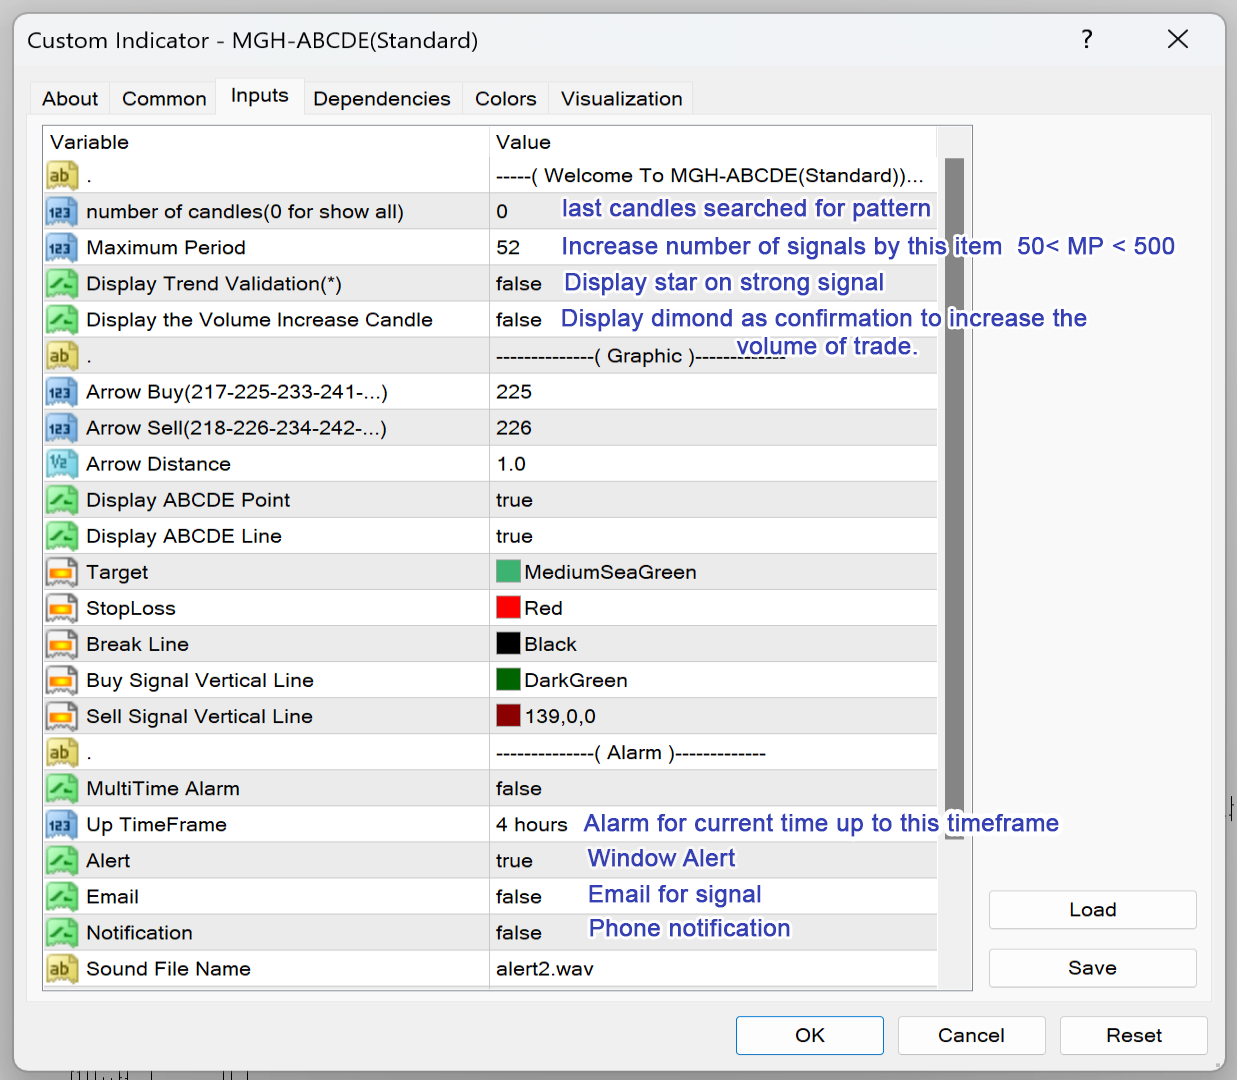
추천 설정:
EURUSD, M15 (15분 차트)
추세 검증 표시: True
거래량 증가 캔들 표시: True
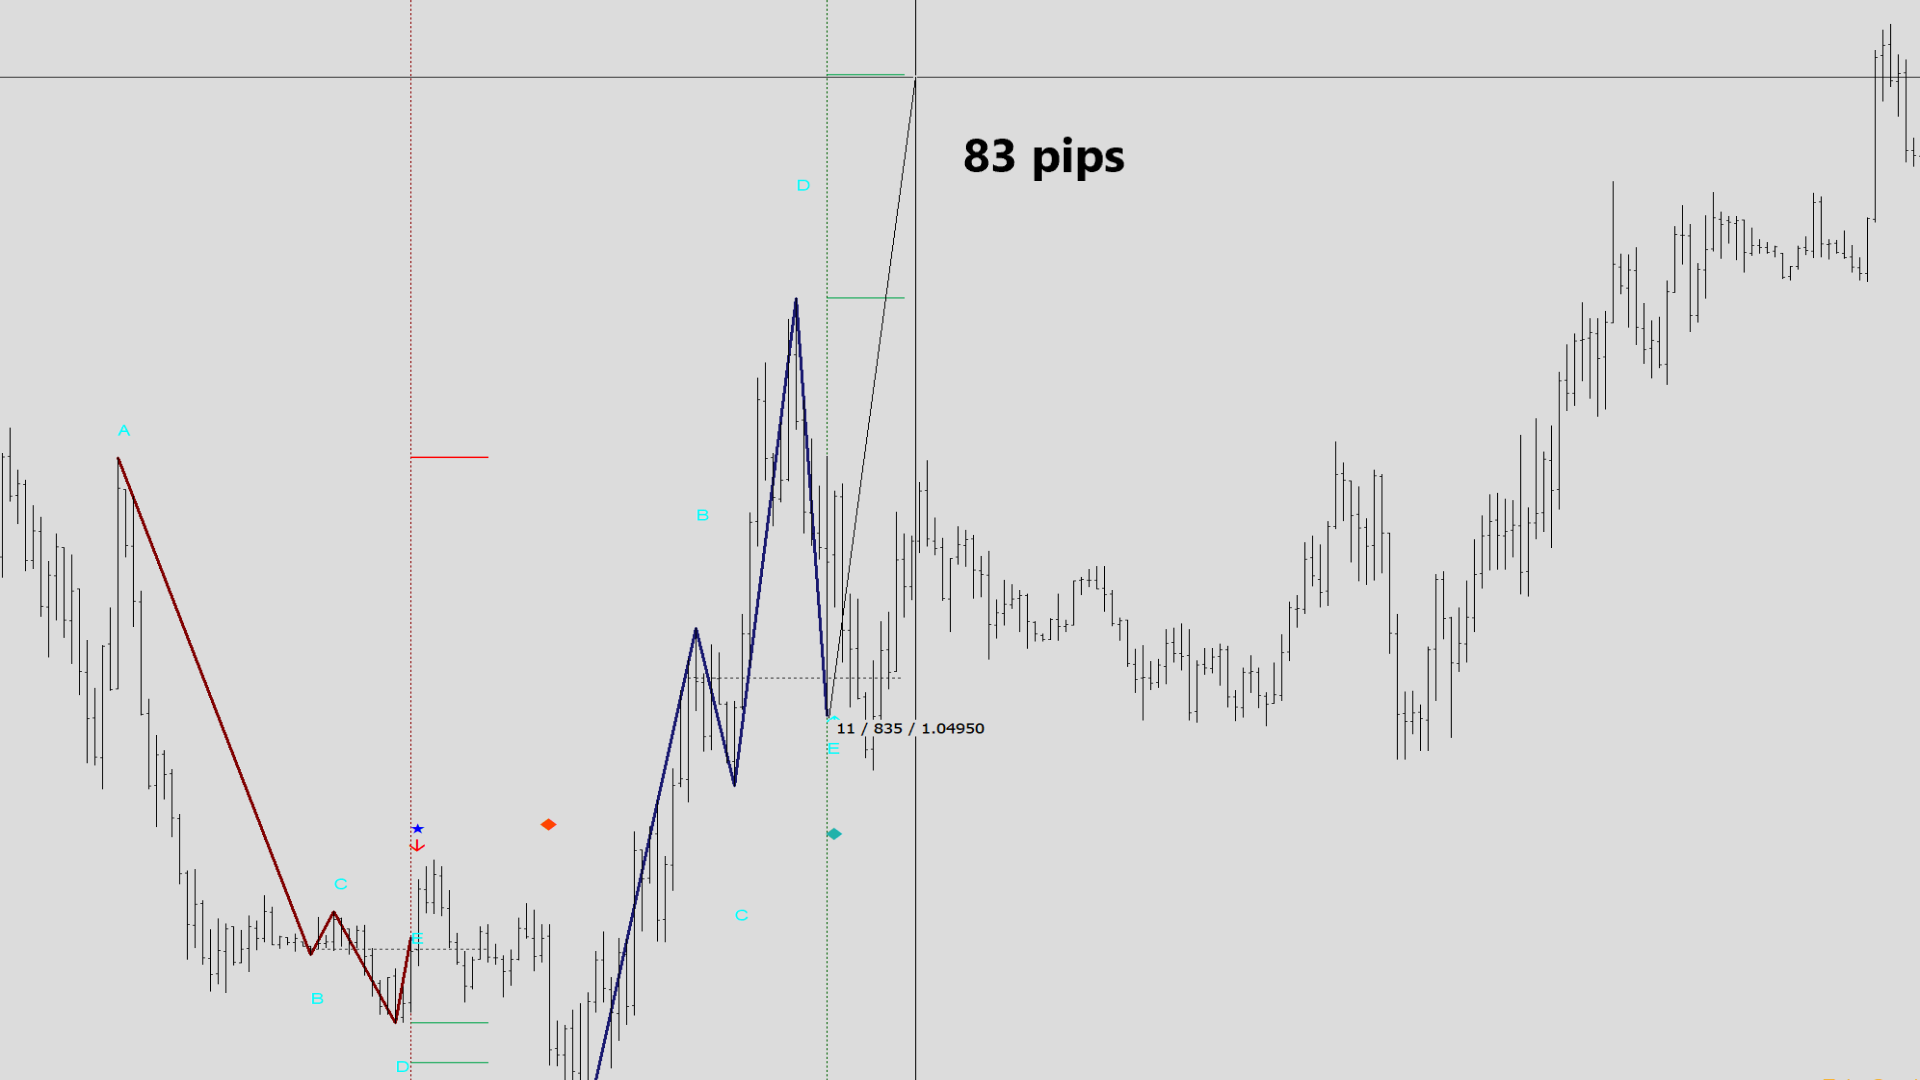
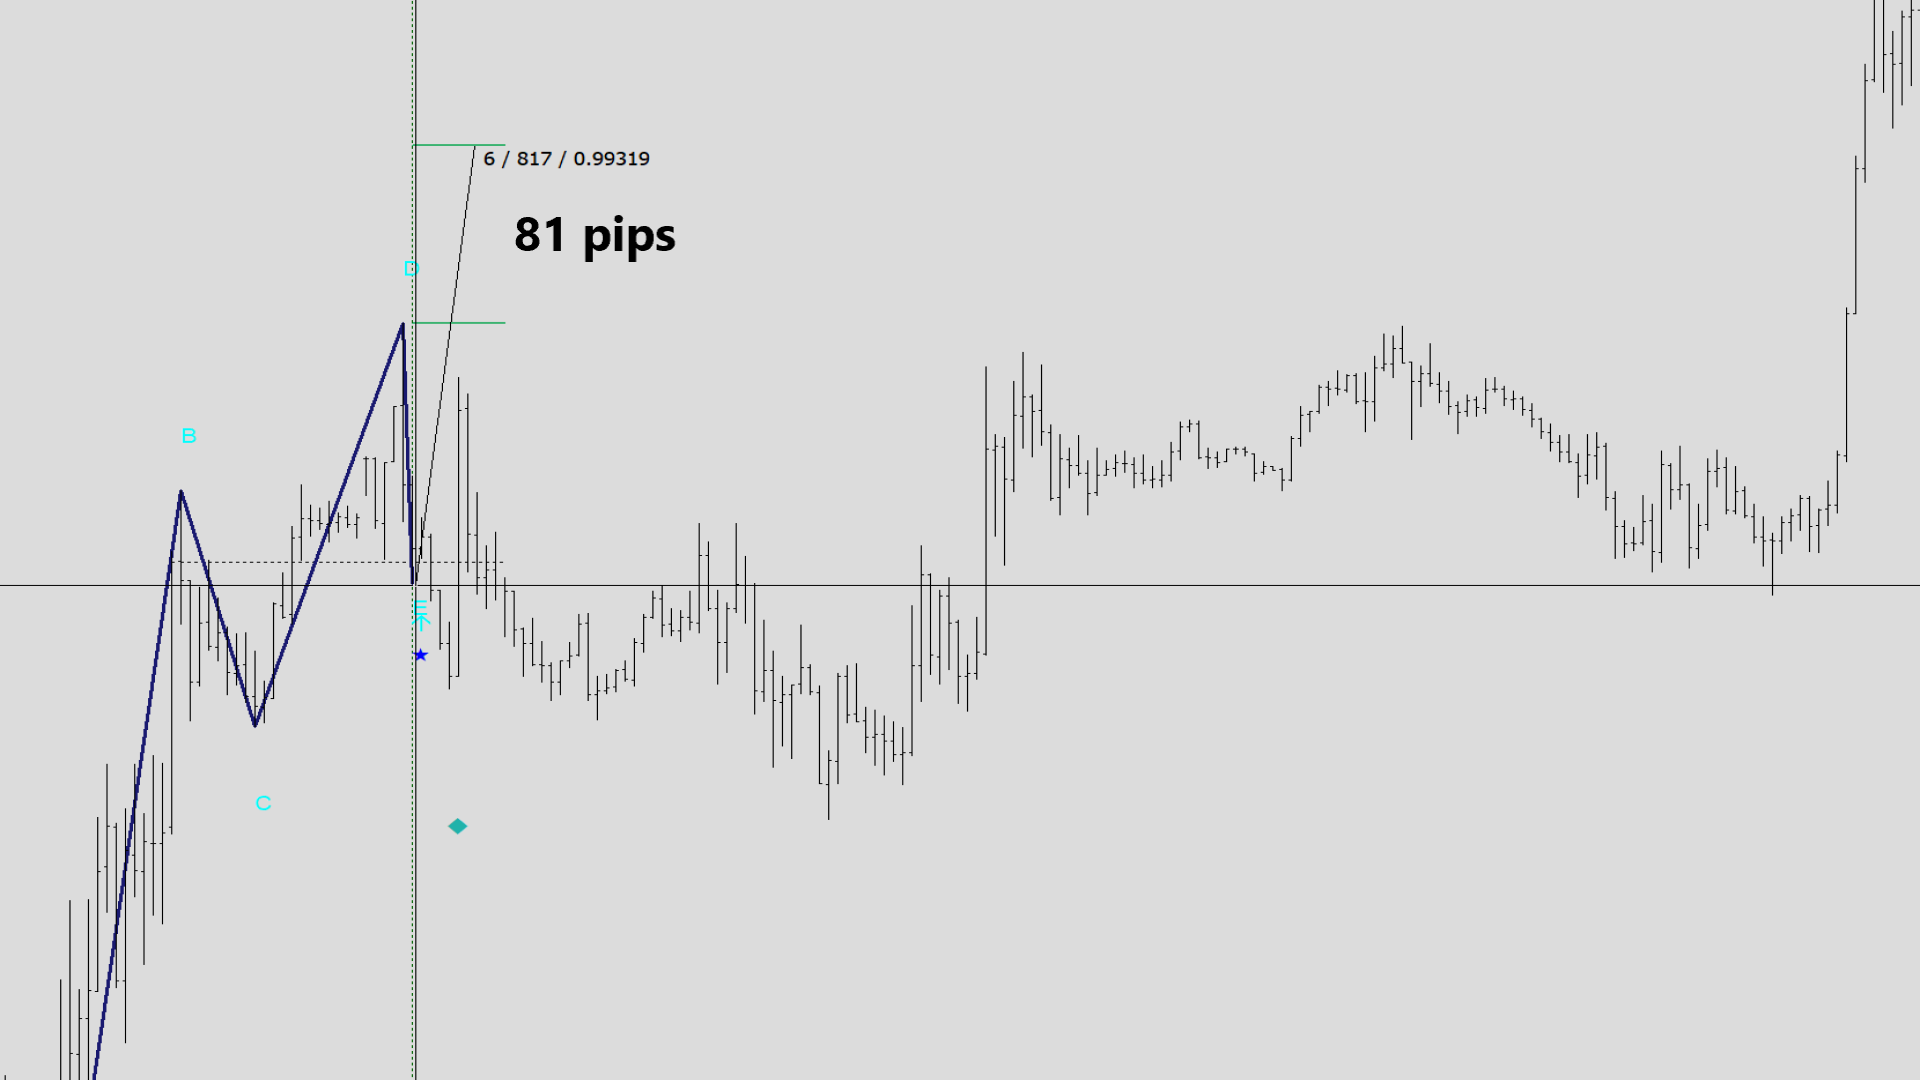
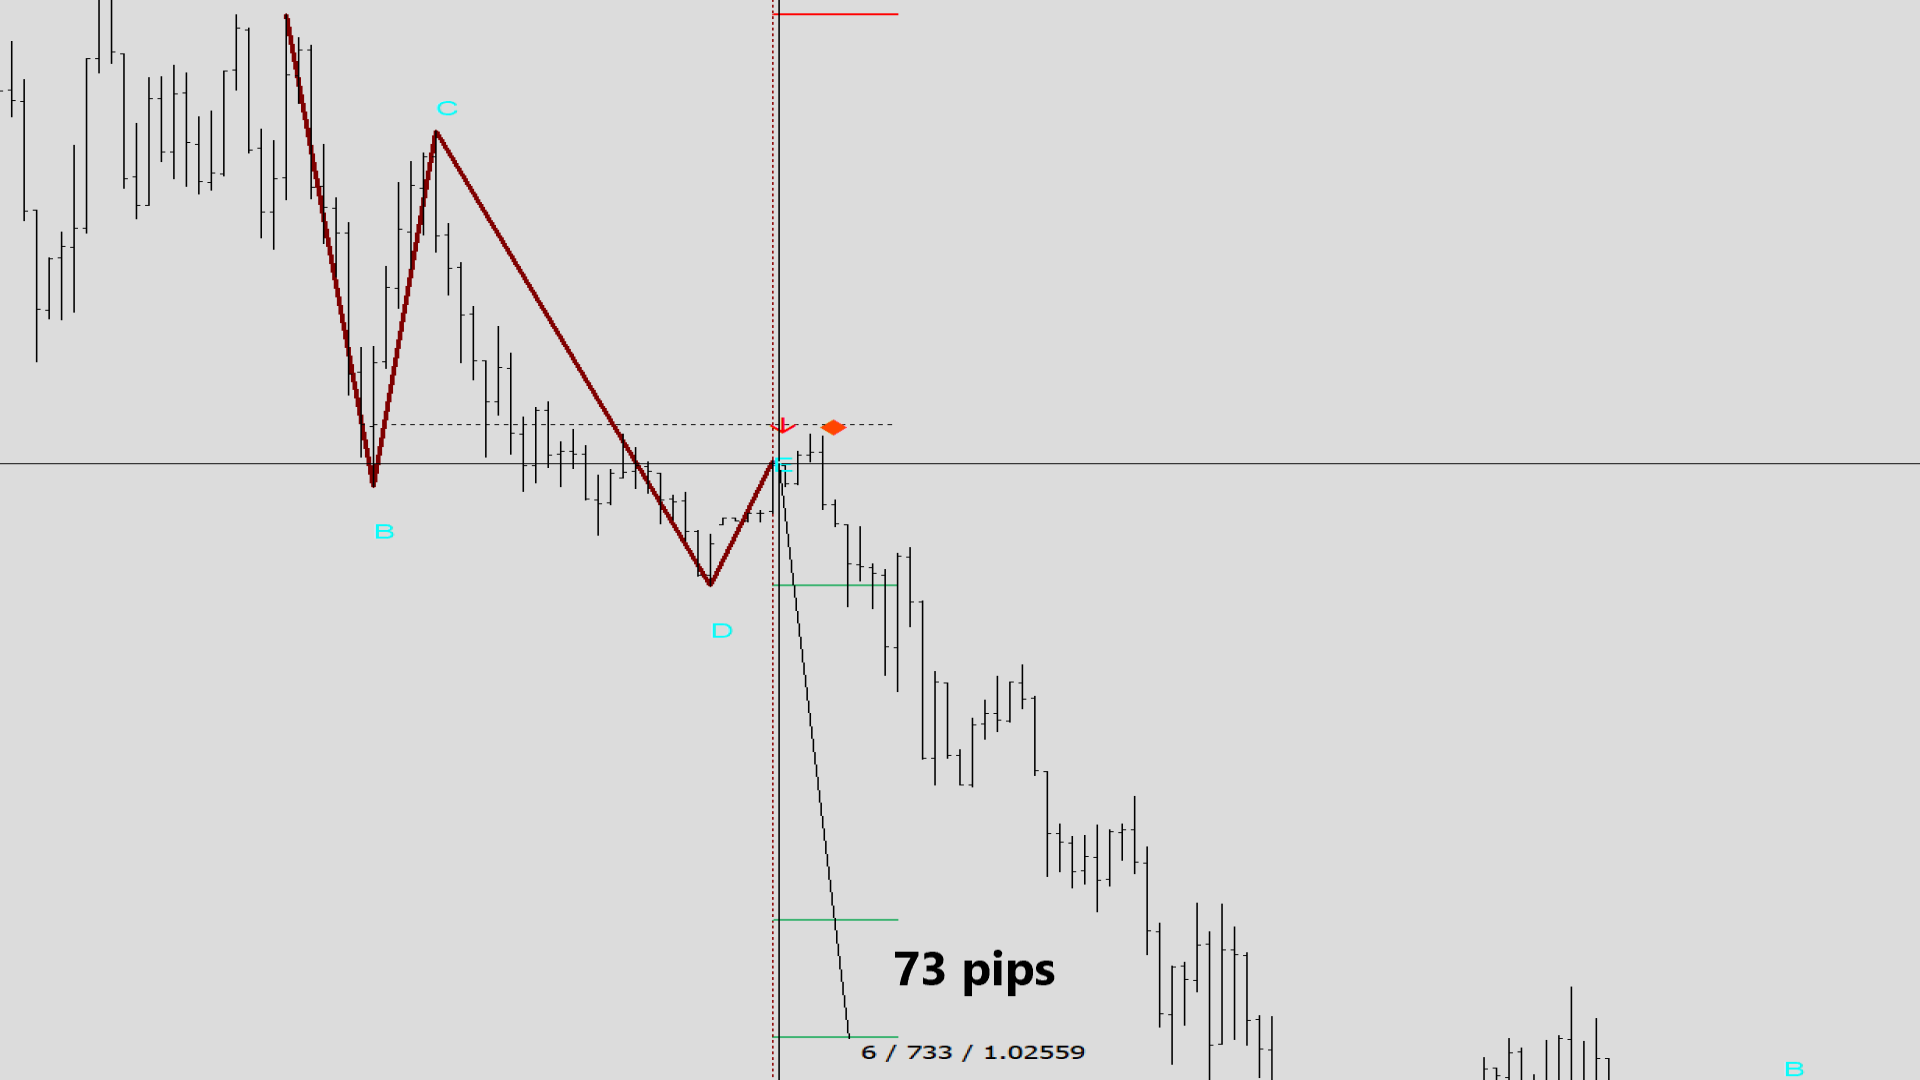
어떤 것이 이상적인 진입 시점인가요?
거래에 가장 좋은 시기는 별표와 다이아몬드 패턴으로 나타나는 E 지점입니다. 이러한 패턴은 설정에서 "추세 검증 표시"와 "거래량 증가 캔들 표시"가 활성화된 경우에만 나타납니다.
ABCDE 지표는 어떻게 작동하나요?
1. 거래 터미널에 해당 지표를 설치합니다.
2. 설정에서 색상을 조정합니다.
3. 지표에서 신호를 받아 거래할 최적 시기를 알림받은 후 거래를 시작합니다.
4. 지표 신호에 따라 거래를 진행하고, 지표의 권고에 따라 손절과 이익실현 수준을 설정합니다.
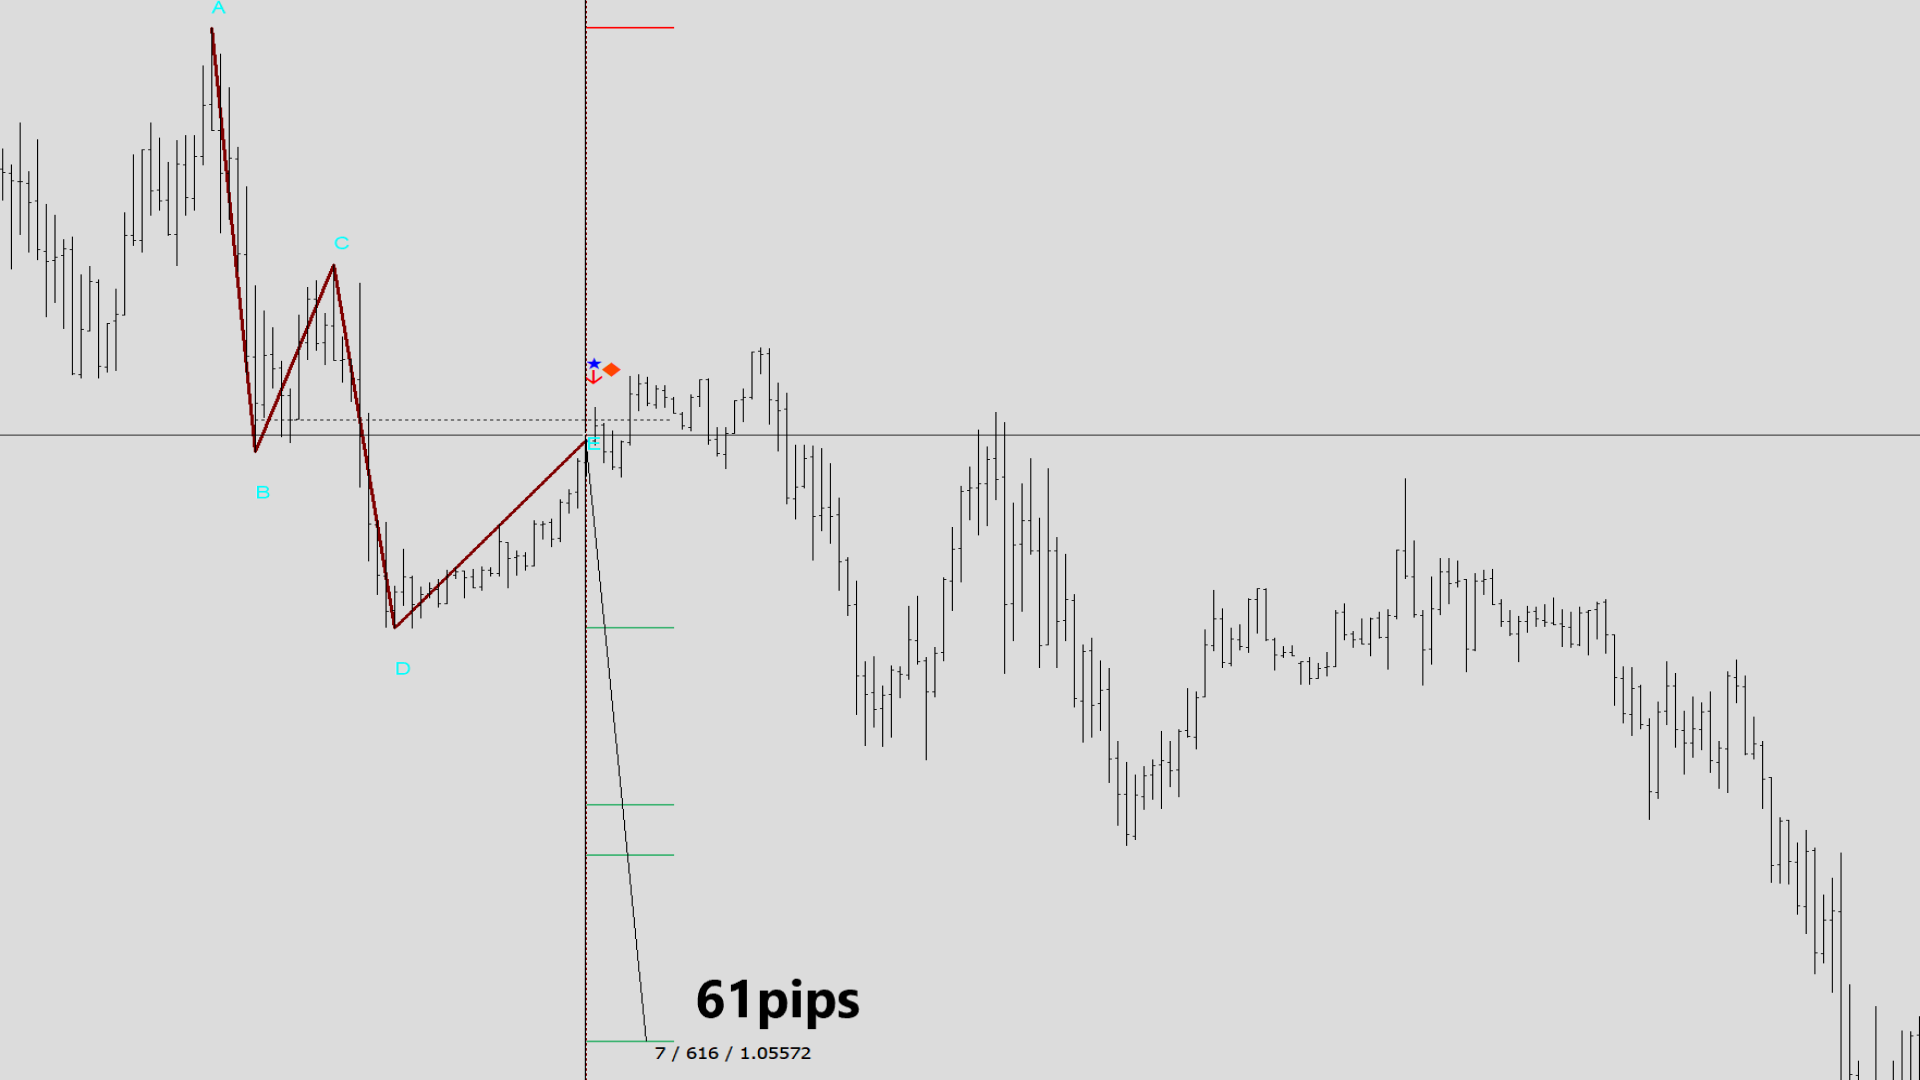
5. "추세 검증 표시"라는 설정 옵션이 있습니다. 이 옵션은 높은 타임프레임 추세를 확인합니다. 만약 신호가 추세와 일치한다면, 신호 캔들 위에 작은 별표가 나타납니다.
6. 신호에 별표가 있으면 두 번째 손절(또는 그 이상)을 선택할 수 있습니다.
7. 거래량 증가 항목을 사용하여 진입 거래량을 늘릴 수 있습니다. 이 항목은 부가적인 확인 도구로서 적합한 진입 시점으로 간주됩니다.
8. 다이아몬드 이모티콘 옆에 별표 이모티콘이 있는 경우, 발행된 신호가 크게 강화될 수 있습니다.
9. 최대 기간을 늘리면 신호 수가 늘어납니다.
10. 이 분석 도구는 상당히 무거우므로, 메타트레이더가 멈출 경우 설정에서 사용 가능한 캔들보다 작은 정수로 캔들 수를 설정할 수 있습니다(예: 1000 또는 2000 등).
11. ABCD 지표는 MT4 및 MT5 플랫폼 모두에 설계되어 있으며, 어느 플랫폼에서든 신호를 받을 수 있습니다.
12. ABCD 지표는 멀티 타임프레임 도구로 설계되었으며, 현재 시간부터 높은 타임프레임까지의 시장을 모니터링할 수 있는 멀티 타임프레임 알람을 설정에서 활성화할 수 있습니다.
질문이 생기면 언제든지 저희 지원팀에 문의하실 수 있습니다.
https://www.mql5.com/en/users/farjamim/