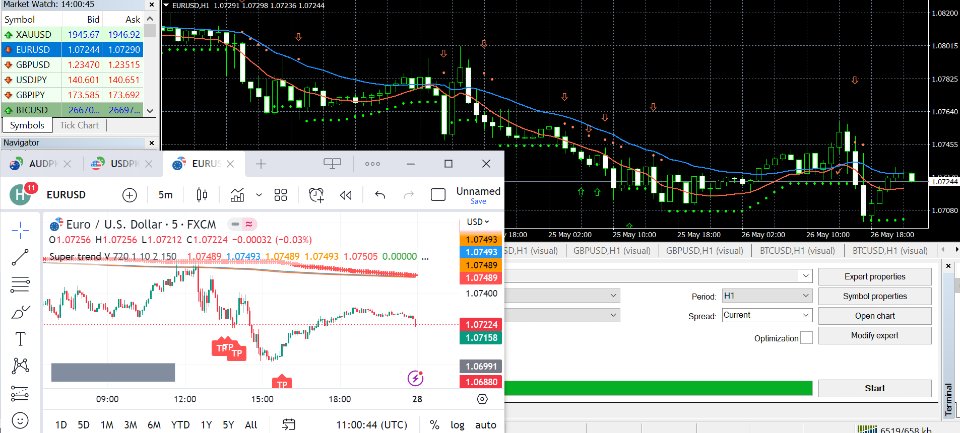
SuperTrend V
- 지표
- Muhammad Hassaan
- 버전: 1.10
- 활성화: 5
The SuperTrend V indicator is a popular technical analysis tool used to identify trends and potential trend reversals in financial markets. It is based on the concept of the SuperTrend indicator but incorporates additional features and variations.
The SuperTrend V indicator uses a combination of price action and volatility to determine the trend direction and generate trading signals. Here are the key components and features of the indicator:
-
Calculation of the SuperTrend: The indicator calculates the SuperTrend values based on the average true range (ATR) and a multiple of it. The ATR is a measure of market volatility. The SuperTrend V indicator typically uses a multiplier to determine the distance of the indicator line from the price. The distance can be either positive (above the price) or negative (below the price).
-
Trend Identification: The SuperTrend V indicator helps identify the prevailing trend in the market. When the indicator line is below the price, it indicates a bullish trend, suggesting that traders may consider long positions. Conversely, when the indicator line is above the price, it suggests a bearish trend, indicating that traders may consider short positions.
-
Trend Reversals: In addition to identifying the trend direction, the SuperTrend V indicator can also signal potential trend reversals. When the indicator line changes its position relative to the price, it suggests a possible shift in the market sentiment. For example, if the indicator line crosses above the price, it may indicate a potential reversal from a bearish to a bullish trend, and vice versa.
-
Customization Options: The SuperTrend V indicator often provides customization options to traders. These options may include parameters such as the period of the average true range, the multiplier for determining the indicator line's distance from the price, and the choice of colors for the indicator line and background.
Traders commonly use the SuperTrend V indicator in conjunction with other technical analysis tools and indicators to confirm trading signals and enhance their overall trading strategy. It is important to consider additional factors such as support and resistance levels, price patterns, and fundamental analysis to make informed trading decisions.


사용자가 평가에 대한 코멘트를 남기지 않았습니다