VolumeDeltaMT5
- 지표
- Stanislav Korotky
- 버전: 1.5
- 업데이트됨: 20 6월 2017
- 활성화: 5
This indicator provides the analysis of tick volume deltas. It calculates tick volumes for buys and sells separately, and their delta on every bar, and displays volumes by price clusters (cells) within a specified bar (usually the latest one).
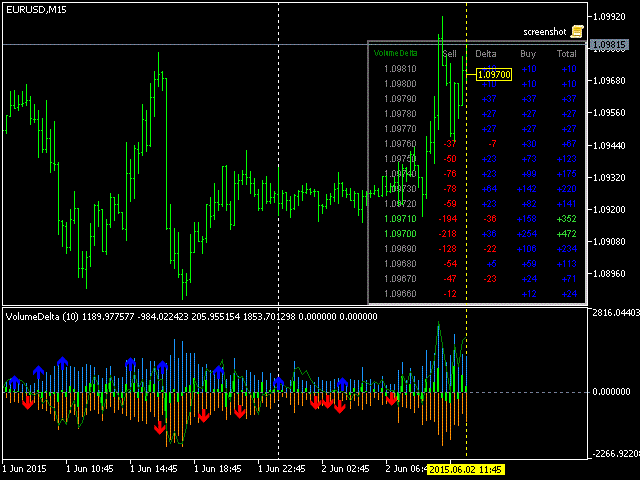
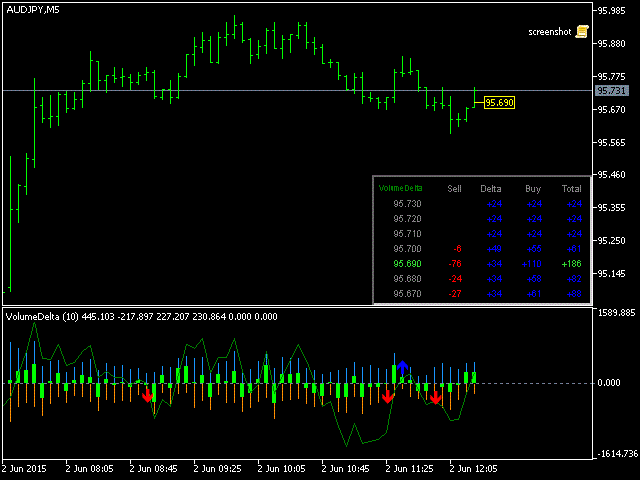
The indicator displays the following data in its sub-window:
- light-blue histogram - buy (long) volumes;
- orange histogram - sell (short) volumes;
- light green histogram - delta between buys and sells;
- green line - cumulative delta, EMA of delta; its values are multiplied by CumulativePeriod for scale adjustment - this makes it approximately the same size as the histograms;
- blue and red arrows - mark those bars where volume direction contradicts price direction, that may be considered as a signal;
Also, the indicator displays a table of split volumes for the current bar in the main window. The current bar is selected by means of yellow dotted vertical line (drag it to the required position). The table rows correspond to price clusters. The table contains the following columns:
- price (a range of prices from specified value up to the next range);
- sell volume;
- delta of buy and sell volumes (positives are blue, negatives are red);
- buy volume;
- total volume (cells with values near the maximum one are highlighted in green).
Parameters
- PointsPerCell - number of points forming a single price cluster; every cluster is shown as a row in a table with split volumes of current bar (this is a kind of "Time and Sales" feed); default value - 10;
- LastBars - number of bars for calculation; default - 1000; 0 means all bars;
- CumulativePeriod - period for calculation of cumulative delta by EMA; default - 12;
- StickToBar0 - enable/disable special mode, when the yellow dotted vertical line is always bound to the latest bar, which effectively makes it current all the time; default - false;
- Corner - corner of the main window to display the table; default value - top right corner;
- CellWidth - width of the table cells; default - 40;
- CellHeight - height of the table cells; default - 15;
- ColorBG - table background color; default - black;
- FontSize - table font size; default - 7;
- HideTable - if true, the table with split volumes is not shown; default - true;
- HideMark - if true, the price label on the maximum volume level is not shown; default - true; when both HideTable and HideMark are true, the vertical line for selecting the analyzed bar is not shown as well;
- HideBuySell - an option to hide columns for Buy and Sell volumes in the table, as well as corresponding histograms (false by default);
- UseRealVolumes - allows you to enable calculations using real volumes (when set to true), false by default.
Supported timeframes: M5 and higher.
After initial placement on a chart it may take some time for indicator to download M1 data, and its lines may be shown as incomplete. Please wait until the indicator finishes its automatic updates.


