Chanlun
- 지표
- Xiaonong Yu
- 버전: 1.0
- 활성화: 5
The ChanLun or Chan theory is one of the most popular trading theories in China. But it seems like that it has little influence in western countries. Actually, the Chan Theory is based on a sophisticated mathematical model. The basic idea ChanLun is to simplify the bar chart by its model. With the help of ChanLun, a trader can analyze and predict the trend of future goods, stocks.
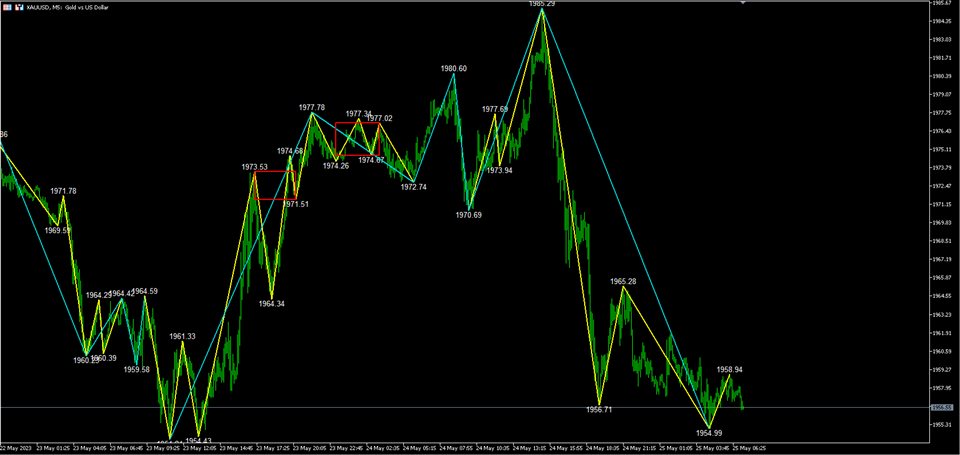
In ChanLun, there are several basic elements called fractals, strokes, line segments and pivots . A trader should paint strokes on the ever-changing chart to analyze the market or his aimed stokes. However, painting strokes on the chart is a pretty difficult and time consuming work for most of traders. This indicator aims at automating the process of painting strokes,segments and pivots on the chart. By this indicator, the traders can analyze the market directly.
The segments are added in this indicator, which can completely help users draw all the basic components in Chan theory.
The color, transparency and thickness of the strokes and segements can be set by the users.


