ABC Pattern Strategy
- 지표
- Issam Kassas
- 버전: 1.0
- 활성화: 20
Description:
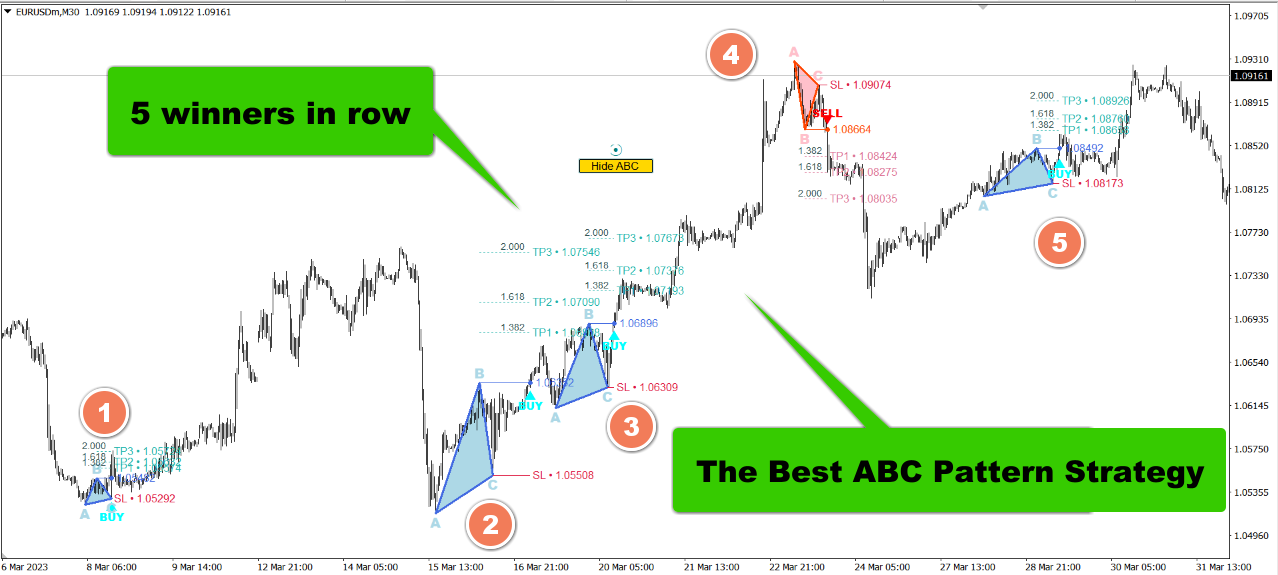
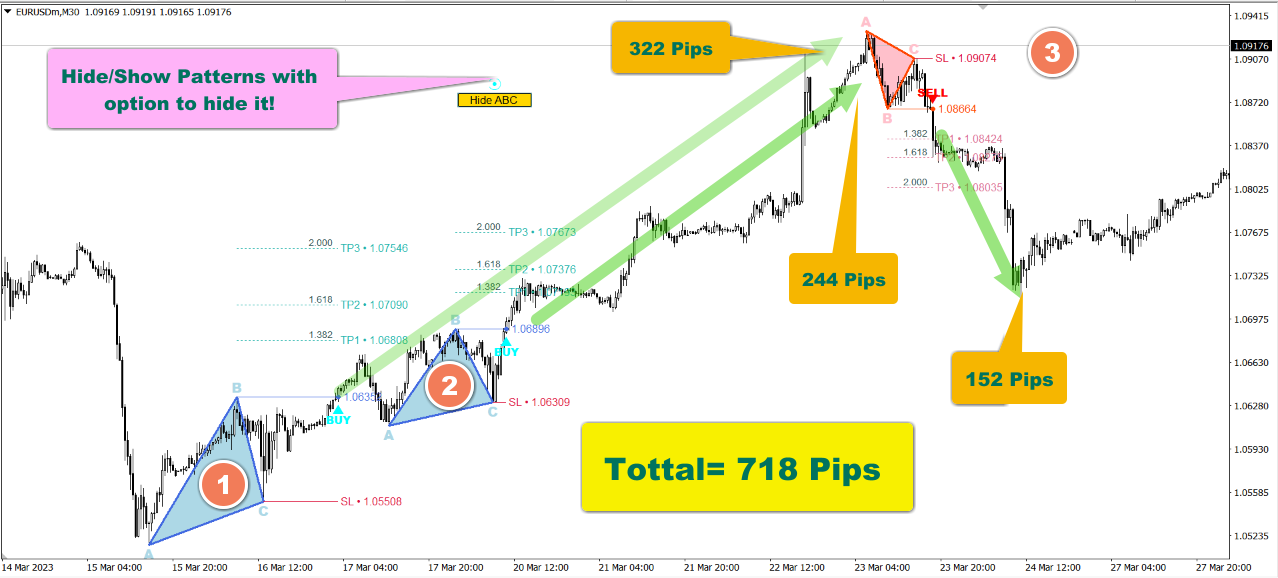
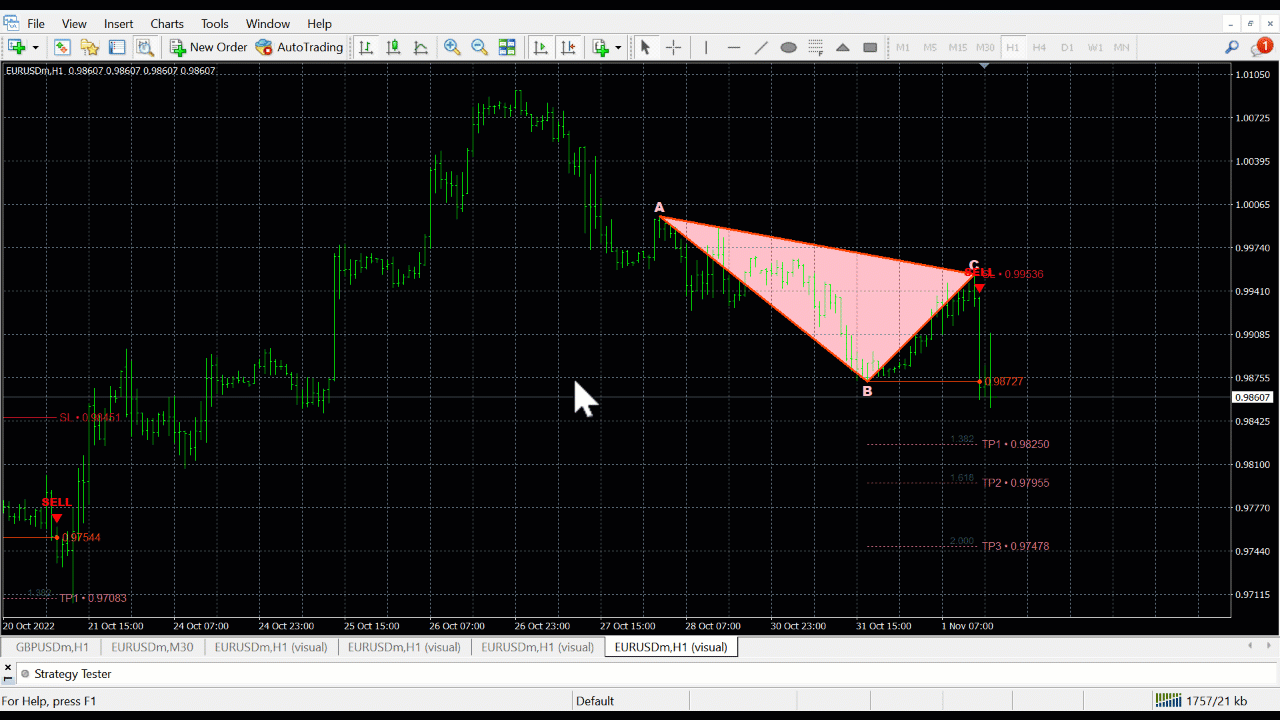
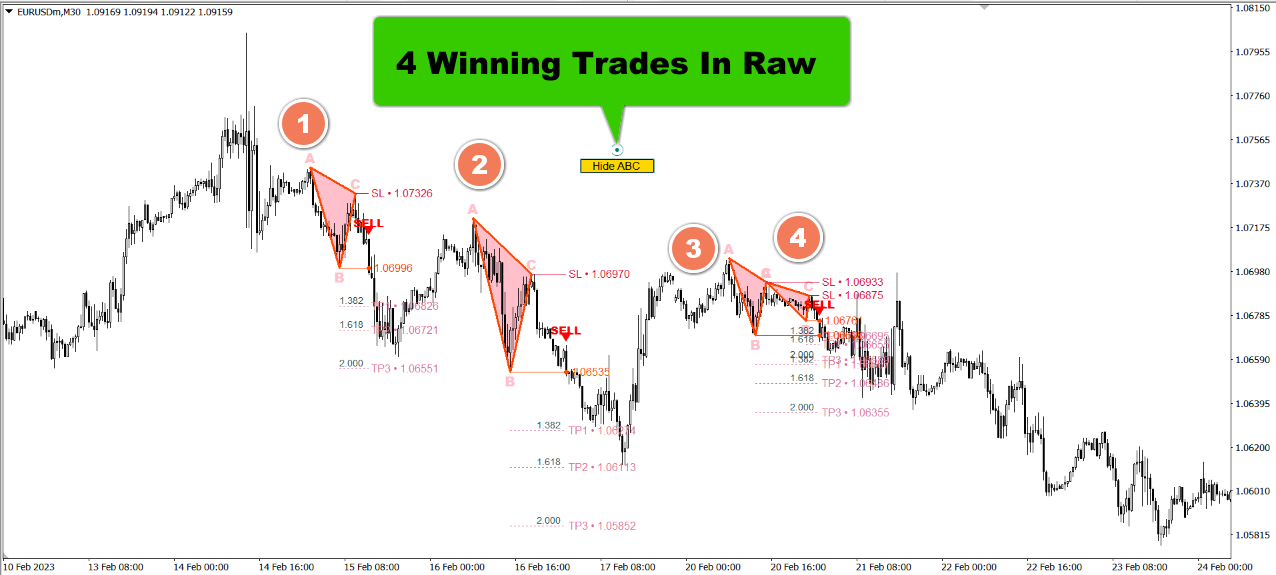
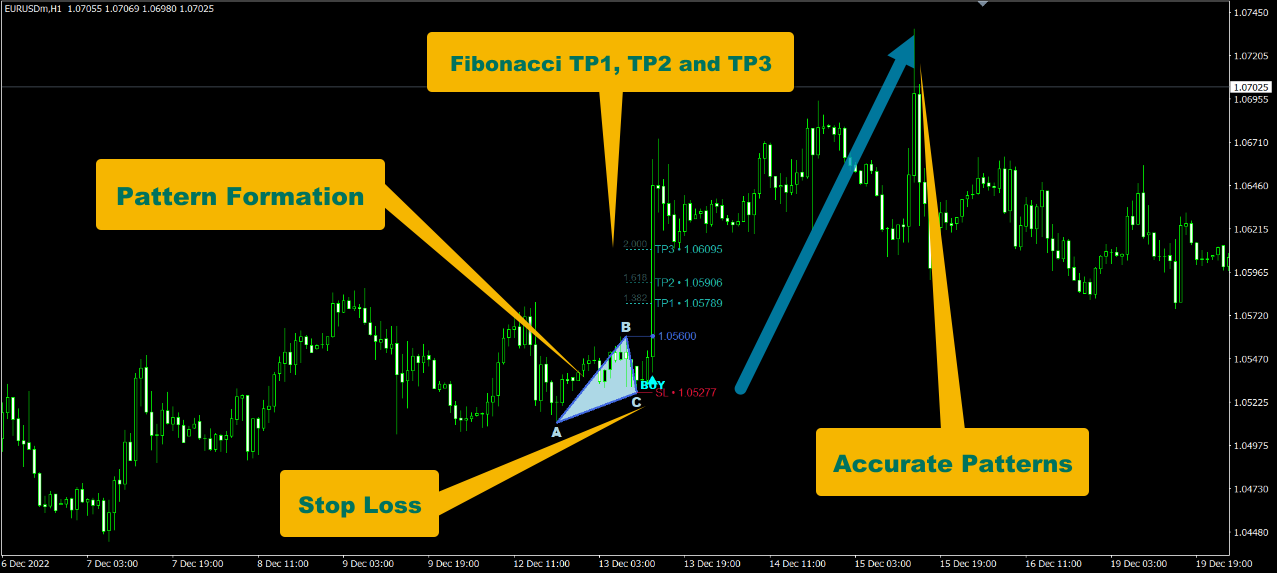
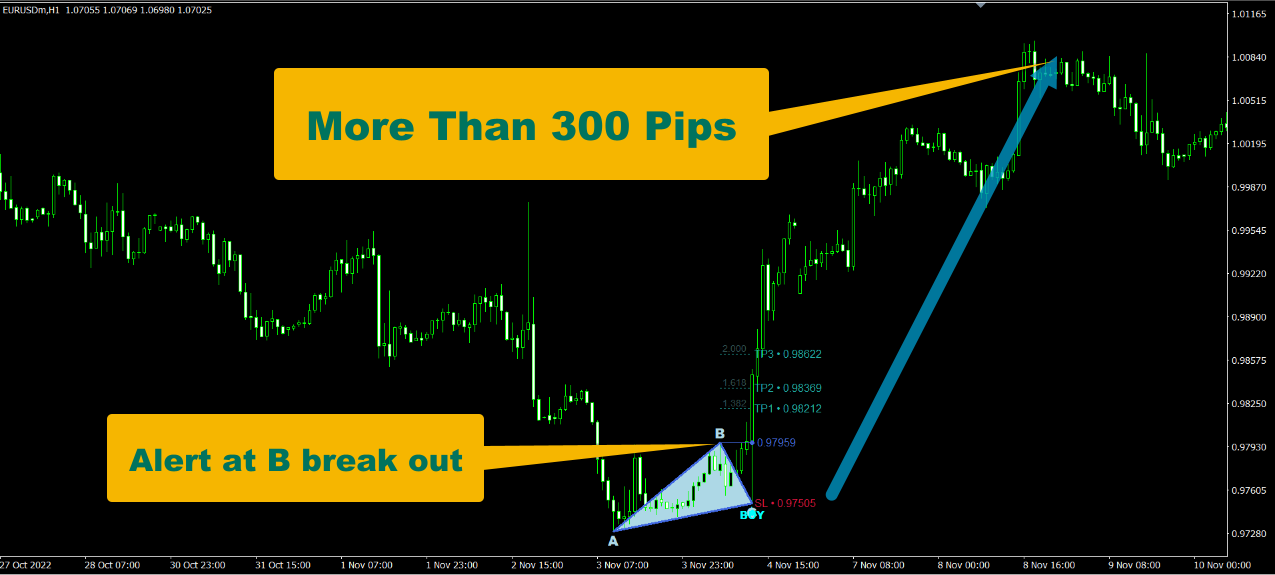
The "ABC Pattern Strategy With Fibonacci" Indicator is a sophisticated technical analysis tool meticulously designed to recognize and leverage the power of the ABC chart patterns in combination with Fibonacci levels. This cutting-edge strategy empowers traders to make well-informed decisions in the dynamic forex market. By making spotting ABC patterns on price charts an easy task, the indicator offers insights into potential trend reversals or continuations. It seamlessly incorporates Fibonacci retracement and extension levels, aiding traders in pinpointing optimal entry and exit points.Features:
- Combination of ABC strategy and Fibonacci for more accuracy.
- Alerts to phone and email in real time.
- Comes with SL and Multi TP levels drawn on the chart.
- Up to 8 TP levels.
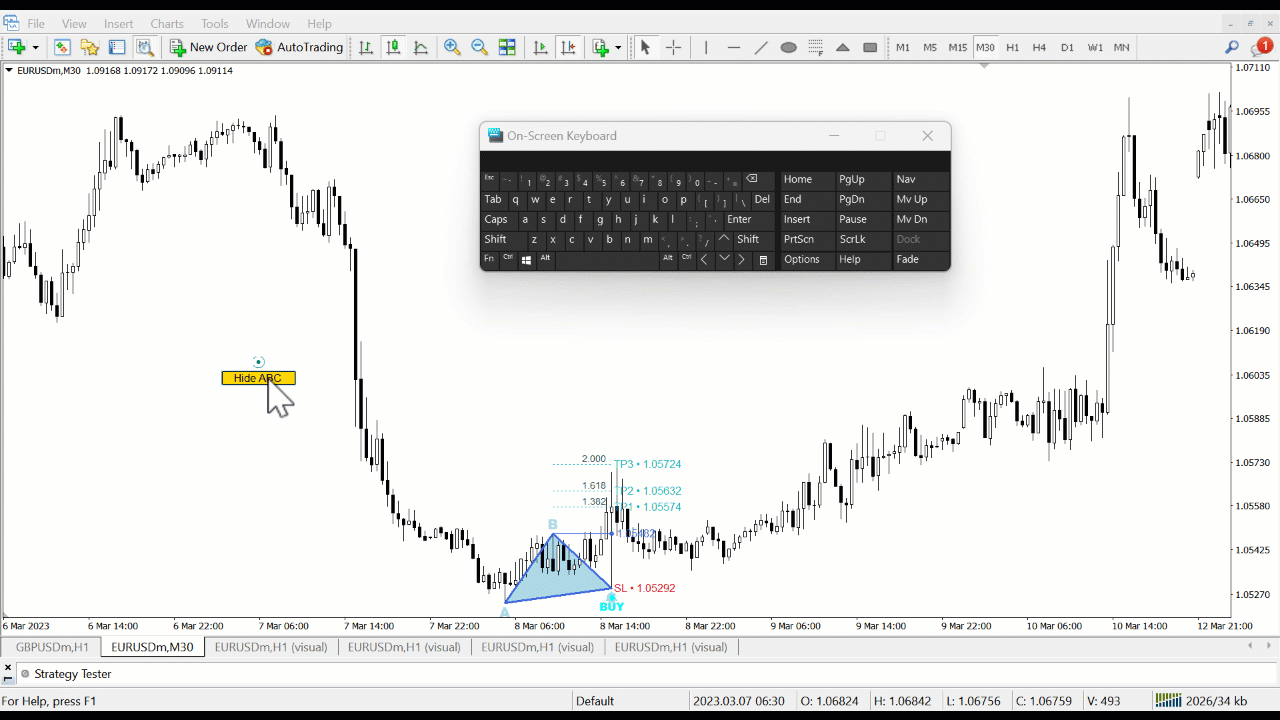
- Smart button and hotkey to show and hide all ABC patterns.
ABC Pattern, 123 Pattern, Fibonacci, Fibonacci Levels, Reversal Pattern, Continuation Pattern, Fibonacci Pattern, ABC Pattern Detector, ABC Pattern Finder, ABC Pattern Indicator, 123 Pattern Finder, 123 Pattern Detector, 123 Pattern Indicator, ABC Pattern Strategy, Fibonacci Analysis, Reversal Pattern Recognition, Continuation Pattern Detection, Fibonacci Chart Patterns, ABC Pattern Scanner, 123 Pattern Finder Tool, Fibonacci Level Indicator, ABC Pattern Signal, 123 Pattern Identifier, Reversal and Continuation Analysis, Fibonacci Trend Analysis, ABC Pattern Recognition Tool, 123 Pattern Alert System, Fibonacci Pattern Detector, ABC Pattern Analytics, 123 Pattern Insight, Fibonacci Trading Strategy, ABC Pattern Confirmation Indicator, 123 Pattern Signals, Fibonacci Trend Finder, ABC Pattern Signals, 123 Pattern Analytics Tool, 123 Pattern Strategy