LT Super Trend
- 지표
- Sie Samuel Roland Youl
- 버전: 1.25
- 업데이트됨: 5 8월 2023
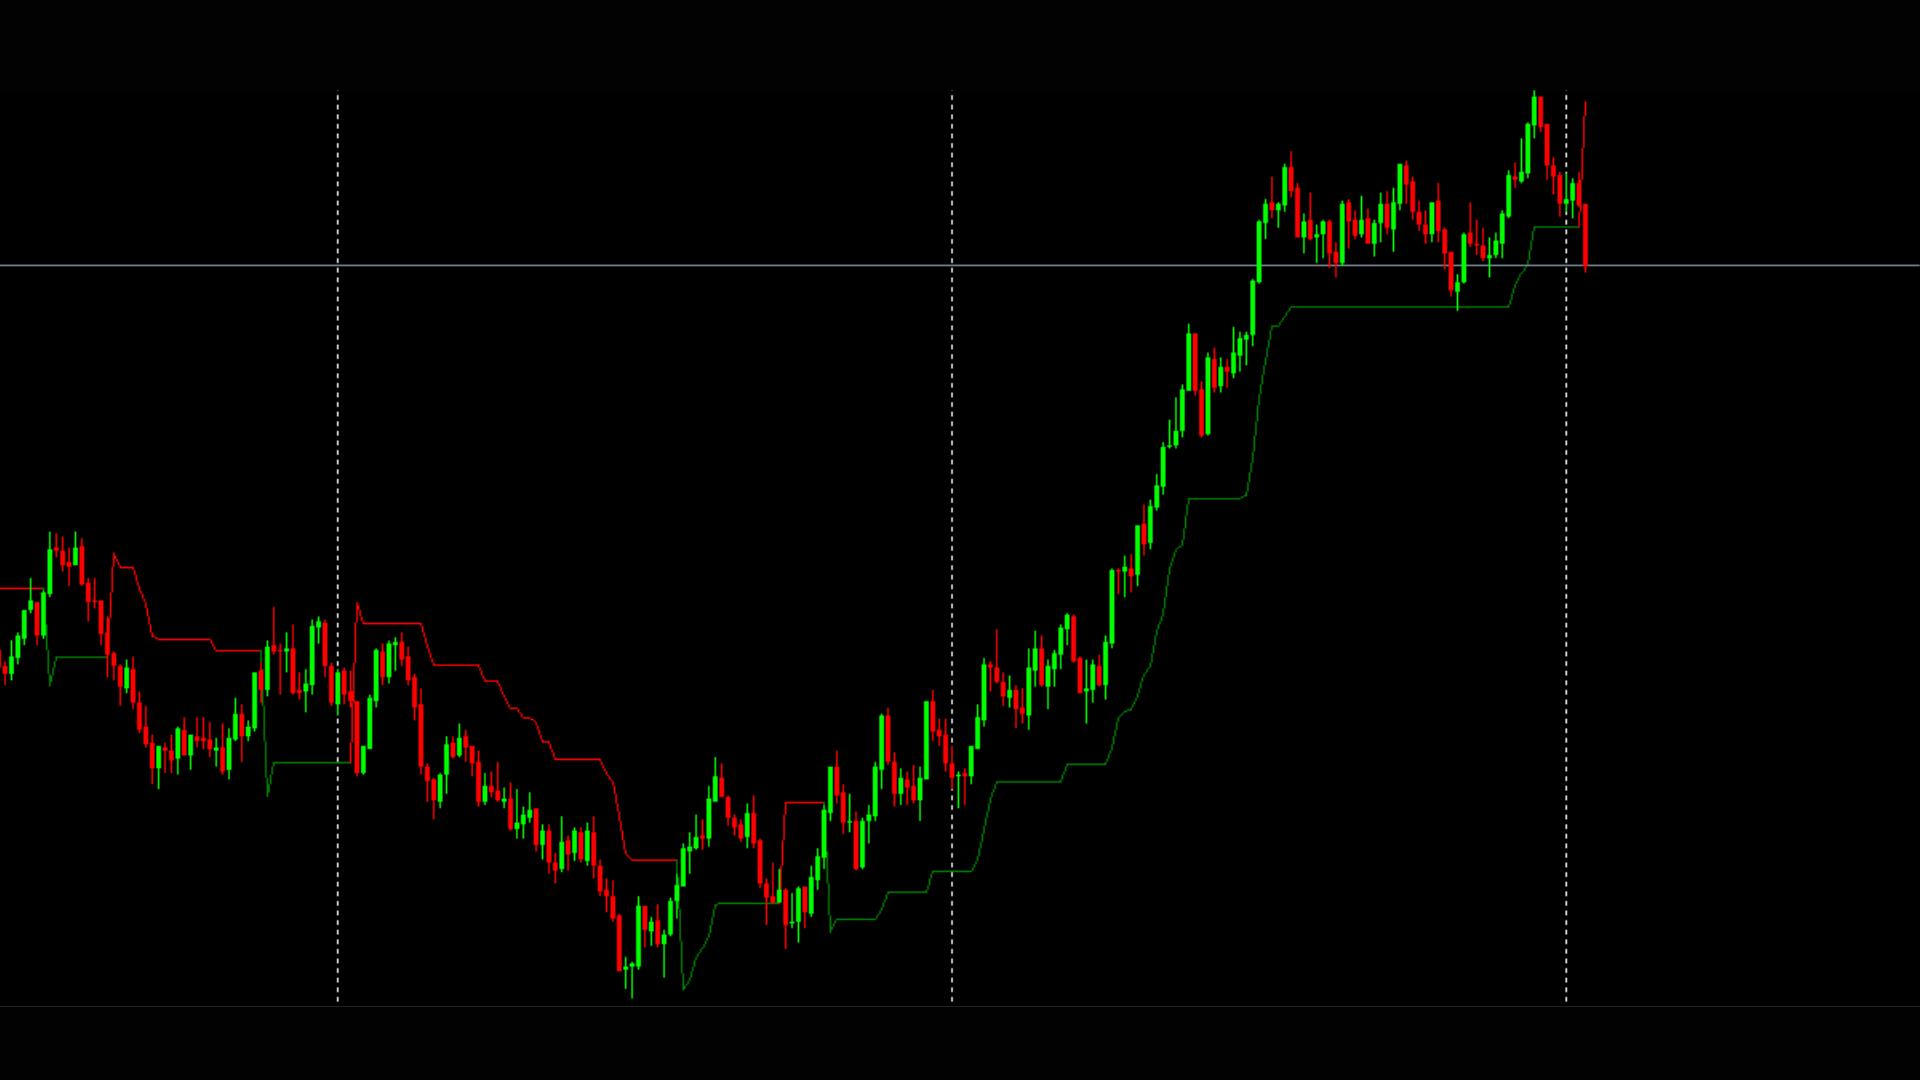
슈퍼 트렌드 지표는 트레이더들이 시장의 추세 방향과 잠재적인 진입 및 청산 지점을 파악하는 데에 사용되는 인기 있는 기술적 분석 도구입니다. 이는 가격 움직임과 변동성에 기반하여 신호를 제공하는 추세 추종형 지표입니다.
슈퍼 트렌드 지표는 두 개의 선으로 구성되어 있으며, 하나는 상승 추세를 나타내는 경우 (일반적으로 녹색으로 표시)이고 다른 하나는 하락 추세를 나타내는 경우 (일반적으로 빨간색으로 표시)입니다. 추세의 방향에 따라 선들은 가격 차트 위 또는 아래에 그려집니다.
슈퍼 트렌드 지표를 효과적으로 사용하기 위해서는 다음과 같은 절차를 따르세요:
1. 추세 방향 파악하기: 시장이 상승 추세인지 하락 추세인지를 판단하기 위해 슈퍼 트렌드 선을 찾아보세요. 녹색 선은 상승 추세를 나타내고, 빨간색 선은 하락 추세를 나타냅니다.
2. 진입 신호: 슈퍼 트렌드 선의 색상이 변경되는 경우, 추세가 반전될 가능성을 나타내는 진입 주문을 고려하세요. 예를 들어, 슈퍼 트렌드 선이 빨간색에서 녹색으로 변경되면 하락 추세에서 상승 추세로의 변화를 의미하며, 구매 기회를 나타낼 수 있습니다.
3. 청산 신호: 슈퍼 트렌드 지표를 사용하여 거래를 청산할 시기를 결정하세요. 만약 롱 포지션에 있고 슈퍼 트렌드 선이 녹색에서 빨간색으로 변한다면, 거래를 종료하고 이익을 실현할 수 있습니다. 마찬가지로, 숏 포지션에 있고 슈퍼 트렌드 선이 빨간색에서 녹색으로 변경된다면, 가능한 청산 포인트를 나타낼 수 있습니다.
4. 손절 설정하기: 슈퍼 트렌드 선을 손절 수준 설정에 참고하세요. 롱 포지션의 경우, 슈퍼 트렌드 선 아래에 손절을 두고, 숏 포지션의 경우, 위에 두세요.
슈퍼 트렌드는 변동적이거나 측면 시장에서 잘못된 신호를 발생시킬 수 있기 때문에 다른 기술적 지표와 가격 분석과 함께 사용하여 거래 신호를 확인하고 전체적인 정확성을 향상시키는 것이 중요합니다. 실전 거래에 적용하기 전에 데모 계좌에서 슈퍼 트렌드 지표를 사용하여 연습하세요.


ok