• 미리보기
  • 리뷰
  • 코멘트 (9)

Top Bottom Indicator

지표 소개

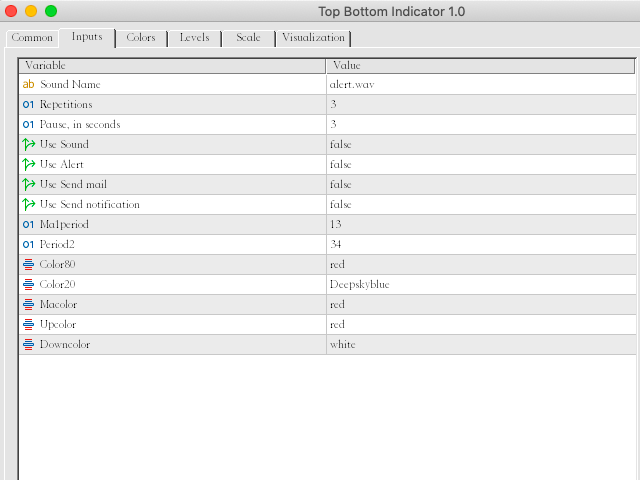
이 지표는 RSI 또는 CCI 보다 더 안정적이고 지연이 적은 이동 평균 공식에 따라 설계되었습니다. 지표에는 세 가지 지표 값이 있으며 이동 평균 기간과 선 색상은 수동으로 변경할 수 있습니다.

이 지표는 무엇을 가져올 수 있습니까?

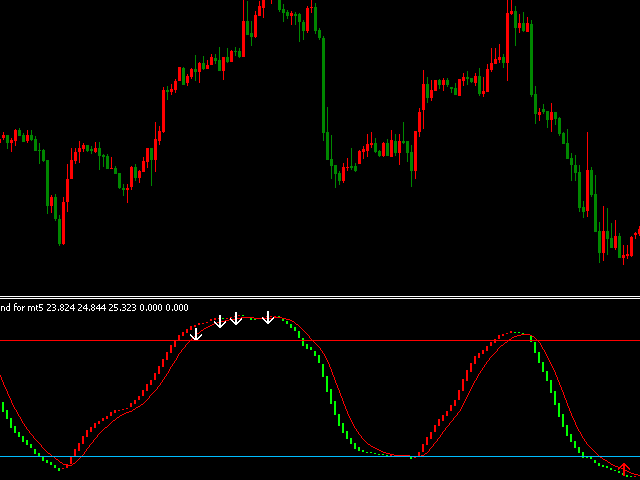
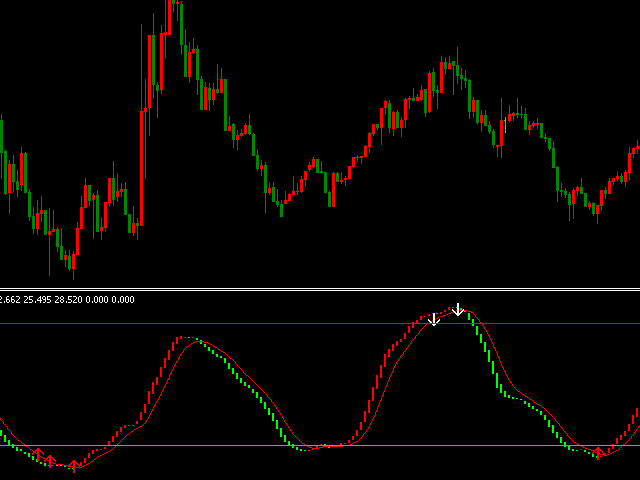
  1. 정확한 진입 신호: 표시기는 위쪽 및 아래쪽 화살표 신호를 그립니다.
  2. 다중 기간 추세 분석: 이 지표를 큰 기간 차트와 작은 기간 차트에 로드하면 사용 효과가 더 좋아집니다. 큰 시간대 차트의 지표 색상에 따라 추세 방향을 판단하고 작은 시간대 차트의 신호에 따라 시장에 진입하십시오.
  3. 고가 및 저가 구간 판단: 지표의 값은 항상 0~100 사이이며, 이를 바탕으로 가격의 상대적 위치를 분석할 수 있습니다. 추세선이 80보다 높고 가격이 과매수 구간에 있으면 매수 포지션을 열 기회를 선택할 수 있습니다. 추세선이 20 미만일 때 가격이 과매도 구간 에 있으면 매도 포지션을 열 수 있는 기회를 선택할 수 있습니다.
  4. 새로운 EA 설계: 추세선의 방향 또는 지표의 발산을 기반으로 새로운 EA를 설계할 수 있습니다 .
  5. 알람: 위쪽 또는 아래쪽 화살표 신호가 있거나 80 위에 두 개의 선이 있고 위쪽 십자가 또는   20 미만이고 다운 크로스가 있으면 모바일 클라이언트에 이메일과 마사지를 보낼 수 있으며 동시에 차트 창에 경고를 보낼 수 있으므로 항상 혼자 신호를 보지 않고도 즉각적인 신호를 얻을 수 있습니다. 매번 알림 반복 횟수를 수동으로 수정할 수 있으며 세 가지 유형의 메시지 알림을 수동으로 끄거나 켤 수 있습니다.
표시 기능
  • 지표는 간단하고 직관적인 방식으로 추세선을 그립니다. 사용하기 쉽습니다.
  • 그것은 가격에 대한 예측 가능성이 강하고 지표의 값은 항상 0-100 사이이며 상대적으로 높거나 낮은 가격을 예측할 수 있습니다.
  • 잦은 추세 신호 반전 없이 견고함;
  • 작은 지연, 가격 반전의 초기 단계에서 추세선 색상을 변경할 수 있습니다.
  • 모든 기간 및 기호에 적용 가능
  • 추세선과 화살표 신호는 표류하거나 다시 칠하지 않습니다.

지표는 다음 그림에 표시되어 있으며 지표를 다운로드하여 MT5 터미널에서 백테스트할 수 있습니다.


추천 제품
Enhance your price action strategy: inside bar breakouts at your fingertips This indicator detects inside bars of several ranges, making it very easy for price action traders to spot and act on inside bar breakouts. [ Installation Guide | Update Guide | Troubleshooting | FAQ | All Products ] Easy to use and understand Customizable color selections The indicator implements visual/mail/push/sound alerts The indicator does not repaint or backpaint An inside bar is a bar or series of bars which is/a
Basic information. To perform its work, the indicator takes data on volumes from a lower timeframe, builds Market Profiles for a higher timeframe and a histogram for the current timeframe. The indicator starts in several stages. In this case, messages like: "Build Source & Target TF. Step: …" are output to the log. The process can be accelerated by changing the input parameter Milliseconds between steps - the initialization speed. The final value of this parameter is always individual and is set
Owl Smart Levels MT5
Sergey Ermolov
4 (29)
MT4 버전  |  FAQ Owl Smart Levels Indicator 는 Bill Williams 의 고급 프랙탈, 시장의 올바른 파동 구조를 구축하는 Valable ZigZag, 정확한 진입 수준을 표시하는 피보나치 수준과 같은 인기 있는 시장 분석 도구를 포함하는 하나의 지표 내에서 완전한 거래 시스템입니다. 시장과 이익을 취하는 장소로. 전략에 대한 자세한 설명 표시기 작업에 대한 지침 고문-거래 올빼미 도우미의 조수 개인 사용자 채팅 ->구입 후 나에게 쓰기,나는 개인 채팅에 당신을 추가하고 거기에 모든 보너스를 다운로드 할 수 있습니다 힘은 단순함에 있습니다! Owl Smart Levels 거래 시스템은 사용하기 매우 쉽기 때문에 전문가와 이제 막 시장을 연구하고 스스로 거래 전략을 선택하기 시작한 사람들 모두에게 적합합니다. 전략 및 지표에는 눈에 보이지 않는 비밀 공식 및 계산 방법이 없으며 모든 전략 지표는 공개되어 있습니다. Owl Smart Levels를 사
Order Book, known also as Market Book, market depth, Level 2, - is a dynamically updated table with current volumes of orders to buy and to sell specific financial instument at price levels near Bid and Ask. MetaTrader 5 provides the means for receiving market book from your broker, but in real time only, without access to its history. The indicator OrderBook Cumulative Indicator accumulates market book data online and visualizes them on the chart. In addition, the indicator can show the market
Combined
Ahmed Alaaeldin Abdulrahman Ahmed Elherzawi
5 (1)
Welcome to Investment Castle products This product is exclusively available in the MQL5 market and is not available and will not be available anywehere else. The Combined indicator is a multi-time frame indicator and it is built using 3 indicators: Bands indicator which draws the support and resistance key levels using up to 5 different time frames Patterns indicator which draws the chart patterns using up to 6 different time frames Spots indicator which shows the common candlestick patterns Yo
Fibomathe
Almaquio Ferreira De Souza Junior
Fibomathe Indicator: Support and Resistance Tool for MT5 The Fibomathe Indicator is a technical analysis tool designed for MetaTrader 5 (MT5) that assists traders in identifying support and resistance levels, take-profit zones, and additional price projection areas. It is suitable for traders who use structured approaches to analyze price action and manage trades. Key Features Support and Resistance Levels: Allows users to define and adjust support and resistance levels directly on the chart.
ICT Order Flow Matrix
Sakariya Bhaskar Nitinbhai
ICT Order Flow Matrix   MetaTrader 5용 자동 기관 주문 블록 감지 개요   진정한 기관 주문 흐름 인사이트로 차트를 향상하세요. ICT Order Flow Matrix는 가격 움직임을 실시간으로 스캔하여 은행, 헤지펀드 및 프로프 트레이딩 데스크가 대규모 주문을 배치하는 위치를 식별합니다. 그런 다음 이러한 “Order Blocks”를 동적 지지 및 저항 구역으로 차트에 표시합니다—수동 드로잉 불필요. 주요 기능   - **자동 영역 감지**     수요와 공급의 불균형을 즉시 찾아내고 차트에 음영 영역으로 강조 표시합니다.   - **전문 데스크 하이라이트**     일반 기관 영역과 활성 프로프 데스크 수준을 구분하여 표시합니다.   - **시각적 매트릭스 레이아웃**     영역을 깔끔하게 열에 정렬하여 현재 시장 구조를 한눈에 제공합니다. 인사이트 및 이점   - **명확성** – 활성 ICT 영역만 표시되어 중요한 수준에 집중할 수 있습니
FREE
KDJ Index 4   交易实用必备工具指标 波浪自动计算指标,通道趋势交易 完美的趋势-波浪自动计算通道计算 , MT4版本 完美的趋势-波浪自动计算通道计算 , MT5版本 本地跟单复制交易 Easy And Fast Copy , MT4版本 Easy And Fast Copy , MT5版本 本地跟单复制交易 模拟试用 Easy And Fast Copy , MT4 模拟账号运行 Easy And Fast Copy , MT5 模拟账号运行 "Cooperative QQ:556024  "  "Cooperation wechat:556024"  "Cooperative email:556024@qq.com" 强烈推荐趋势指标, 波浪的标准自动计算   和   波浪的标准自动计算MT5版本     KDJ指标又叫 随机指标 ,是一种相当新颖、实用的技术分析指标,它起先用于期货市场的分析,后被广泛用于股市的中短期趋势分析,是期货和股票市场上最常用的技术分析工具。 随机指标KDJ一般是用于股票分析的统计体系,根据统计学原理,通过一个特定的周期(常为9日、9周等)
VSA target
Evgenii Bazhenov
VSA 목표 지표를 식별한 전문적인 구매자 또는 전문 판매자에 차트를 사용하 VSA(볼륨 확산 분석)시스템을 구축 트렌드 지원 영역에 상대적인 이러한 막대기(촛대),뿐만 아니라 대상으로 수준입니다.  특징: 1. 에서 이 표시기는,당신이 선택할 수 있습니다 이 모드에서는 전문 구매자 또는 전문 판매자 결정될 것이고,모두 전문적인 참여자에 결정됩니다. 2. 기호에 임의의 시간대를 설정하여 지원 영역과 목표 수준을 결정할 수 있습니다. 거래할 때,큰 기간은 설정을 결정하는 지역 및 목표 수준이고,자체 트랜잭션 수행할 수 있습에 작은 기간에 대한 더 정확한 항목으로 트랜잭션이 있습니다.  3. 에 표시 설정을 선택할 수 있습니다 틱는 경우 볼륨 틱 볼륨을 사용하고,실제 볼륨을 경우 실제 볼륨을 사용합니다. 4. 대형 판매자 또는 구매자를 결정할 때 볼륨 크기와이 볼륨의 검색 기간을 수동으로 선택할 수 있습니다. 5. 전문가를 만드는 데 사용될 수있다. 설명: 녹색 점선은 구매자의 지원
Antabod Multiplier
Rev Anthony Olusegun Aboderin
Antabod Multiplier , the ultimate trading indicator designed to simplify your decision-making process and maximize your trading potential. Built with a robust combination of moving averages and stochastic oscillators, this tool provides clear, actionable signals for both buy and sell opportunities. The Antabod Multiplier stands out with its dynamic trend detection and precision filtering, giving you real-time visual signals to catch trend reversals and optimal entry/exit points with ease. Whethe
SlopeChannelB MT5
MIKHAIL VINOGRADOV
SlopeChannelB – 경사진 가격 이동 채널을 구축하는 기술 분석 도구로, 시장 현황을 평가하고 거래 신호를 찾는 데 독특한 기회를 제공합니다. 지표의 주요 특징: 경사진 가격 이동 채널 : 이 지표는 지지와 저항 수준을 시각화하는 데 도움을 주며, 이는 추세의 반전 또는 지속 가능성을 나타낼 수 있습니다. 다양한 선 색상 및 배경 강조 : 경사진 지지 및 저항 수준은 다양한 색상으로 표시되며, 채널 자체는 배경이 추가로 강조되어 차트의 시각적 분석을 단순화합니다. 선 계산을 위한 세 가지 옵션 : 지표는 회귀 분석을 사용하여 채널 라인을 구성합니다. 세 가지 방법 중 하나를 선택할 수 있습니다: Robust (기본값) – 이상치에 강한 방법입니다. OLS (최소제곱법) . Median (중앙값 계산) . 최적의 모델 선택 : SlopeChannelB는 다섯 가지 품질 기준의 분석을 기반으로 가장 적합한 채널 라인 변형을 자동으로 선택합니다. 품질 매개변수는 차트에
TransitBlueOcean
Bonginkosi Innocent Khumalo
5 (1)
TransitBlueOcean is indicator system that uses ocean wave's pattern, to help one to know when to buy and when to sell. The indicator system is very powerful like the ocean waves. Join the mql5 channel for TransitBlueOcean  https://www.mql5.com/en/channels/transitblueocean   How to use: Zoom in so that the Ocean will appear on your chart. Buy when you see the candles, the candle will be above the ocean wave (buying signal). Sell when you can't see the candles, the candles will be inside the wav
Trade Helper
Pavel Gotkevitch
The Trade Helper indicator is a modification of the Trade Assistant indicator (by Andriy Moraru). The Trade Helper multitimeframe indicator is a good assistant for traders, useful as a filter in most trading strategies. This indicator combines the tactics of Elder's Triple Screen in a single chart, which lies in entering a trade when the same trend is present on three adjacent timeframes. The indicator operation is based on the principle of determining the trend on the three selected timeframes
BOS and CHOCH with Label Indicator MT5  The BOS-CHOCH market structure shift detector is an advanced tool designed for traders who analyze internal price movements on the MetaTrader 5 (MT5) platform . This indicator leverages sophisticated algorithms to cater specifically to traders following ICT (Inner Circle Trader) and Smart Money trading methods . It automatically detects Break of Structure (BOS) and Change of Character (CHOCH) and marks them on the chart with clearly labeled annotations. A
FREE
JAC Trend Color Candle
Eduardo Da Costa Custodio Santos
The indicator "JAC Trend Color Candle" for Meta Trader 5, was created to visually facilitate the trend for the trader. It is based on three parameters, which identifies the uptrend, downtrend and non-trending market. The colors are trader-configurable, and the average trader-configurable as well. trend parameters cannot be configured as they are the indicator's differential.
Ichimoku Kinko Hyo is a purpose-built trend trading charting system that has been successfully used in nearly every tradable market. It is unique in many ways, but its primary strength is its use of multiple data points to give the trader a deeper, more comprehensive view into price action. This deeper view, and the fact that Ichimoku is a very visual system, enables the trader to quickly discern and filter "at a glance" the low-probability trading setups from those of higher probability. This i
LT Rainbow Trend
Thiago Duarte
5 (1)
Do you, like me, like to trade with the trend? Then this indicator will help you! Rainbow Trend is a trend indicator, which uses several Moving Averages on the chart. It measures different trend strenght zones for different periods: very long term, long term, mid term, short term and very short term. Each zone has its color, and it is possible to have sound alert when the prices leaves a zone and enters another. Its configuration is very simple. If you find any bug or have any suggestions, conta
표시기는 현재 시세를 작성하여 과거 시세와 비교할 수 있으며 이를 바탕으로 가격 변동을 예측합니다. 표시기에는 원하는 날짜로 빠르게 이동할 수 있는 텍스트 필드가 있습니다. 옵션: 기호 - 표시기가 표시할 기호 선택. SymbolPeriod - 지표가 데이터를 가져올 기간 선택. IndicatorColor - 표시기 색상. HorisontalShift - 지시자가 그린 따옴표를 지정된 막대 수만큼 이동합니다. Inverse - true는 인용 부호를 반대로, false - 원래 보기를 반전합니다. ChartVerticalShiftStep - 차트를 수직으로 이동합니다(키보드의 위/아래 화살표). 다음은 날짜를 입력할 수 있는 텍스트 필드의 설정으로, '엔터'를 누르면 즉시 이동할 수 있습니다.
Ichimoku Signals Pro
Shahabeddin Baset
Features All Ichimoku Signals (Selectable) : Display all reliable signals generated by the Ichimoku indicator. You can choose which signals to view based on your preferences. Filter by Signal Strength : Sort signals by their strength—whether they are weak, neutral, or strong. Live Notifications : Receive real-time notifications for Ichimoku signals. Transparent Cloud : Visualize the Ichimoku cloud in a transparent manner. Available Signals Tenkensen-Kijunsen Cross Price-Kijunsen Cross Price-C
VR Grid Mt5
Vladimir Pastushak
3.43 (7)
VR 그리드 표시기는 사용자 정의 설정으로 그래픽 그리드를 생성하도록 설계 되었습니다. 표준 그리드 와 달리 VR 그리드는 원형 레벨 을 구축하는 데 사용됩니다. 사용자의 선택에 따라 라운드 수준 사이의 단계는 임의적일 수 있습니다. 또한 VR Grid는 다른 인디케이터나 유틸리티와는 달리 기간이 바뀌거나 단말기를 재부팅해도 그리드의 위치 를 유지합니다. 설정, 세트 파일, 데모 버전, 지침, 문제 해결 등은 다음에서 얻을 수 있습니다. [블로그] 다음에서 리뷰를 읽거나 작성할 수 있습니다. [링크] 버전 [MetaTrader 4] 수직 수준 은 실제 시간 간격을 기준으로 하며 누락 또는 존재하지 않는 기간은 무시 합니다. 따라서 레벨 사이의 단계는 사용자가 선택한 값과 엄격하게 일치합니다. VR 그리드 표시기를 사용할 때 트레이더는 모든 수준에서 스타일 , 수직선 및 수평선의 색상 및 두께를 변경할 수 있습니다. 이를 통해 금융 상품의 라운드 수준 을 제어할 수 있습니다. 라운
FREE
Golden Spike Premium
Kwaku Bondzie Ghartey
Golden Spikes Detector Acknowledgement and Dedications:  The name of this indicator was Inspired by an Original; Mr Grant Koopman; a Knowledgeable and experienced Synthetics trader. I dedicate this indicator to Mr Grant.  Overview:   The Golden Spikes Premium is a groundbreaking trading indicator meticulously crafted for the Boom and Crash indices on the Deriv market. Tailored to meet the needs of discerning traders, this powerful tool operates exclusively on the one-minute timeframe, providing
Advanced Trading Chaos
Sergei Gurov
5 (1)
Advanced Trading Chaos  The main purpose of the indicator is to help the trader detect the signals described by Bill Williams in his books to make a quick and correct trading decision. 1)Bullish/Bearish Reversal Bar(BDB) 2) Divergent Bar(DB) 3) Second Sage Signal — the third consecutive Awesome Oscillator bar  4) Working fractals (Fractals that worked above/below the red forehead  5) Three bar coloring modes 5.1) Coloring of bars according to the AO indicator (Including the squatting bar) 5.2
Donchian Channel DC
Renato Takahashi
Donchian Channel DC is the indicator of Donchian Channels, that plots maximum and minimum values of a specific period, besides mean value line. It´s possible to configure simple period for analysis and the indicator will plot all three values. You can trade with this indicator as trend or reversal, according to each strategy. Do not let to test others indicators as soon as others expert advisors.
Ichimoku Aiko MTF
Michael Jonah Randriamampionontsoa
Ichimoku Aiko MTF is a collection of technical indicators that show support and resistance levels, as well as momentum and trend direction. It is a multi-timeframe indicator so you don't need to change the chart timeframe when you want to see the ichimoku clouds on a higher timeframe.  eg. The chart timeframe is M15 and you want to see on the M15 timeframe chart the H1 ichimoku indicators (the ichimoku in Metatrader can't do that) that's why you need to use Ichimoku Aiko MTF.
The  Kijun-Sen Envelope  is a powerful trend-following indicator based on the  Kijun-Sen  line from the Ichimoku Kinko Hyo system. This tool creates dynamic upper and lower bands around the Kijun-Sen, forming an envelope that helps traders identify market trends, potential reversals, and overbought/oversold conditions. Key Features: • Trend Confirmation – Helps determine whether the market is in a strong uptrend, downtrend, or ranging phase. • Support & Resistance Zones – The envelope acts as
FREE
Point Black
Ignacio Agustin Mene Franco
Black Card Pack indicator 5/1 point black It has the strategy of professional bollingers where each arrow gives you a different entry signal. It is used to operate in m1 and in d1 It is used for scalping and intraday, modified for forex markets ! suitable for all pairs modified for synthetic index markets suitable for all pairs! Ideal for volatility and jumps!
The indicator detects and displays М. Gartley's Butterfly pattern. The pattern is plotted by the extreme values of the ZigZag indicator (included in the resources, no need to install). After detecting the pattern, the indicator notifies of that by the pop-up window, a mobile notification and an email. The pattern and wave parameters are displayed on the screenshots. The default parameters are used for demonstration purposes only in order to increase the amount of detected patterns. Parameters z
Vip Gold
Ignacio Agustin Mene Franco
VIP Gold It has the last indicator of the session Gold of the 4! It works in all temporalities. It is an indicator where it marks blocks of structures. the rebounds are on the red line up, and the green line down depending on which pair you use it, It is made for synthetic indices, crash and boom pairs It works as support and resistance also to better find the floor and ceiling of each pair.
IQuantum
Evgeniy Scherbina
The indicator IQuantum shows trading signals for 10 symbols in the daily chart: AUDCAD, AUDUSD, EURUSD, GBPCAD, GBPCHF, GBPUSD, NZDUSD, USDCAD, USDCHF, and USDJPY. Signals of the indicator are produced by 2 neural models which were trained independently from one another. The inputs for the neural models are normalised prices of the symbols, as well as prices of Gold, Silver and markers of the current day. Each neural model was trained in 2 ways. The Ultimate mode is an overfitted neural model
FREE
Follow The Line MT5
Oliver Gideon Amofa Appiah
4.52 (29)
This indicator obeys the popular maxim that: "THE TREND IS YOUR FRIEND" It paints a GREEN line for BUY and also paints a RED line for SELL. (you can change the colors). It gives alarms and alerts of all kinds. IT DOES NOT REPAINT and can be used for all currency pairs and timeframes. Yes, as easy and simple as that. Even a newbie can use it to make great and reliable trades. NB: For best results, get my other premium indicators for more powerful and reliable signals. Get them here: https://www.m
FREE
이 제품의 구매자들이 또한 구매함
Trend Screener Pro MT5
STE S.S.COMPANY
4.85 (82)
트렌드 표시기, 트렌드 트레이딩 및 필터링을 위한 획기적인 고유 솔루션, 하나의 도구 안에 내장된 모든 중요한 트렌드 기능! Forex, 상품, 암호 화폐, 지수 및 주식과 같은 모든 기호/도구에 사용할 수 있는 100% 다시 칠하지 않는 다중 시간 프레임 및 다중 통화 표시기입니다. Trend Screener는 차트에 점이 있는 화살표 추세 신호를 제공하는 효율적인 지표 추세 추종 지표입니다. 추세 분석기 표시기에서 사용할 수 있는 기능: 1. 트렌드 스캐너. 2. 최대 이익 분석이 있는 추세선. 3. 추세 통화 강도 측정기. 4. 경고가 있는 추세 반전 점. 5. 경고가 있는 강력한 추세 점. 6. 추세 화살표 Trend Screener Indicator가 있는 일일 분석 예, 일일 신호 성능...등은 여기에서 찾을 수 있습니다. 여기를 클릭하십시오. LIMITED TIME OFFER : Trend Screener Indicator는 50$ 및 평생 동안만 사용할 수 있습니다.
Divergence Bomber
Ihor Otkydach
5 (4)
이 지표를 구매하신 분께는 다음과 같은 혜택이 무료로 제공됩니다: 각 거래를 자동으로 관리하고, 손절/익절 수준을 설정하며, 전략 규칙에 따라 거래를 종료하는 전용 도우미 툴 "Bomber Utility" 다양한 자산에 맞게 지표를 설정할 수 있는 셋업 파일(Set Files) "최소 위험", "균형 잡힌 위험", "관망 전략" 모드로 설정 가능한 Bomber Utility의 셋업 파일 이 전략을 빠르게 설치, 설정, 시작할 수 있도록 돕는 단계별 영상 매뉴얼 주의: 위의 모든 보너스를 받기 위해서는 MQL5 개인 메시지 시스템을 통해 판매자에게 연락해 주세요. 독창적인 커스텀 지표인 “Divergence Bomber(다이버전스 봄버)”를 소개합니다. 이 지표는 MACD 다이버전스(괴리) 전략을 기반으로 한 올인원(All-in-One) 거래 시스템입니다. 이 기술 지표의 주요 목적은 가격과 MACD 지표 간의 다이버전스를 감지하고, **향후 가격이 어느 방향으로 움직일지를 알려주는
Algo Pumping
Ihor Otkydach
5 (11)
PUMPING STATION – 당신만을 위한 올인원(All-in-One) 전략 PUMPING STATION은 당신의 외환 거래를 더욱 흥미롭고 효과적으로 바꿔줄 혁신적인 인디케이터입니다. 단순한 보조 도구가 아니라, 강력한 알고리즘을 갖춘 완전한 거래 시스템으로서 보다 안정적인 트레이딩을 시작할 수 있도록 도와줍니다. 이 제품을 구매하시면 다음의 혜택을 무료로 받으실 수 있습니다: 전용 설정 파일: 자동 설정으로 최대의 퍼포먼스를 제공합니다. 단계별 동영상 가이드: PUMPING STATION 전략으로 거래하는 법을 배워보세요. Pumping Utility: PUMPING STATION과 함께 사용하도록 설계된 반자동 거래 봇으로, 거래를 더욱 쉽고 편리하게 만들어줍니다. ※ 구매 후 바로 저에게 메시지를 보내주세요. 추가 자료에 대한 접근 권한을 제공해드립니다. PUMPING STATION은 어떻게 작동하나요? 트렌드 컨트롤: 시장의 추세 방향을 즉시 파악합니다. 추세는 최고의
Golden Trend Indicator MT5
Noha Mohamed Fathy Younes Badr
4.89 (18)
Golden Trend indicator  is The best indicator for predicting trend movement this indicator never lags and never repaints and never back paints    and give  arrow buy and sell    before the candle appear  and it will help you and  will make your trading decisions clearer its work on all currencies and  gold and crypto and all time frame This unique  indicator uses very secret algorithms to catch the  trends, so you can trade using this indicator and see the trend clear on charts  manual guide and
TPSproTREND PrO MT5
Roman Podpora
4.72 (18)
VERSION MT4        —        ИНСТРУКЦИЯ RUS           —        INSTRUCTIONS  ENG 주요 기능: 렌더링 없이 정확한 입력 신호! 신호가 나타나면 관련성은 유지됩니다! 이는 신호를 제공한 후 변경하여 예금 자금 손실을 초래할 수 있는 다시 그리기 지표와의 중요한 차이점입니다. 이제 더 큰 확률과 정확도로 시장에 진입할 수 있습니다. 화살표가 나타난 후 목표에 도달(이익실현)하거나 반전 신호가 나타날 때까지 캔들을 색칠하는 기능도 있습니다. STOP LOSS / TAKE PROFIT 구역 표시 진입점 검색 시 시각적 명확성을 높이기 위해 시장 진입을 위한 최적 지점이 검색되는 BUY/SELL 영역을 초기에 표시하는 모듈을 만들었습니다. 정지 손실 수준 작업을 위한 추가 지능형 논리는 시간이 지남에 따라 크기를 줄이는 데 도움이 되므로 거래에 들어갈 때 초기 위험을 줄이는 데 도움이 됩니다(move sl). 더 높은 기간의 MIN
RelicusRoad Pro MT5
Relicus LLC
4.79 (19)
이제 $ 147 (몇 가지 업데이트 후 $ 499 증가) - 무제한 계정 (PCS 또는 MACS) RelicusRoad 사용 설명서 + 교육 비디오 + 비공개 Discord 그룹 액세스 + VIP 상태 시장을 보는 새로운 방법 RelicusRoad는 외환, 선물, 암호화폐, 주식 및 지수에 대한 세계에서 가장 강력한 거래 지표로서 거래자에게 수익성을 유지하는 데 필요한 모든 정보와 도구를 제공합니다. 우리는 초보자부터 고급까지 모든 거래자가 성공할 수 있도록 기술적 분석 및 거래 계획을 제공합니다. 미래 시장을 예측할 수 있는 충분한 정보를 제공하는 핵심 거래 지표입니다. 우리는 차트에서 말이 안 되는 여러 지표 대신 완전한 솔루션을 믿습니다. 타의 추종을 불허하는 매우 정확한 신호, 화살표 + 가격 조치 정보를 표시하는 올인원 표시기입니다. 강력한 AI를 기반으로 하는 RelicusRoad는 누락된 정보와 도구를 제공하여 교육하고 성공적인 트레이더인 트레이딩 전문가가 되도
Support And Resistance Screener는 하나의 지표 안에 여러 도구를 제공하는 MetaTrader에 대한 하나의 레벨 지표입니다. 사용 가능한 도구는 다음과 같습니다. 1. 시장 구조 스크리너. 2. 완고한 후퇴 영역. 3. 약세 후퇴 영역. 4. 일일 피벗 포인트 5. 주간 피벗 포인트 6. 월간 피벗 포인트 7. 고조파 패턴과 볼륨에 기반한 강력한 지지와 저항. 8. 은행 수준 구역. LIMITED TIME OFFER : HV 지원 및 저항 표시기는 50 $ 및 평생 동안만 사용할 수 있습니다. ( 원래 가격 125$ ) MQL5 블로그에 액세스하면 분석 예제와 함께 모든 프리미엄 지표를 찾을 수 있습니다. 여기를 클릭하십시오. 주요 특징들 고조파 및 볼륨 알고리즘을 기반으로 하는 강력한 지원 및 저항 영역. Harmonic 및 Volume 알고리즘을 기반으로 한 강세 및 약세 풀백 영역. 시장 구조 스크리너 일간, 주간 및 월간 피벗 포인트. 실제 거래의
Gold Stuff mt5
Vasiliy Strukov
4.93 (179)
Gold Stuff mt5는 금을 위해 특별히 설계된 추세 지표이며 모든 금융 상품에서도 사용할 수 있습니다. 표시기가 다시 그려지지 않고 지연되지 않습니다. 권장 기간 H1. 설정 및 개인 보너스를 받으려면 구매 후 즉시 저에게 연락하십시오!     강력한 지원 및 트렌드 스캐너 표시기의 무료 사본을 받으실 수 있습니다. 메시지를 보내주세요. 나!   설정 화살표 그리기 - 켜기 끄기. 차트에 화살표 그리기. 경고 - 가청 경고를 끕니다. 이메일 알림 - 켜기 끄기. 이메일 알림. Puch-notification - 켜기 끄기. 푸시 알림. 다음으로 색 영역을 조정합니다. Gold Stuff mt5는 금을 위해 특별히 설계된 추세 지표이며 모든 금융 상품에서도 사용할 수 있습니다. 표시기가 다시 그려지지 않고 지연되지 않습니다. 권장 기간 H1. 설정 및 개인 보너스를 받으려면 구매 후 즉시 저에게 연락하십시오!   설정 화살표 그리기 - 켜기 끄기. 차트에 화살표 그
Matrix Arrow Indicator MT5
Juvenille Emperor Limited
5 (13)
매트릭스 화살표 표시기 MT5 는 외환, 상품, 암호 화폐, 지수, 주식과 같은 모든 기호/도구에 사용할 수 있는 100% 다시 칠하지 않는 다중 기간 표시기를 따르는 고유한 10 in 1 추세입니다.  Matrix Arrow Indicator MT5 는 다음과 같은 최대 10개의 표준 지표에서 정보와 데이터를 수집하여 초기 단계에서 현재 추세를 결정합니다. 평균 방향 이동 지수(ADX) 상품 채널 지수(CCI) 클래식 하이켄 아시 캔들 이동 평균 이동 평균 수렴 발산(MACD) 상대 활력 지수(RVI) 상대 강도 지수(RSI) 포물선 SAR 스토캐스틱 오실레이터 윌리엄스의 백분율 범위 모든 지표가 유효한 매수 또는 매도 신호를 제공하면 강력한 상승/하락 추세를 나타내는 다음 캔들/막대가 시작될 때 해당 화살표가 차트에 인쇄됩니다. 사용자는 사용할 표시기를 선택하고 각 표시기의 매개변수를 개별적으로 조정할 수 있습니다. 매트릭스 화살표 표시기 MT5는 선택한 표시기에서만 정보를 수
MonetTrend
Aliya Bolek
MonetTrend — Премиум-индикатор для торговли по тренду (M30, H1, H4) MonetTrend — это мощный и визуально понятный трендовый индикатор, созданный для торговли на таймфреймах M30, H1 и H4. Он идеально подходит для работы с волатильными инструментами, такими как: • Золото (XAUUSD) • Криптовалюты (BTCUSD) • Валютные пары (EURUSD, USDJPY и др.) Ключевые особенности MonetTrend: • Автоматическое отображение Take Profit 1 (TP1) и Stop Loss (SL): После появления сигнала индикатор сразу показывает: • TP
FX Power MT5 NG
Daniel Stein
5 (15)
FX Power: 통화 강세 분석으로 더 스마트한 거래 결정을 개요 FX Power 는 어떤 시장 상황에서도 주요 통화와 금의 실제 강세를 이해하기 위한 필수 도구입니다. 강한 통화를 매수하고 약한 통화를 매도함으로써 FX Power 는 거래 결정을 단순화하고 높은 확률의 기회를 발견합니다. 트렌드를 따르거나 극단적인 델타 값을 사용해 반전을 예측하고자 한다면, 이 도구는 귀하의 거래 스타일에 완벽히 적응합니다. 단순히 거래하지 말고, FX Power 로 더 스마트하게 거래하세요. 1. FX Power가 거래자에게 매우 유용한 이유 통화와 금의 실시간 강세 분석 • FX Power 는 주요 통화와 금의 상대적 강세를 계산하고 표시하여 시장 역학에 대한 명확한 통찰력을 제공합니다. • 어떤 자산이 앞서고 있고 어떤 자산이 뒤처지는지 모니터링하여 보다 현명한 거래 결정을 내릴 수 있습니다. 포괄적인 멀티 타임프레임 뷰 • 단기, 중기 및 장기 타임프레임에서 통화와 금의 강세를
FX Volume MT5
Daniel Stein
4.82 (17)
FX Volume: 브로커 시각에서 바라보는 진짜 시장 심리 간단 요약 트레이딩 접근 방식을 한층 더 향상시키고 싶으신가요? FX Volume 는 소매 트레이더와 브로커의 포지션을 실시간으로 파악할 수 있게 해 줍니다. 이는 COT 같은 지연된 보고서보다 훨씬 빠릅니다. 꾸준한 수익을 추구하는 분이든, 시장에서 더 깊은 우위를 원하시는 분이든, FX Volume 을 통해 대규모 불균형을 찾아내고, 돌파 여부를 확인하며 리스크 관리를 정교화할 수 있습니다. 지금 시작해 보세요! 실제 거래량 데이터가 의사결정을 어떻게 혁신할 수 있는지 직접 경험해 보시기 바랍니다. 1. 트레이더에게 FX Volume이 매우 유익한 이유 탁월한 정확도를 지닌 조기 경보 신호 • 다른 사람들보다 훨씬 앞서, 각 통화쌍을 매수·매도하는 트레이더 수를 거의 실시간으로 파악할 수 있습니다. • FX Volume 은 여러 리테일 브로커에서 추출한 실제 거래량 데이터를 종합해 명확하고 편리한 형태로 제공하는
TPSpro RFI Levels MT5
Roman Podpora
4.55 (20)
주요 플레이어의 반전 구역 / 피크 볼륨 / 활성 구역 =       TS TPS프로시스템 지침 RUS       /       지침       영어       /           버전 MT4        이 지표를 구매한 모든 구매자는 또한 다음을 무료로 받습니다. RFI SIGNALS 서비스의 거래 신호에 6개월 동안 액세스할 수 있습니다. TPSproSYSTEM 알고리즘에 따른 즉시 사용 가능한 진입 포인트입니다. 정기적으로 업데이트되는 교육 자료 - 전략에 푹 빠져서 전문가 수준을 높여보세요. 주중 24/5 지원 및 비공개 트레이더 채팅 이용 - 시장 상황에 대한 소통, 지원 및 분석. 저자가 설정한 파일 - 별도의 노력 없이 최대 결과를 얻을 수 있도록 지표를 자동으로 설정합니다. 주요 기능: 판매자와 구매자의 활동 영역을 표시합니다! 이 지표는 매수 및 매도에 대한 모든 올바른 첫 번째 임펄스 레벨/존을 표시합니다. 진입점 검색이 시작되는 이러한 레벨/존이 활성화되면
Quantum TrendPulse
Bogdan Ion Puscasu
5 (13)
SuperTrend   ,   RSI   ,   Stochastic   의 힘을 하나의 포괄적인 지표로 결합하여 트레이딩 잠재력을 극대화하는 궁극의 트레이딩 도구   인 Quantum TrendPulse를   소개합니다. 정밀성과 효율성을 추구하는 트레이더를 위해 설계된 이 지표는 시장 추세, 모멘텀 변화, 최적의 진입 및 종료 지점을 자신 있게 식별하는 데 도움이 됩니다. 주요 특징: SuperTrend 통합:   주요 시장 추세를 쉽게 따라가고 수익성의 물결을 타세요. RSI 정밀도:   매수 과다 및 매도 과다 수준을 감지하여 시장 반전 시점을 파악하는 데 적합하며 SuperTrend 필터로 사용 가능 확률적 정확도:   변동성이 큰 시장에서 숨겨진 기회를 찾기 위해 확률적 진동   을 활용하고 SuperTrend의 필터로 사용 다중 시간대 분석:   M5부터 H1 또는 H4까지 다양한 시간대에 걸쳐 시장을 최신 상태로 유지하세요. 맞춤형 알림:   맞춤형 거래 조건이 충족되면
FX Levels MT5
Daniel Stein
5 (4)
FX Levels: 모든 시장을 위한 뛰어난 정확도의 지지와 저항 간단 요약 통화쌍, 지수, 주식, 원자재 등 어떤 시장이든 믿을 만한 지지·저항 레벨을 찾고 싶나요? FX Levels 는 전통적인 “Lighthouse” 기법과 첨단 동적 접근을 결합해, 거의 보편적인 정확성을 제공합니다. 실제 브로커 경험을 반영하고, 자동화된 일별 업데이트와 실시간 업데이트를 결합함으로써 FX Levels 는 가격 반전 포인트를 파악하고, 수익 목표를 설정하며, 자신 있게 트레이드를 관리할 수 있게 돕습니다. 지금 바로 시도해 보세요—정교한 지지/저항 분석이 어떻게 여러분의 트레이딩을 한 단계 끌어올릴 수 있는지 직접 확인하세요! 1. FX Levels가 트레이더에게 매우 유용한 이유 뛰어난 정확도의 지지·저항 존 • FX Levels 는 다양한 브로커 환경에서도 거의 동일한 존을 생성하도록 설계되어, 데이터 피드나 시간 설정 차이로 인한 불일치를 해소합니다. • 즉, 어떤 브로커를 사용하
*** Entry In The Zone and SMC Multi Timeframe 은 Smart Money Concept (SMC)을 기반으로 한 실시간 시장 분석 도구 입니다. 이 도구는 반전 신호 와 **다중 시간대 구조 감지(Multi-Timeframe Structure Detection)**를 통합하여 주요 반전 구역(POI)을 자동으로 식별합니다. 이를 통해 트레이더가 더 체계적이고 자신감 있게 거래 계획과 결정을 내릴 수 있도록 지원 합니다. 주요 기능: - 자동 시장 구조 감지 (BOS  CHoCH, mBOS  mCHoCH) - Order Blocks, 공급 & 수요 구역, Fair Value Gaps (FVG) 식별 - 유동성 구역, Premium  Discount 영역, Equal Highs  Equal  Lows - 주요 관심 구역 (POI) - 거래 세션 시간 분석 (도쿄, 런던, 뉴욕) - 사용자 맞춤 자동 -계산 및 하이라이팅대시보드 -  신호 재도색 없음!
MetaBands M5
Vahidreza Heidar Gholami
4.5 (2)
MetaBands uses powerful and unique algorithms to draw channels and detect trends so that it can provide traders with potential points for entering and exiting trades. It’s a channel indicator plus a powerful trend indicator. It includes different types of channels which can be merged to create new channels simply by using the input parameters. MetaBands uses all types of alerts to notify users about market events. Features Supports most of the channel algorithms Powerful trend detection algorith
MONEYTRON – ТВОЙ ЛИЧНЫЙ СИГНАЛ НА УСПЕХ! XAUUSD | AUDUSD | USDJPY | BTCUSD Поддержка таймфреймов: M5, M15, M30, H1 Почему трейдеры выбирают Moneytron? 82% успешных сделок — это не просто цифры, это результат продуманной логики, точного алгоритма и настоящей силы анализа. Автоматические сигналы на вход — не нужно гадать: когда покупать, когда продавать. 3 уровня Take Profit — ты сам выбираешь свой уровень прибыли: безопасный, уверенный или максимум. Четкий Stop Loss — контролируешь риск
Atomic Analyst MT5
Issam Kassas
4.32 (19)
우선적으로 언급할 점은이 거래 지표가 다시 그리지 않고 지연되지 않으며 이를 통해 수동 및 로봇 거래 모두에 이상적이라는 점입니다. 사용자 매뉴얼: 설정, 입력 및 전략. Atomic Analyst는 가격의 강도와 모멘텀을 활용하여 시장에서 더 나은 이점을 찾는 PA Price Action Indicator입니다. 고급 필터를 장착하여 잡음과 거짓 신호를 제거하고 거래 잠재력을 높이는 데 도움이 됩니다. 복잡한 지표의 다중 레이어를 사용하여 Atomic Analyst는 차트를 스캔하고 복잡한 수학적 계산을 간단한 신호와 색상으로 변환하여 초보 트레이더가 이해하고 일관된 거래 결정을 내릴 수 있도록합니다. "Atomic Analyst"는 새로운 및 경험이 풍부한 트레이더를위한 종합적인 거래 솔루션입니다. 프리미엄 지표와 최고 수준의 기능을 하나의 거래 전략에 결합하여 모든 종류의 트레이더에 대한 다재다능한 선택지가되었습니다. 인트라데이 거래 및 스캘핑 전략 : 빠르고 정확한 일일
우선적으로, 이 거래 도구는 전문적인 거래에 이상적인 비-다시 그리기 및 지연되지 않는 지표입니다.  온라인 강좌, 사용자 매뉴얼 및 데모. 스마트 가격 액션 컨셉트 인디케이터는 신규 및 경험 많은 트레이더 모두에게 매우 강력한 도구입니다. Inner Circle Trader Analysis 및 Smart Money Concepts Trading Strategies와 같은 고급 거래 아이디어를 결합하여 20가지 이상의 유용한 지표를 하나로 결합합니다. 이 인디케이터는 스마트 머니 컨셉트에 중점을 두어 대형 기관의 거래 방식을 제공하고 이동을 예측하는 데 도움을 줍니다.  특히 유동성 분석에 뛰어나 기관이 어떻게 거래하는지 이해하는 데 도움을 줍니다. 시장 트렌드를 예측하고 가격 변동을 신중하게 분석하는 데 탁월합니다. 귀하의 거래를 기관 전략에 맞추어 시장의 동향에 대해 더 정확한 예측을 할 수 있습니다. 이 인디케이터는 시장 구조를 분석하고 중요한 주문 블록을 식별하고 다양
CBT Quantum Maverick
Arpit Sharma
1 (1)
CBT Quantum Maverick 고효율 바이너리 옵션 거래 시스템 CBT Quantum Maverick는 정밀하고 간단하며 체계적인 거래를 원하는 트레이더를 위해 설계된 고성능 바이너리 옵션 거래 시스템입니다. 사용자 지정이 필요 없으며, 처음부터 최적화된 결과를 제공합니다. 약간의 연습만으로 신호를 쉽게 마스터할 수 있습니다. 주요 특징: 정확한 신호 제공: 현재 봉 데이터를 기반으로 다음 캔들에 대한 신호를 생성하며, 빈번한 재도색이 없습니다. 다양한 시장에 대한 적응성: 바이너리 옵션 거래에 특화되었으며, 여러 브로커 및 자산 클래스와 호환됩니다. 호환 가능: Deriv Synthetic Charts: 모든 시간 프레임에서 사용 가능. OTC 차트: Quotex, PocketOption, Binomo, Stockity, IQOption, Exnova, OlympTrade, Deriv, Binolla, Homebroker 등의 브로커와 호환(MT5로의 무료 데이터 임
Basic Harmonic Patterns Dashboard MT5
Mehran Sepah Mansoor
4.22 (9)
이 대시보드는 선택한 심볼에 대해 사용 가능한 최신 고조파 패턴을 표시하므로 시간을 절약하고 더 효율적으로 사용할 수 있습니다 /   MT4 버전 . 무료 인디케이터:   Basic Harmonic Pattern 인디케이터 열 Symbol :   선택한 심볼이 나타납니다 Trend :   강세 또는 약세 Pattern :   패턴 유형(가틀리, 나비, 박쥐, 게, 상어, 사이퍼 또는 ABCD) Entry :   진입 가격 SL:   스톱로스 가격 TP1:   1차 테이크프로핏 가격 TP2:   2차 테이크프로핏 가격 TP3:   3차 테이크프로핏 가격 Current price:   현재 가격 Age (in bars):   마지막으로 그려진 패턴의 나이 주요 입력 Symbols :   "28개 주요 통화쌍" 또는 "선택한 심볼" 중에서 선택합니다. Selected Symbols :   쉼표로 구분하여 모니터링하려는 원하는 심볼("EURUSD,GBPUSD,XAUUSD")을 선택
IX Power MT5
Daniel Stein
4.86 (7)
IX Power: 지수, 원자재, 암호화폐 및 외환 시장 통찰력을 발견하세요 개요 IX Power 는 지수, 원자재, 암호화폐 및 외환 시장의 강도를 분석할 수 있는 다목적 도구입니다. FX Power 는 모든 가용 통화 쌍 데이터를 사용하여 외환 쌍에 대해 가장 높은 정확도를 제공하는 반면, IX Power 는 기초 자산 시장 데이터에만 초점을 맞춥니다. 이로 인해 IX Power 는 비외환 시장에 이상적이며, 다중 쌍 분석이 필요하지 않은 간단한 외환 분석에도 신뢰할 수 있는 도구입니다. 모든 차트에서 매끄럽게 작동하며, 거래 결정을 향상시키기 위한 명확하고 실행 가능한 통찰력을 제공합니다. 1. IX Power가 트레이더에게 유용한 이유 다양한 시장 강도 분석 • IX Power 는 지수, 원자재, 암호화폐 및 외환 심볼의 강도를 계산하여 각 시장에 맞는 통찰력을 제공합니다. • US30, WTI, 금, 비트코인 또는 통화 쌍과 같은 자산을 모니터링하여 거래 기회를 발견
FX Dynamic: 맞춤형 ATR 분석으로 변동성과 트렌드를 파악하세요 개요 FX Dynamic 는 Average True Range(ATR) 계산을 활용하여 트레이더에게 일간 및 일중 변동성에 대한 뛰어난 인사이트를 제공하는 강력한 도구입니다. 80%, 100%, 130%와 같은 명확한 변동성 임계값을 설정함으로써 시장이 평소 범위를 초과할 때 빠르게 경고를 받고, 유망한 수익 기회를 재빨리 식별할 수 있습니다. FX Dynamic 는 브로커의 시간대를 인식하거나 수동으로 조정할 수 있으며, 변동성 측정 기준을 일관되게 유지하며, MetaTrader 플랫폼과 완벽하게 연동되어 실시간 분석을 지원합니다. 1. FX Dynamic이 트레이더에게 매우 유용한 이유 실시간 ATR 인사이트 • 하루 및 일중 변동성을 한눈에 모니터링하세요. ATR의 80%, 100%, 130% 임계값이 도달 또는 초과되면, 시장의 중요한 지점에 있음을 알 수 있습니다. • 변동성이 완전히 폭발하기
우선, 이 트레이딩 인디케이터는 재탐색되지 않으며, 다시 그려지지 않고, 지연이 없는 점을 강조할 가치가 있습니다. 이는 수동 트레이딩과 알고리즘 트레이딩 모두에 이상적입니다. 사용자 매뉴얼, 프리셋 및 온라인 지원이 포함됩니다. AI Trend Pro Max는 정밀도, 강력함, 단순함을 추구하는 트레이더를 위해 설계된 정교한 올인원 트레이딩 시스템입니다. 이전 지표들의 개발을 바탕으로 만들어졌으며, 현재까지 가장 진화된 버전으로, 여러 신호 층, 전문 필터 및 스마트한 사용자 인터페이스가 장착되어 있습니다. 초보자든 전문가든 상관없이, AI Trend Pro Max는 어떤 시장 상황에서도 자신감을 가지고 거래할 수 있도록 필요한 모든 것을 제공합니다. 주요 전략 및 시스템 로직: 다층 신호 엔진: 트렌드 모멘텀, 가격 강도, 거래량, RSI, 볼린저 밴드 및 캔들 색상 논리를 결합하여 고확률의 진입 신호를 제공합니다. 트렌드 모멘텀: 트렌드가 강화되고 있는지 약화되고 있는지
Trend Forecaster
Alexey Minkov
5 (6)
The Trend Forecaster indicator utilizes a unique proprietary algorithm to determine entry points for a breakout trading strategy. The indicator identifies price clusters, analyzes price movement near levels, and provides a signal when the price breaks through a level. The Trend Forecaster indicator is suitable for all financial assets, including currencies (Forex), metals, stocks, indices, and cryptocurrencies. You can also adjust the indicator to work on any time frames, although it is recommen
Auto Order Block with break of structure based on ICT and Smart Money Concepts (SMC) Futures Break of Structure ( BoS )             Order block ( OB )            Higher time frame Order block / Point of Interest ( POI )    shown on current chart           Fair value Gap ( FVG ) / Imbalance   -  MTF      ( Multi Time Frame )    HH/LL/HL/LH  -  MTF      ( Multi Time Frame )  Choch  MTF      ( Multi Time Frame )  Volume Imbalance     ,  MTF          vIMB Gap’s Power of 3 Equal High / Low’s  
Easy Buy Sell Signal Alert
Franck Martin
4.56 (9)
Easy Buy Sell is a market indicator for opening and closing positions. It becomes easy to track market entries with alerts. It indicates trend reversal points when a price reaches extreme values ​​and the most favorable time to enter the market. it is as effective as a Fibonacci to find a level but it uses different tools such as an algorithm based on ATR indicators and Stochastic Oscillator. You can modify these two parameters as you wish to adapt the settings to the desired period. It cannot
Special offer : ALL TOOLS , just $35 each! New tools   will be   $30   for the   first week   or the   first 3 purchases !  Trading Tools Channel on MQL5 : Join my MQL5 channel to update the latest news from me ICT의 Inversion Fair Value Gap (IFVG) 개념을 Inversion Fair Value Gaps Indicator 로 활용해보세요! 이 첨단 도구는 Fair Value Gap(FVG)을 한 단계 끌어올려, 역전된 FVG 영역을 식별하고 표시합니다. 이러한 영역은 가격 조정 후 형성되는 주요 지지 및 저항 구역입니다. 스캘퍼, 스윙 트레이더 또는 장기 투자자이든 상관없이 IFVG 지표는 실시간 의사결정을 위한 귀중한 통찰력을 제공합니다. MT4 버전 보기:  Inversion Fair Va
Blahtech Supply Demand MT5
Blahtech Limited
4.54 (13)
Was: $299  Now: $149  Supply Demand uses previous price action to identify potential imbalances between buyers and sellers. The key is to identify the better odds zones, not just the untouched ones. Blahtech Supply Demand indicator delivers functionality previously unavailable on any trading platform. This 4-in-1 indicator not only highlights the higher probability zones using a multi-criteria strength engine, but also combines it with multi-timeframe trend analysis, previously confirmed swings
제작자의 제품 더 보기
Trend Line1
Zhi Xian Hou
5 (4)
Indicator Introduction: The indicator comes from network ,It is more stable relative to RSI or CCI. You can set the indicator to send emails/notifications/alerts when the previous bar has an up or down arrow, you can specify the text of emails by inputing string into the parameter box of  "UpMessages/DownMessages". It can be used to analyze market trend and design new expert that is based on trend. If the indicator below the axis ,this is a buy zone. The trend indicator is suitable for M1 and ab
FREE
지표 소개: 지표는 추세선과 히스토그램을 그립니다. 가격 지연이 적고 미래 기능이 없으며 신호가 표류하지 않습니다. 시장이 지역간 변동을 보일 때 표시기가 빨간색과 녹색 히스토그램으로 나타나면 저가 구역이고, 표시기가 자홍색과 노란색 히스토그램으로 나타나면 고가 구역입니다. 또한 고가 및 저가 영역에 따라 시장의 추세를 분석하는 데 사용할 수 있습니다. 표시기 이전 k 라인에 위쪽 화살표 또는 아래쪽 화살표가 있을 때 이 신호를 사용하여 때때로 거래할 수 있도록 편의를 제공하기 위해 이메일, 경고 및 알림을 보낼 수 있습니다. 표시기에는 히스토그램의 높이, 선의 기간 및 비율을 포함하여 변경 가능한 매개변수가 있습니다. 모든 시간대에 적용되며 M1 이상의 시간대에 적합합니다. 표시기의 작업은 스크린샷에 나와 있습니다.   이 표시기가 거래에 도움이 되기를 바랍니다.
FREE
Alert Waves for mt5
Zhi Xian Hou
4.5 (2)
Indicator introduction: The indicator draws wave lines and histograms, It has small price lag, and the signal will not drift. The indicator can send emails, alerts and notifications to you when previous k line has an up arrow and it is under the histogram sections or it has a down arrow. you can choose whether or not to send the two kind of alerts, the alerts repetition times can also be changed. If the indicator appears red and green histograms, this is a buy zone. It can be used to analyze mar
FREE
Indicator introduction: The indicator is calculated by volumes and prices, It is a single side indicator, only has up arrow signals. It is better to use it in conjunction with other trend indicators, and you need to find the most efficient time to use it in order to acquire a high winning probability. The indicator can send emails, alerts and notifications to you when the indicator before k line has an up arrow. The indicator's parameters can be changed, including the computation period of the
FREE
The Waterfall Trend Indicator MT5 uses line regression algorithm, using "Waterfall" in its name is in that it like waterfall when there is a strong down market trend. The indicator draws seven lines, one of which is sold line, others are dash line, the sold line is more stable. Indicator introduction  The indicator can effectively filter price noise since it is calculated with line regression. It can be used to analyze market trend and design new expert that is based on trend. When the trend lin
Advanced Trader MT5 is a fully automated trading robot developed by using custom indicator "Trend for MT5", which can be found here . The expert has been tested on AUDNZD、NZDCAD、AUDCAD and USDCHF using historical data of many years, you can also test it using real ticks history data on MT5 backtest platform. Even if you don't want to 100% automatically trade by it, you can still use it as a good tool for trading, there is parameters for you to control the EA trading and use it as a trade assist
Gold EA MT5
Zhi Xian Hou
GOLD EA MT5는 "Trend for MT5" 지표를 사용하여 개발된 전자동 거래 로봇입니다. 신경망+그리드 시스템을 기반으로 수익 가능성이 높고 위험이 낮은 거래 기회를 선택합니다. 최소 초기 예치금은 0.01 초기 로트당 250 USD이며, 모든 포지션에는 숨겨진 손절매가 있습니다. EA는 XAUUSD에서 좋은 성과를 내고 있으며 최대 하락폭은 상대적으로 낮습니다. 1분 공개 가격   백테스트를   사용할 수 있습니다.       백 테스트를 수행하기 위해 MT5 클라이언트의 모드. 이 EA의 가치는 현재 가격보다 더 가치가 있으며 다음 가격은 상승해야 합니다. EA 운영: 가격의 마지막 소수점이 추가된 헤지 계정 및 중개인에게만 적합합니다. EA는 스프레드와 미끄러짐에 민감하지 않지만 우수한 ECN 브로커를 사용하는 것이 좋습니다. XAUUSD에만 사용되며 기본 기간은 M15입니다. EA의 사용은 매우 간단합니다. EA를   XAUUSD   차트로 로드하면 자동으로 거래
Indicator introduction:  A channel and trend line indicator, which is a good tool for manual trading, and also can be used for creating new EAs, without drifting or repainting.  It applies to any timeframes and any symbols.   The work of the indicator is shown in the screenshots. For any novice and programming trading friend, you can write the signal into the EA to play freely, buffer 0 corresponds to the bold trend line, buffer 4 and 5 respectively corresponds to the channel's upper and lower f
필터:
리뷰 없음
리뷰 답변