ZT Candles AM
- 지표
- Andriy Matviyevs'kyy
- 버전: 27.0
- 업데이트됨: 13 2월 2025
- 활성화: 10
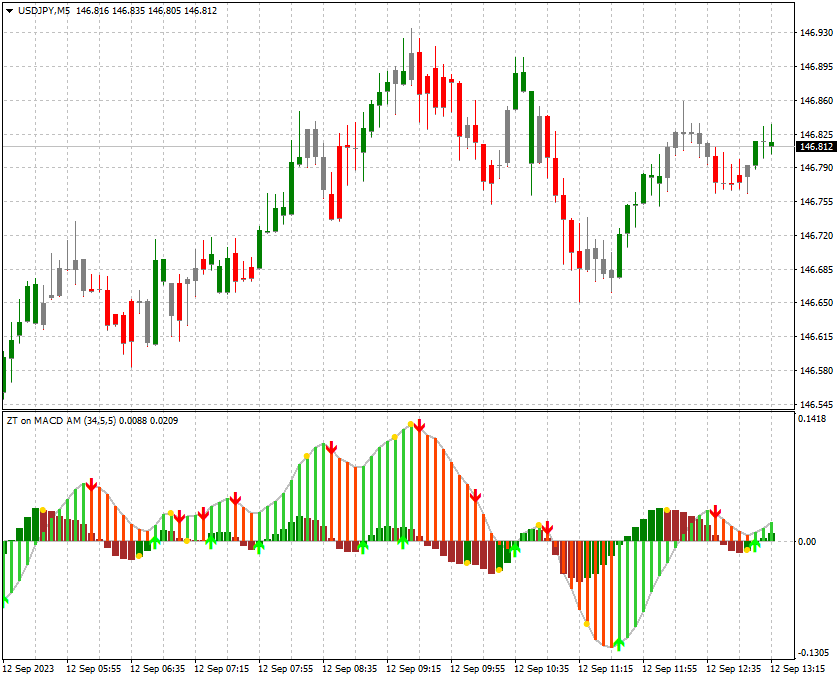
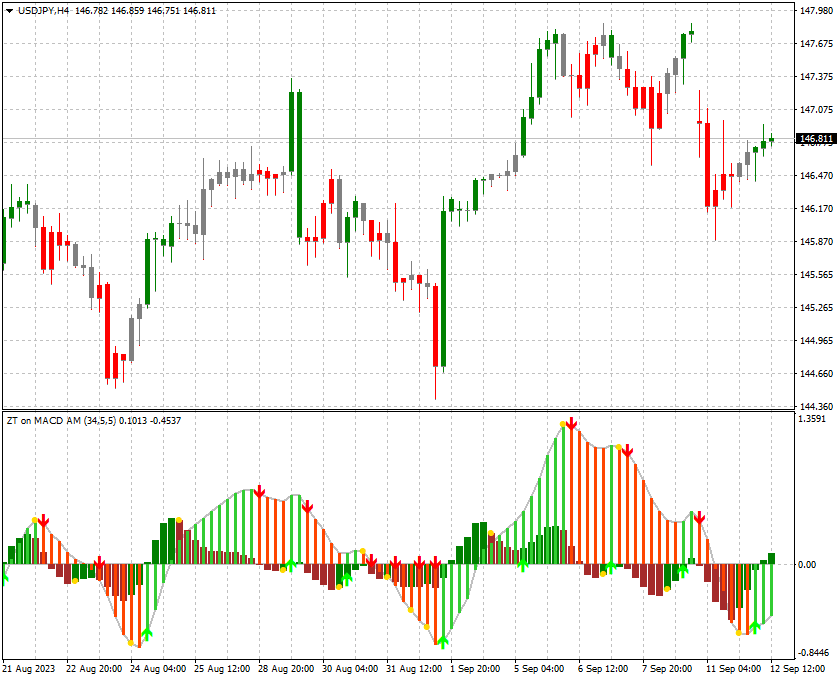
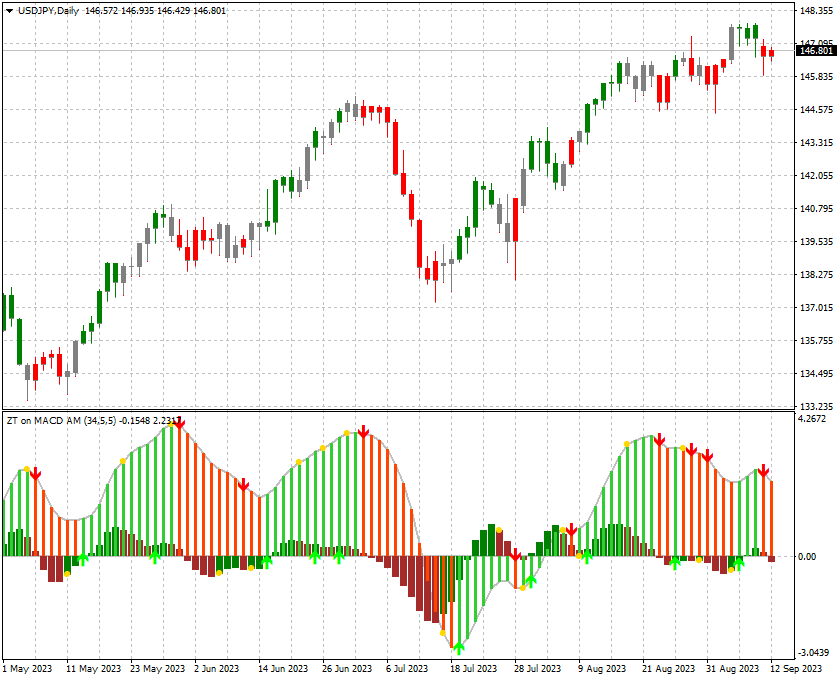
The indicator displays elements of the trading system, name trading in the zone, described by Bill Williams.
Sell signals are formed when MACD and OsMA values are falling simultaneously (Bill Williams calls these indicators АО and АС in his book), while buy signals appear when both indicators are rising.
The values of AO and AC are falling - the candle is colored red.
Values of AO and AC are growing - the candlestick is colored green.
In other cases, the candle is colored gray.
The indicator signals are confirmed when the price exceeds the High/Low of the bar where the indicator generated the signal.
The indicator is intended for trend trading. Countertrend signals are only used to close positions.
A product that provides an opportunity to independently choose the AO and AC parameters for your trading style - ZT on MACD AM.