ZeroOptZigZag
- 지표
- Stanislav Korotky
- 버전: 1.1
- 업데이트됨: 23 11월 2021
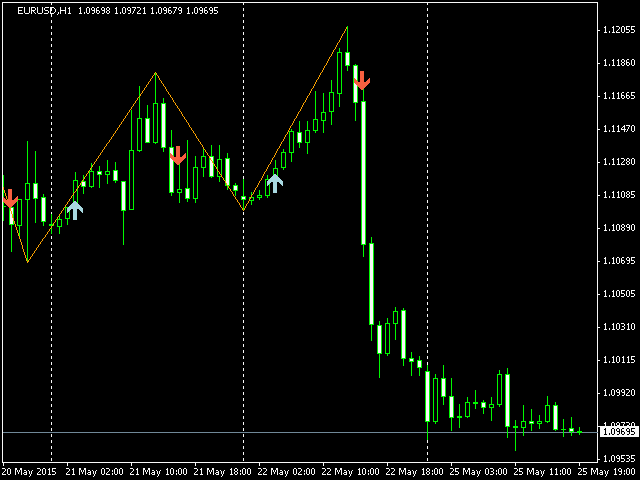
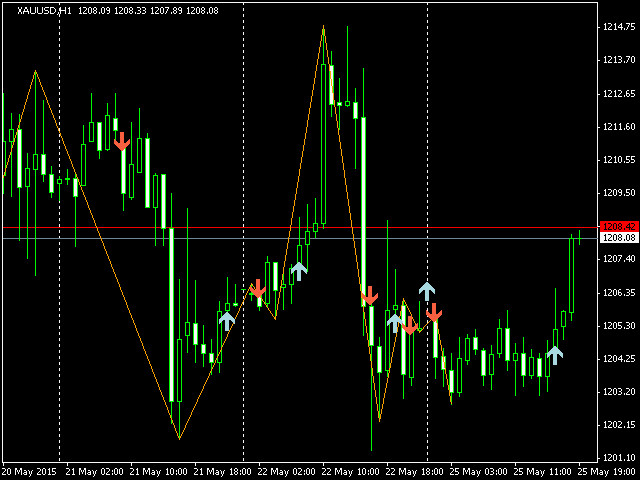
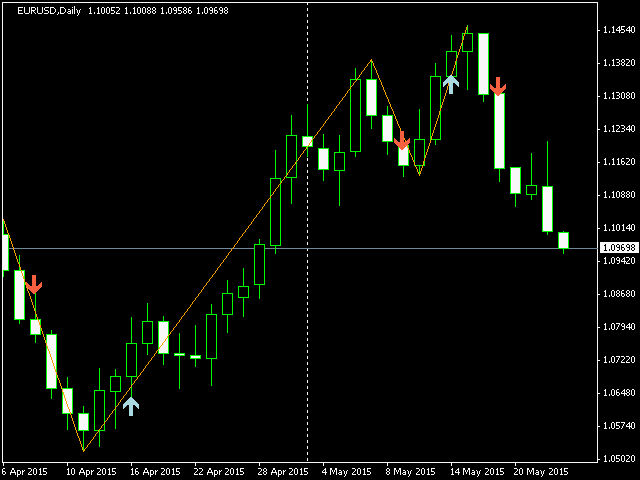
This is yet another non-parametric ZigZag. Its every upward edge continues until next bar's high is formed below highest low of its bars, and every downward edge continues until next bar's low is formed above lowest high of its bars.
In addition to zigzag itself (shown in orange color), the indicator shows signal marks on those bars where zigzag direction changes. The blue arrow up denotes that new bullish edge is started (but not yet completed), whereas the red arrow down denotes that new bearish edge is emerging (but not yet completed). This marks can be used as trading signals. Only complete edges are displayed.
The latest zero bar is changing as new ticks arrive. This means that the signals on the zero bar are unstable (the arrows may appear and then vanish depending on the bar evolution). Use it with caution. All other bars are stable.







사용자가 평가에 대한 코멘트를 남기지 않았습니다