Market Profile
- 지표
- Artem Titarenko
- 버전: 1.4
- 업데이트됨: 6 3월 2023
- 활성화: 10
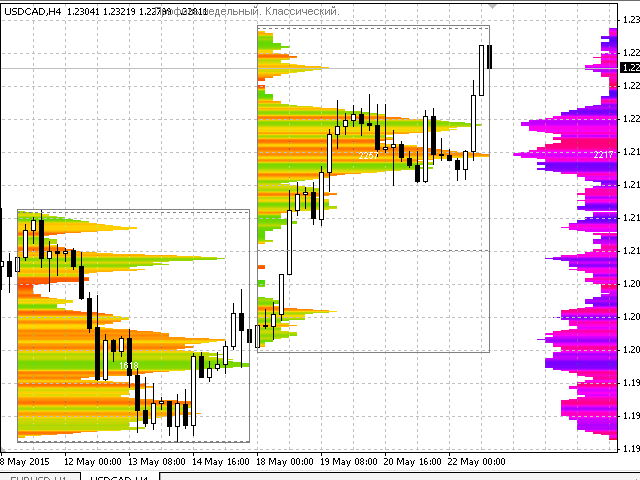
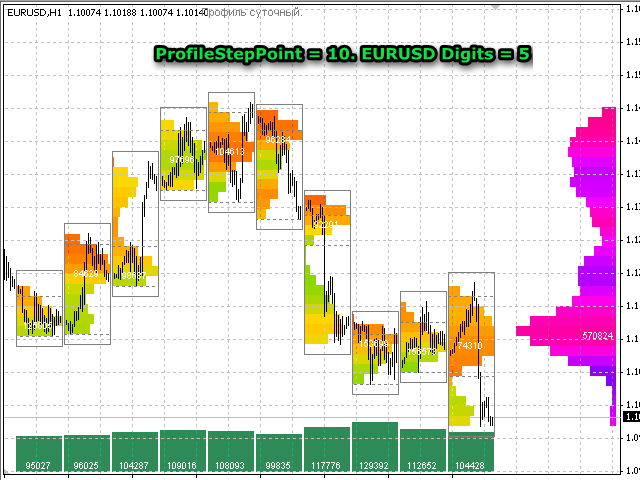
The "Market Profile" indicator displays the profiles and volumes of periods – weekly, daily, session (8-hour), 4-hour, hour, summary.
The VAH/VAL price area is automatically highlighted by a dotted line for each profile (except for the summary).
The indicator includes chroma Delta, which colors the profile areas. The areas of prevailing Buys is colored in green, that of Sells - in red. The intensity histogram features blue/red respectively.
In the filter mode, the indicator displays the volume accumulation areas based on the histogram data for each profile (see the details in the description of variables).
To calculate the profile histograms, the indicator uses history price data of the M1 timeframe, therefore make sure to download the M1 history.
We will not discuss indicator based trading methods here. However, if you take an interest in this type of indicators, then definitely you are moving in the right direction. Application of the "Market Profile" implies tracking the activity of "smart money" on a price chart.
The indicator is automated, has no complicated settings, and is easy to use. The variables of the indicator settings are protected from incorrect values.
Indicator Settings
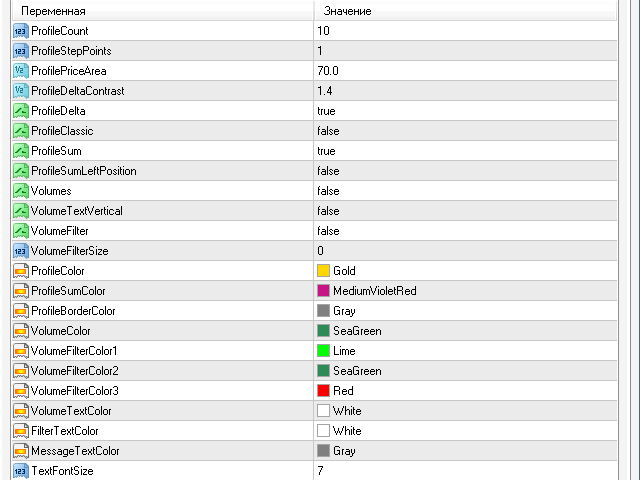
- ProfileCount – The number of displayed profiles. The minimum is 1, maximum is 48. When displaying week profiles, the amount of generated profiles are automatically limited to 8, simply because the M1 history on trade servers is usually limited to the last two or three months. No profiles are created beyond the visibility to the left of the left chart border.
- ProfileStepPoints – The step of calculation and creation of the profile histograms. Set in pixels of the monitor. The minimum is 1, maximum is 10.
- ProfilePriceArea – The price are. The default value is 70.0%.
- ProfileDeltaContrast – The ratio of the chroma Delta, it is a purely visual parameter. In the pictures of the higher timeframe, profiles start to fade, with the help of this option you only need to make contrast more obvious. The minimum parameter value is 1.0, maximum is 2.0, fractional step is used.
- ProfileDelta – Enabling/disabling the chroma delta methods.
- ProfileClassic – Enables/disables the classic (without taking into account the tick volumes candles) profile. When this mode is enabled, the volume of each minute candlestick used for the calculations is set equal to its (High-Low)/Point. Point in this formula is the size of one point, i.e. the minimum price deviation.
- ProfileSum – Enables/disables displaying the summary profile.
- ProfileSumLeftPosition – If true, the total profile is in the left part of the chart, false – in the right.
- Volumes – Enables/disables the scale of volumes.
- VolumeFilter – Enables/disables the filter volume.
- VolumeFilterOnProfile – Only works when VolumeFilter is enabled, set to true to enable the mode filter the volumes displayed directly on the profiles.
- VolumeFilterSize – If the value is zero, the volume accumulation areas are filtered out and painted automatically. Automatic filtering is based on the max value calculation that uses the profile with the highest maximum of the histogram. The entire volume held for the period of this profile is conventionally placed in the area S of a triangle inscribed in a square (see the figure below). Accordingly, max=sqrt(S*2). Next, max is divided into five equal parts, with volf1=max/5*2. In manual operation, the value volf1 this is the input parameter VolumeFilterSize – slice of the top of the histogram. Values volf2 and volf3 are automatically calculated from the balance, in equal shares.
- ProfileColor – The сolor of the profiles if ProfileDelta is disabled.
- ProfileSumColor – The color of the summary profile if ProfileDelta is disabled.
- ProfileBorderColor – profile frame color, in the filter mode it means the color of the values below volf1.
- VolumeColor – The color of the volumes scale.
- VolumeFilterColor1 – The color for filter volf1.
- VolumeFilterColor2 – The color for filter volf2.
- VolumeFilterColor3 – The color for filter volf3.
- VolumeTextColor – The color of the text on the volume scale.

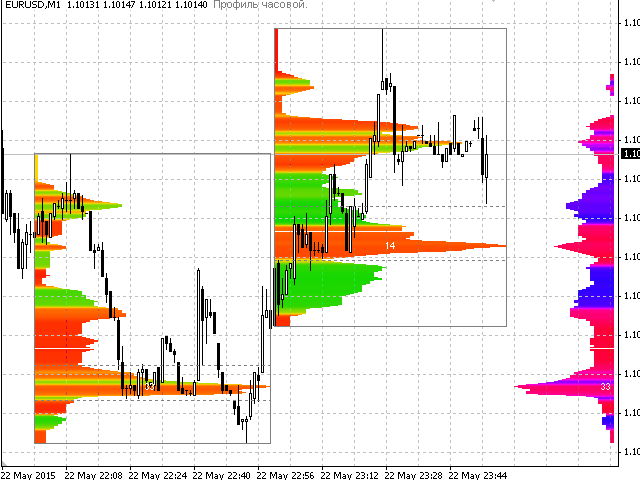
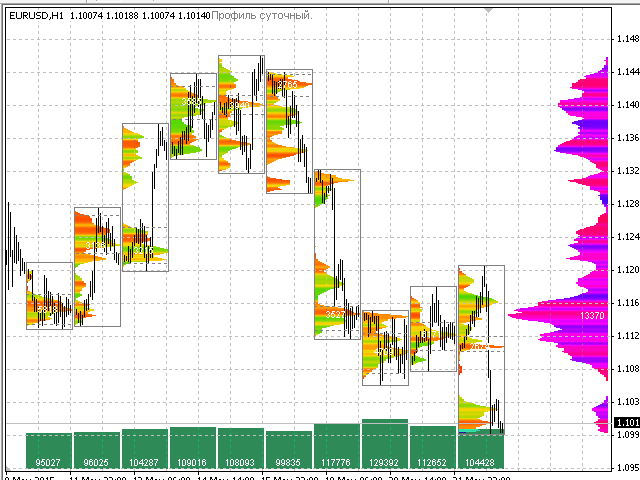

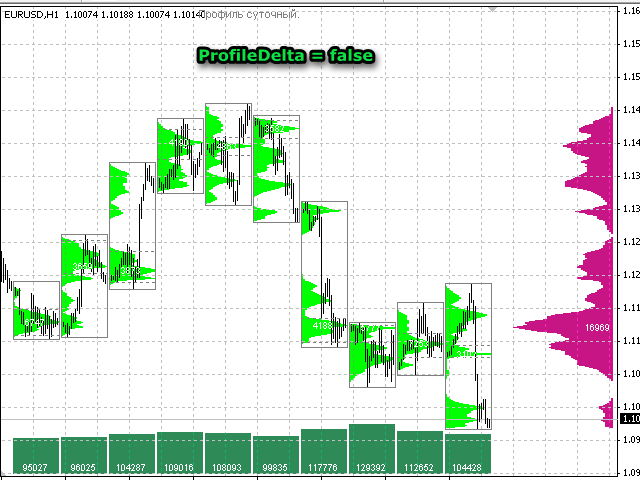

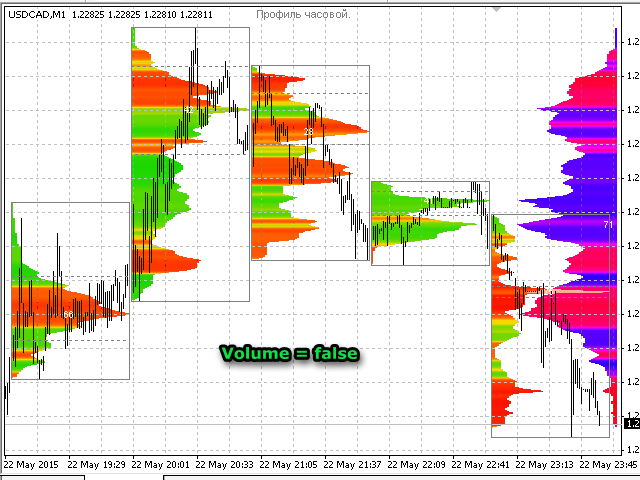






Работает шустро, сам делит график на дневные сессии, показывает сильные уровни сопротивления