Netsrac Supply and Demand Dashboard
- 지표
- Carsten Pflug
- 버전: 1.1
- 업데이트됨: 16 4월 2023
- 활성화: 10
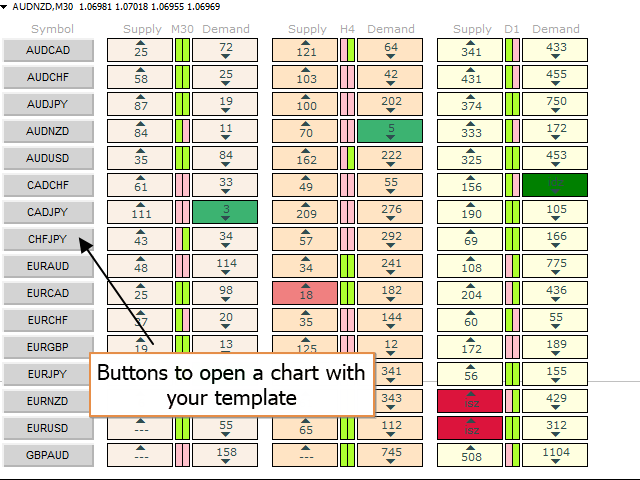
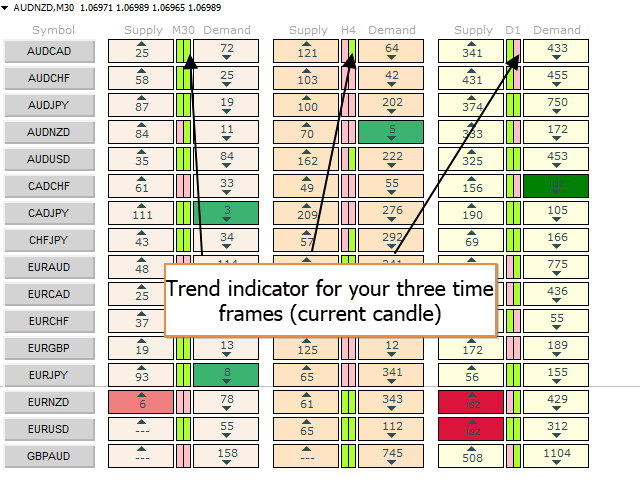
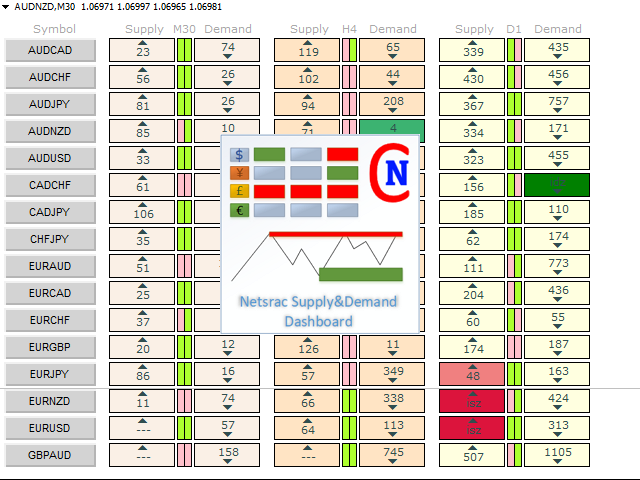
The Netsrac Supply&Demand Dashboard shows you at a glance where relevant zones are located on your favorite assets. Open your chart directly from the dashboard and trade zones that really matter.
Features
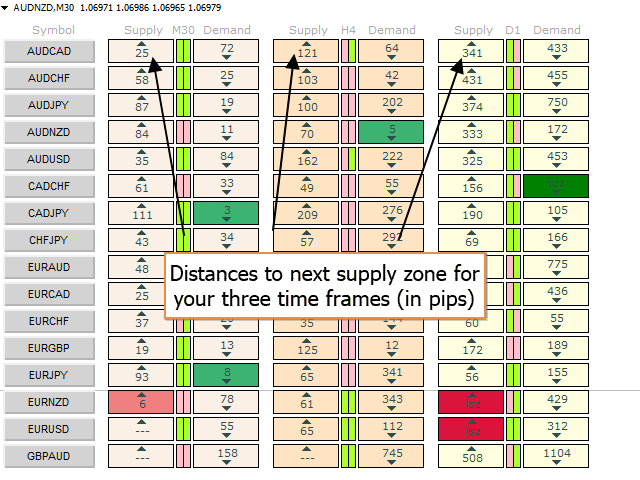
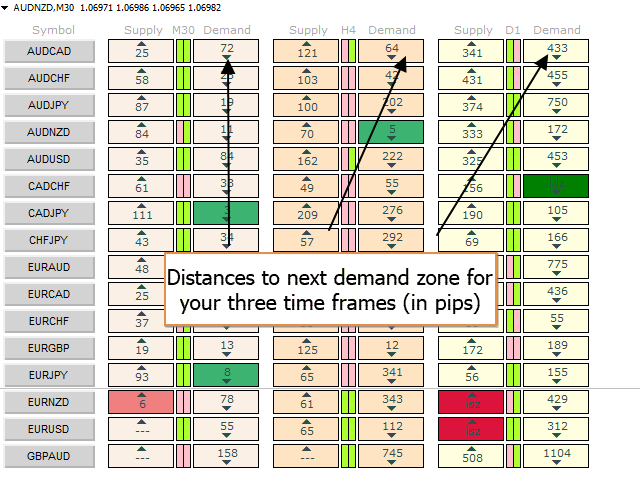
- Finds the next relevant supply and demand zone and displays the distance to this zone (in pips)
- Finds and displays the zones in three different timeframes
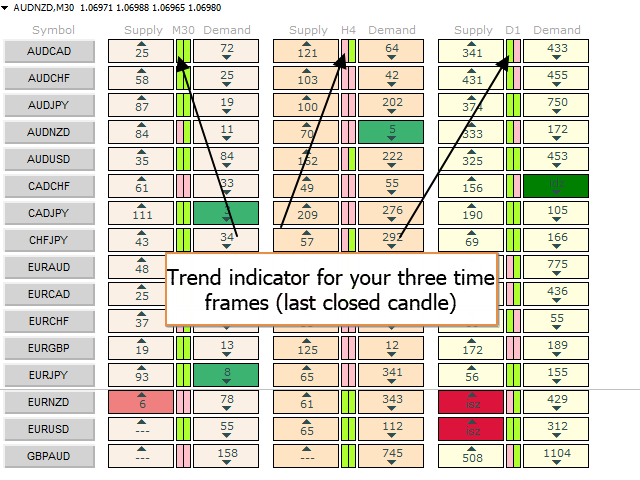
- Calculates a trend indicator for the current and past candle for each configured time frame
- Opens a chart with your chart template directly with a button for each configured asset
- Works perfectly with Netsrac "Supply and Demand Easy" - Indicator (https://www.mql5.com/en/market/product/96509)
Controls
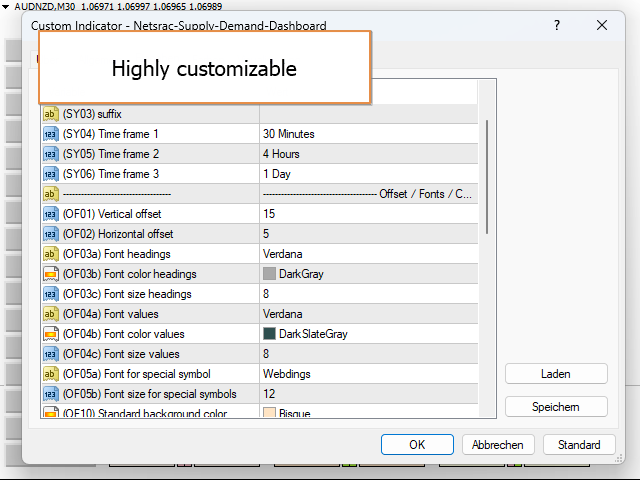
| Variable | Description |
|---|---|
| (SY01) Symbols/Assets | Your list with all symbols you want to watch |
| (SY02) prefix | If your broker needs prefixes before the symbol name |
| (SY03) suffix | If your broker needs suffixes after the symbol name |
| (SY04) Time frame 1 | Your time frame number one |
| (SY05) Time frame 2 | Your time frame number two |
| (SY06) Time frame 3 | Your time frame number three |
| (OF01) Vertical offset | If you want to move the dashboard downwards on the chart |
| (OF02) Horizontal offset | If you want to move the dashboard to the right on the chart |
| (OF03a) - (OF20) ... | Configure the dashboard color and fonts as you want |
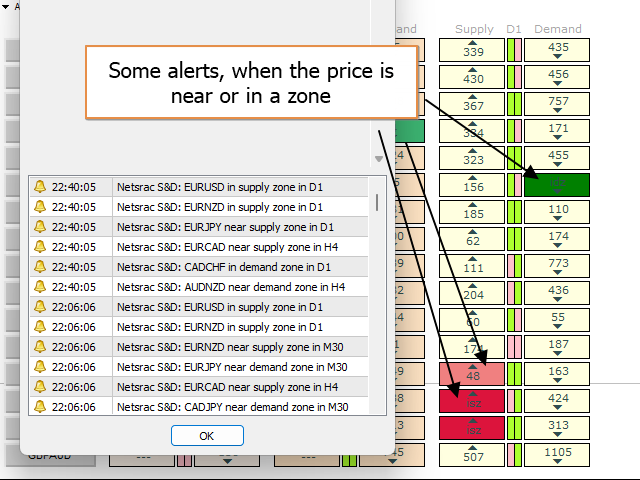
| (AL01) - (AL03) Alerting TF1 - TF3 | Configure for which time frame you want to have alerts |
| (AL04) - (AL06) ... | Configure the type of alerts |
| (CH01) Chart template | Use your favorite chart template, when you open a chart from the dashboard |
| (CH02) Chart time frame | Choose the time frame to use |
| (CH03) Open each chart in new window | True - if you want a new chart with every click; false - if you want to open each chart in the same window (default) |
| (SD06) Depth | Set the depth of the swing calculation algo (lower values produces more swings) |
I wish you much success with this dashboard!
Netsrac

