Navi RSI
- 지표
- Vicente Perez Esteve
- 버전: 1.0
- 활성화: 5
Navi RSI:
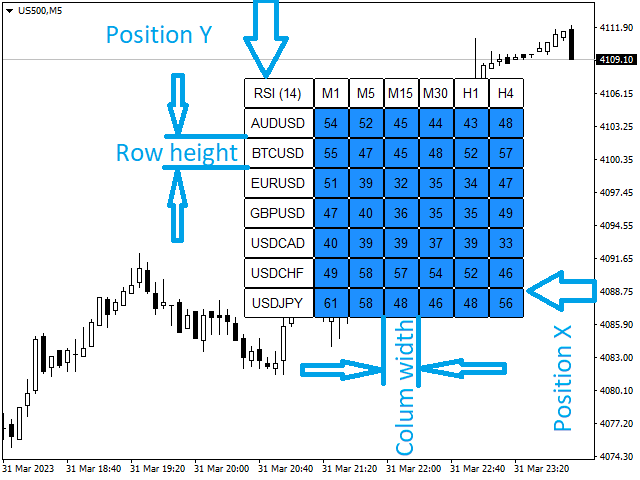
각 기호와 해당 시간 프레임에서 상대 강도 지수의 신호를 과매수 또는 과매도로 검색합니다.
우리는 차트를 매우 편안하게 탐색하며 많은 시간을 절약합니다.
시각적 신호 및 경보는 RSI가 과매수 및 과매도 구역에 있을 때 발생합니다.
시각적 신호 및 경보는 심볼 및 타임프레임 모두에서 독립적이며, 우리가 자리에 있지 않을 때 모바일 경보를 관리하는 데 매우 유용합니다.
입력 매개 변수:
-
스케일 및 위치:
1.1) 코너 선택 - 패널을 위치시킬 화면 모서리 선택.
1.2) 위치 X - 모서리에서의 X 거리.
1.3) 위치 Y - 모서리에서의 Y 거리.
1.4) 열 너비 - 열의 너비.
1.5) 행 높이 - 행의 높이.
1.6) 글꼴 크기 - 텍스트 크기.
-
스캔 시간:
2.1) 모드 (onTick/onTime) - 각 새 틱에서 데이터를 업데이트하거나 초 단위 시간 주기로 데이터를 업데이트합니다.
2.2) Refresh onTime (seconds) - 모드가 onTime인 경우 데이터를 새로 고칠 때마다 주기 시간 초.
-
심볼 및 시간 프레임:
3.1) 사용자 지정 심볼 - 검색하고 탐색하려는 심볼.
3.2) 모드 (Market watch/Simbols list) - 시장 감시 또는 사용자 정의 목록에서 심볼 선택.
3.3) 사용자 지정 시간 프레임 - 검색하고 탐색하려는 시간 프레임.
-
상대 강도 지수:
4.1) Rsi 기간 - RSI 기간
4.2) Rsi 적용 가격
4.3) 매수 신호 색상 - 매수 수준의 색상.
4.4) 매수 과매수 수준 - RSI의 과매수 수준.
4.5) 중립 존 색상 - 과매수나 과매도가 없는 동안의 색상.
4.6) 매도 과매도 수준 - RSI의 과매도 수준.
4.7) 매도 신호 색상 - 매도 수준의 색상.
-
네비게이션:
5.1) 모드 (현재/새 차트) - 동일한 창에서 탐색하거나 새 창에서 열기.
5.2) 새 차트 템플릿 - 새 차트 모드에서 새 창을 열 때 시작되는 템플릿
-
알림:
6.1) 알림 (ON/OFF)
6.2) 과매수/과매도 시간 (분) - 알림 신호를 보내기 위한 과매수/과매도 시간 (분).
6.3) 모드 (과매수/과매도/모두) - 수신하려는 알림 수준.
6.4) 팝업 알림? - 화면에 나타나는 알림.
6.5) 알림 알림? - 모바일 기기로 알림.
6.6) 이메일 알림? - 이메일로 알림.
6.7) 모드 (로컬 시간/서버 시간) - 서버 시간 또는 로컬 시간을 원하는 경우.
6.8) 사용자 정의 알림 기호 - 사용자 지정 알림에 원하는 기호.
6.9) 모드 (시장 관찰 알림/기호 목록 알림) - 사용자 지정 기호 또는 시장 관찰 기호를 사용할지 여부.
6.10) 알림 타임프레임 - 알림에 대한 원하는 시간 프레임.