SimSim Line KijunSen Plus MA MT5
- 지표
- Aleksandr Tyunev
- 버전: 2.0
- 업데이트됨: 3 8월 2024
- 활성화: 7
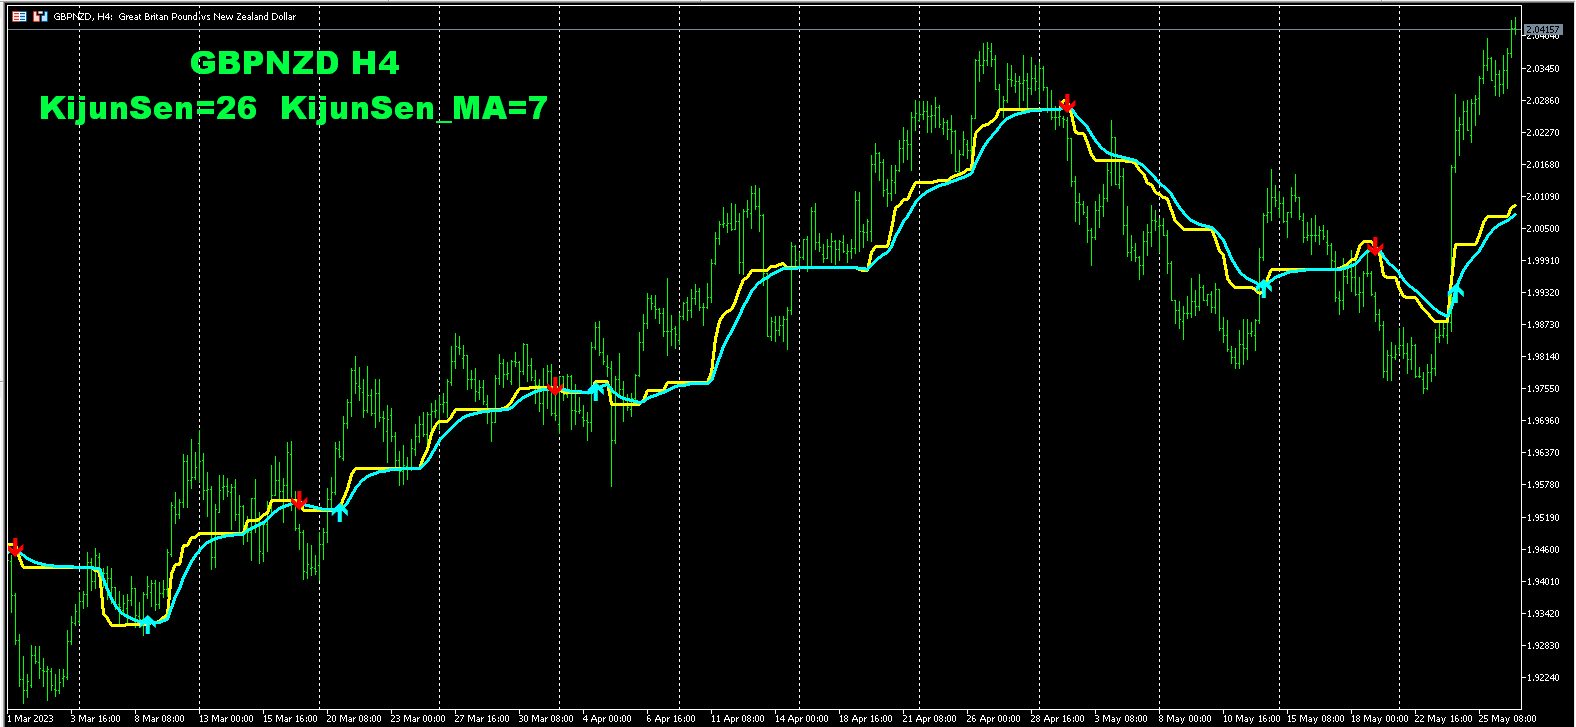
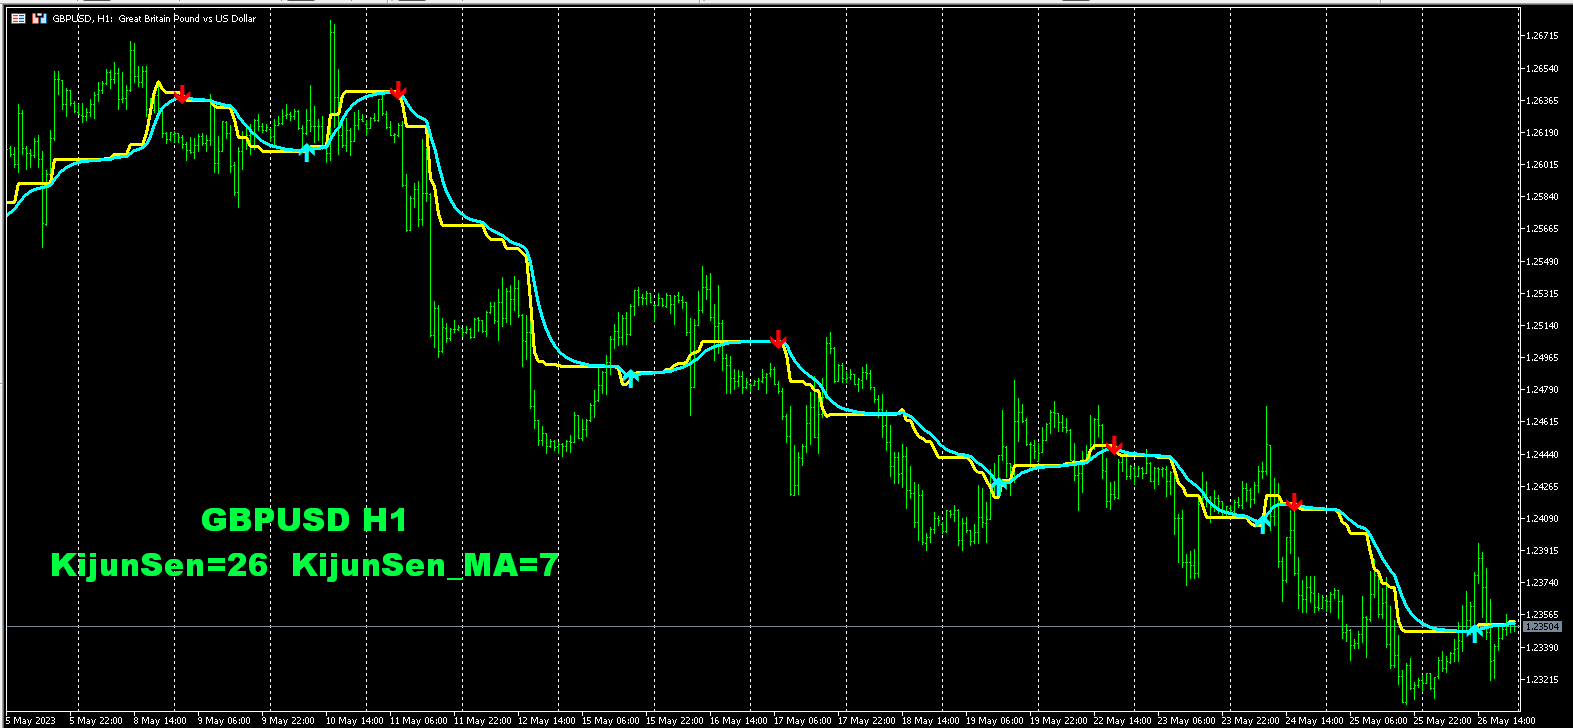
매우 간단하지만 효과적인 지표입니다.
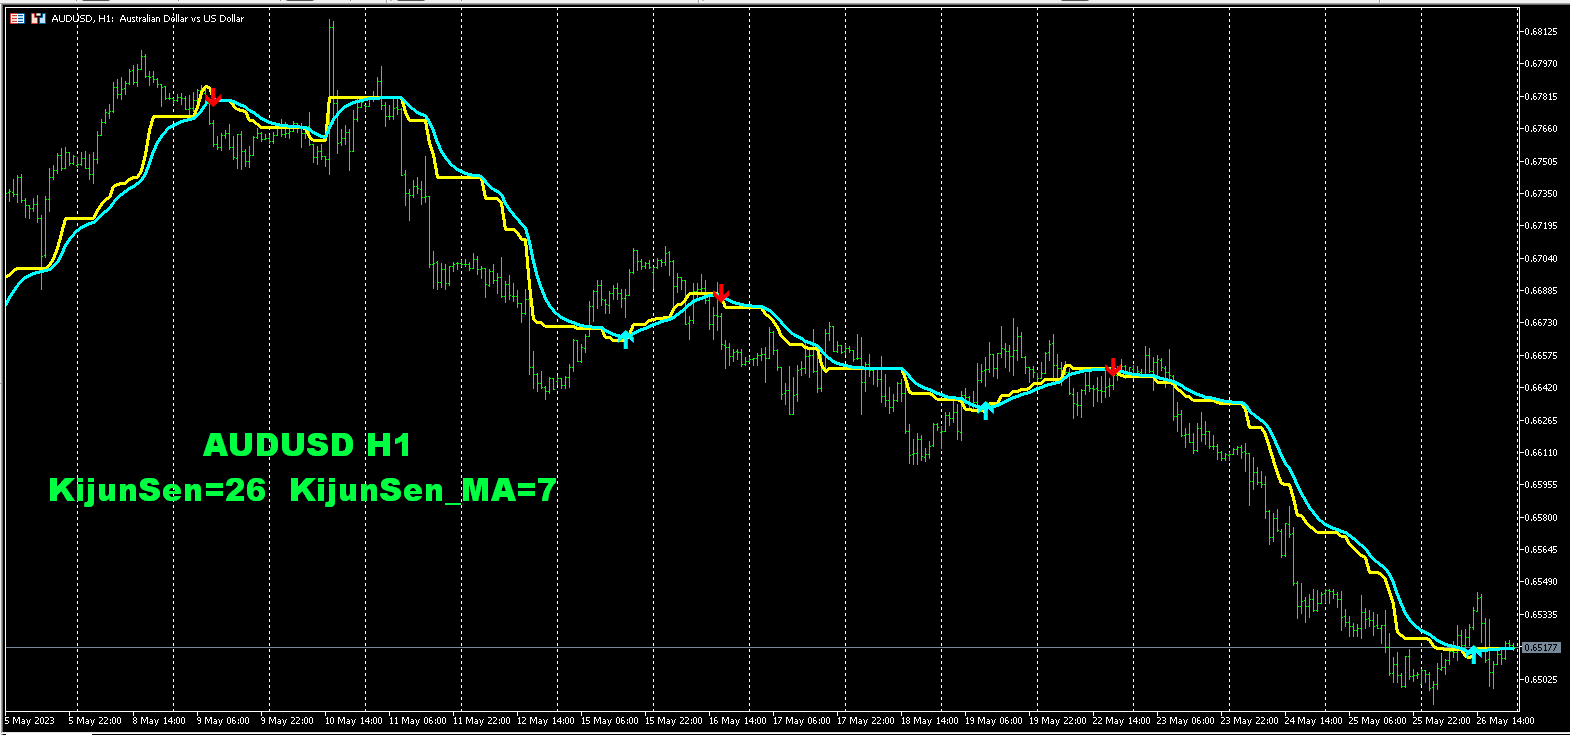
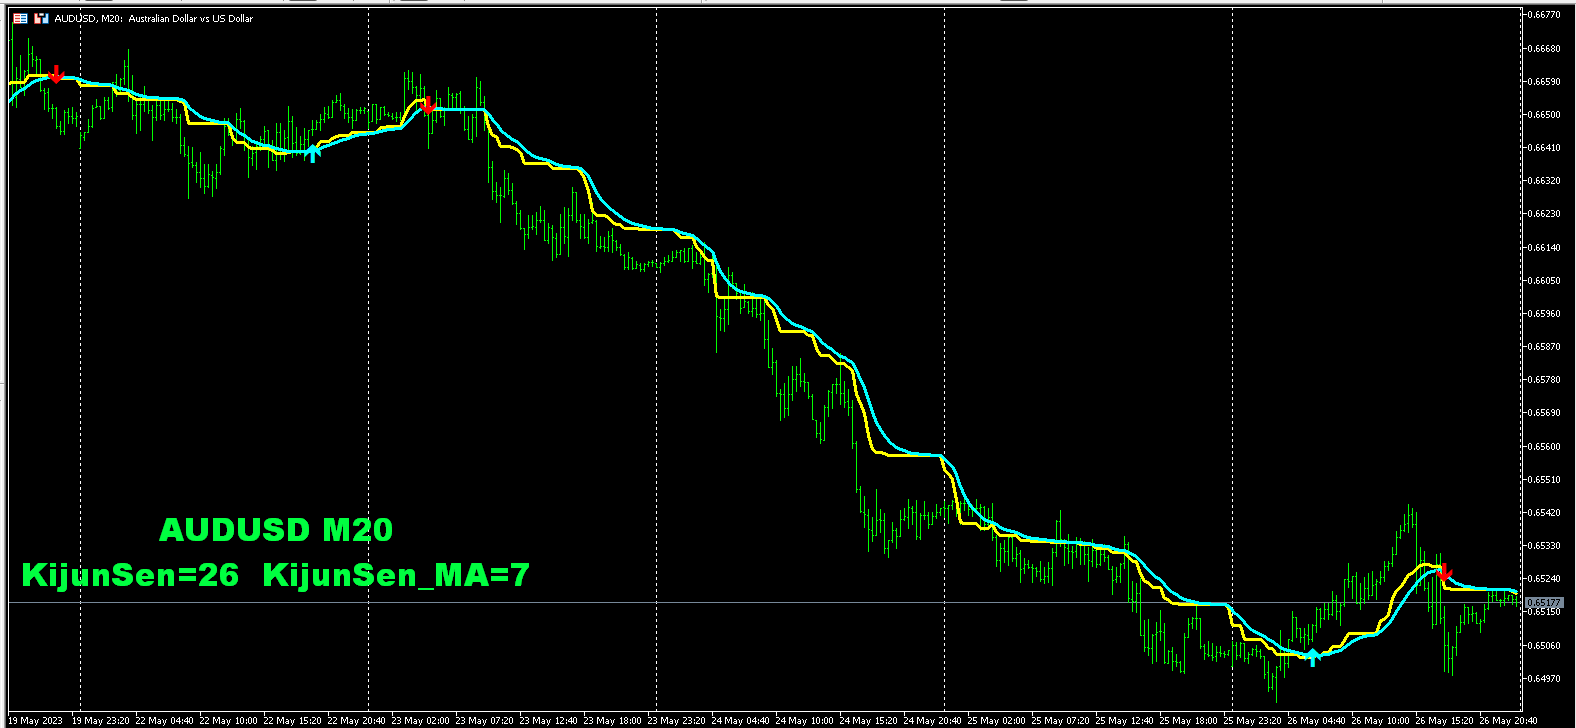
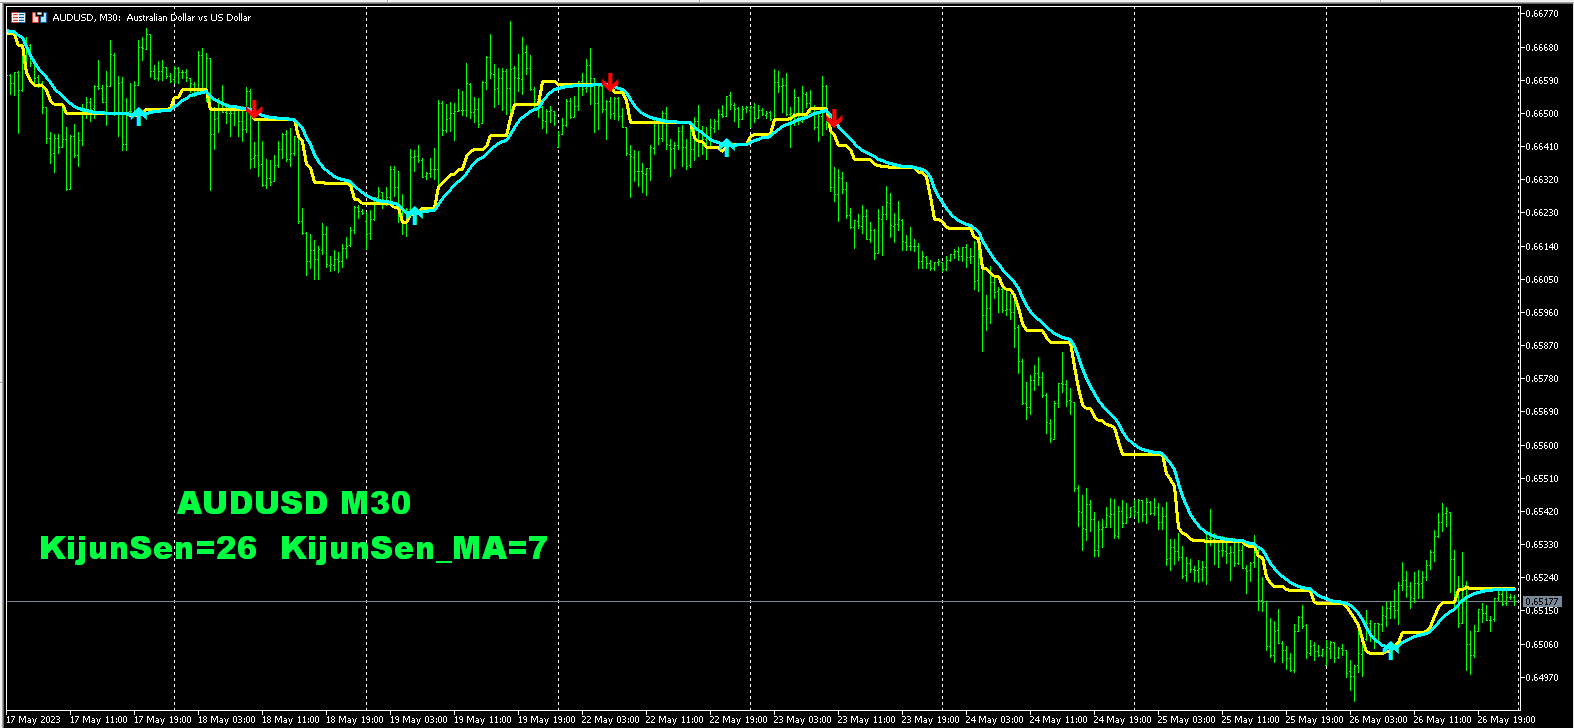
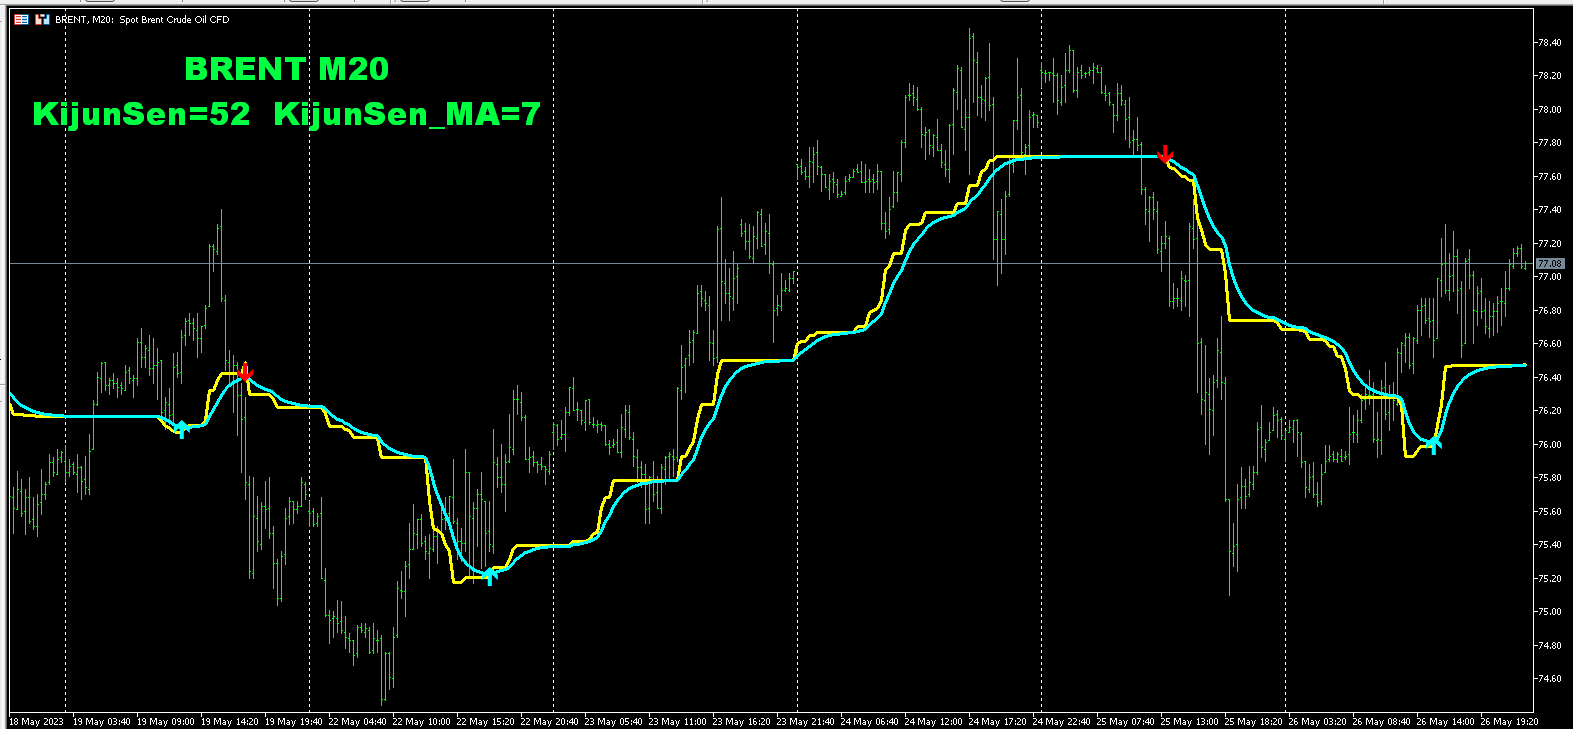
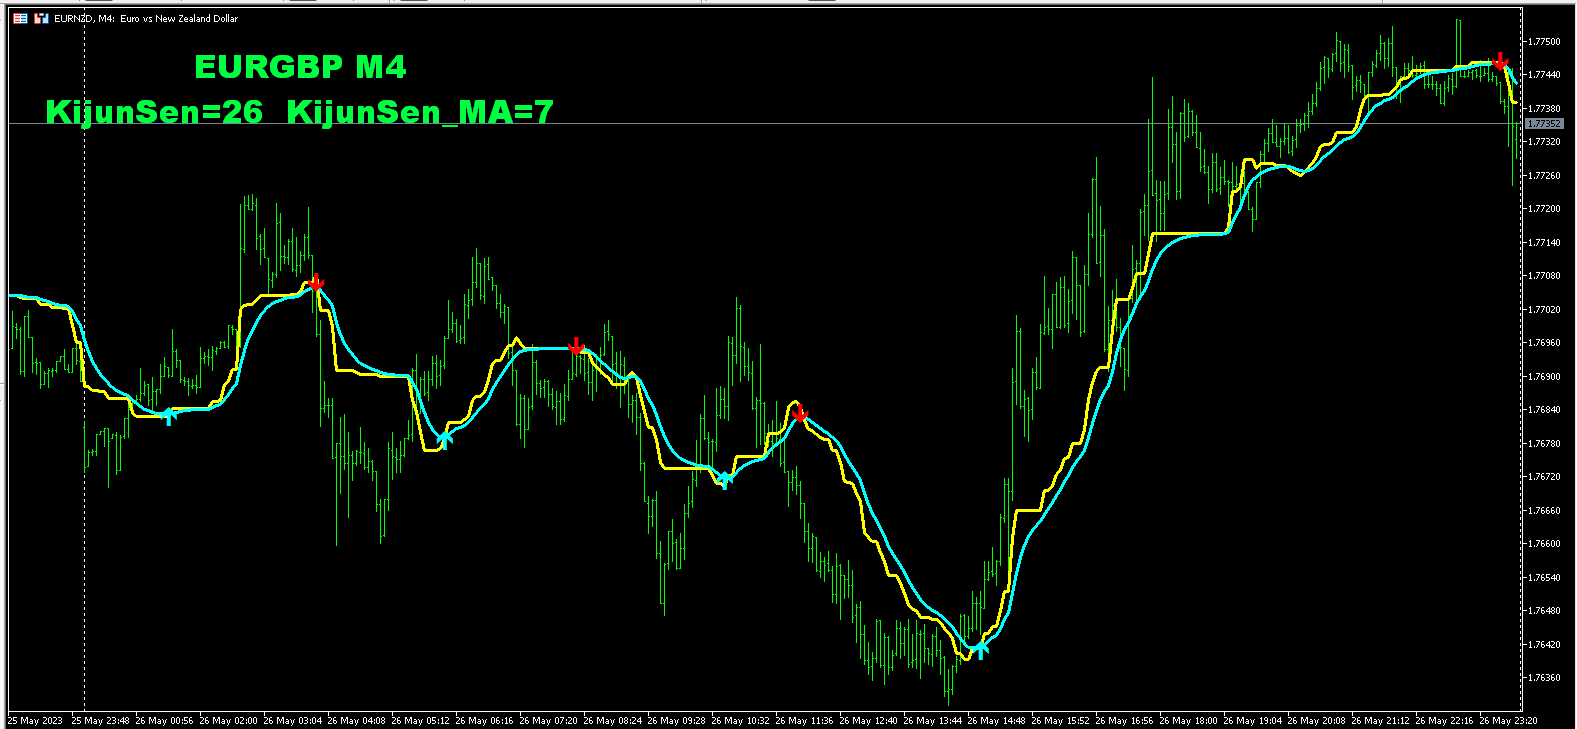
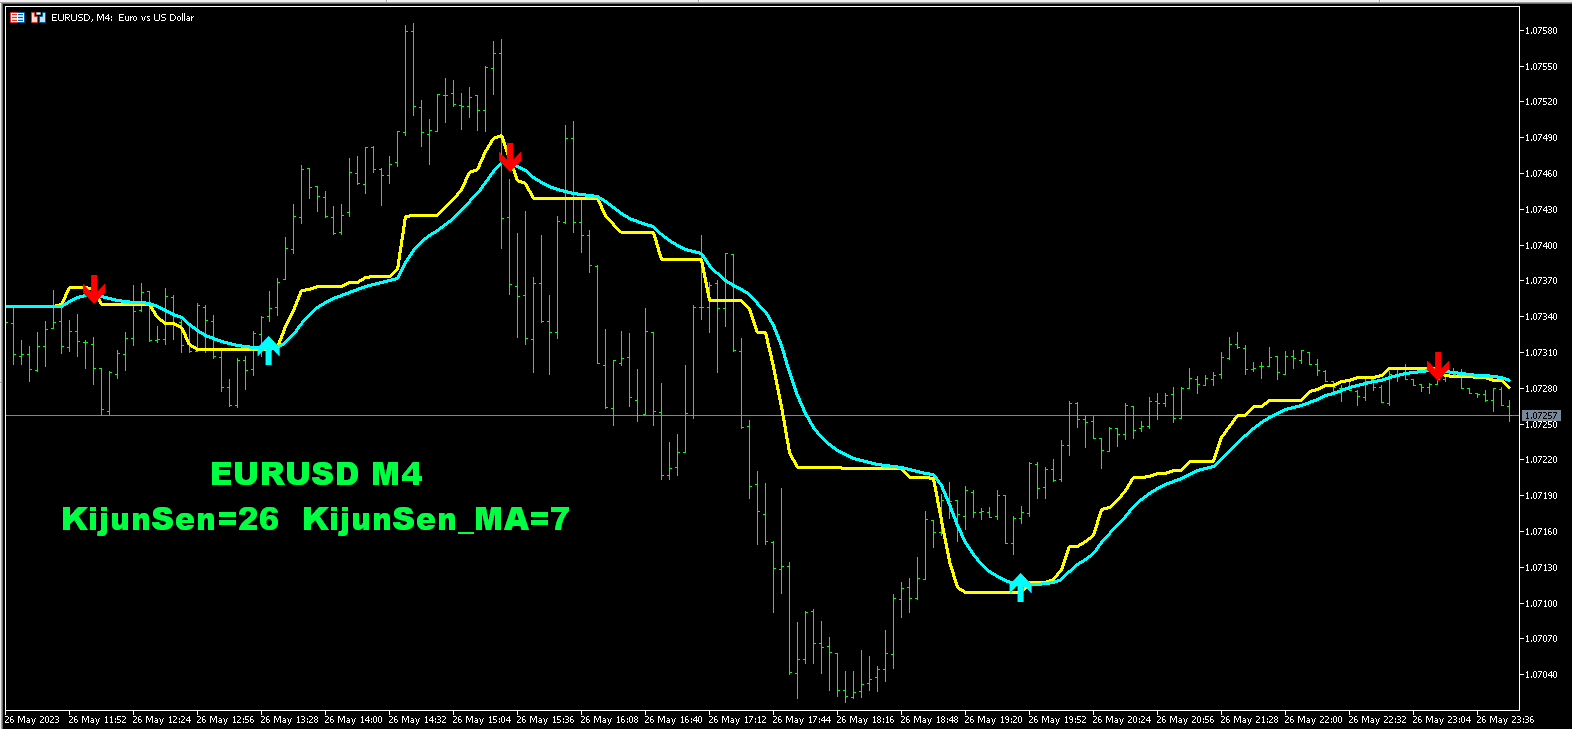
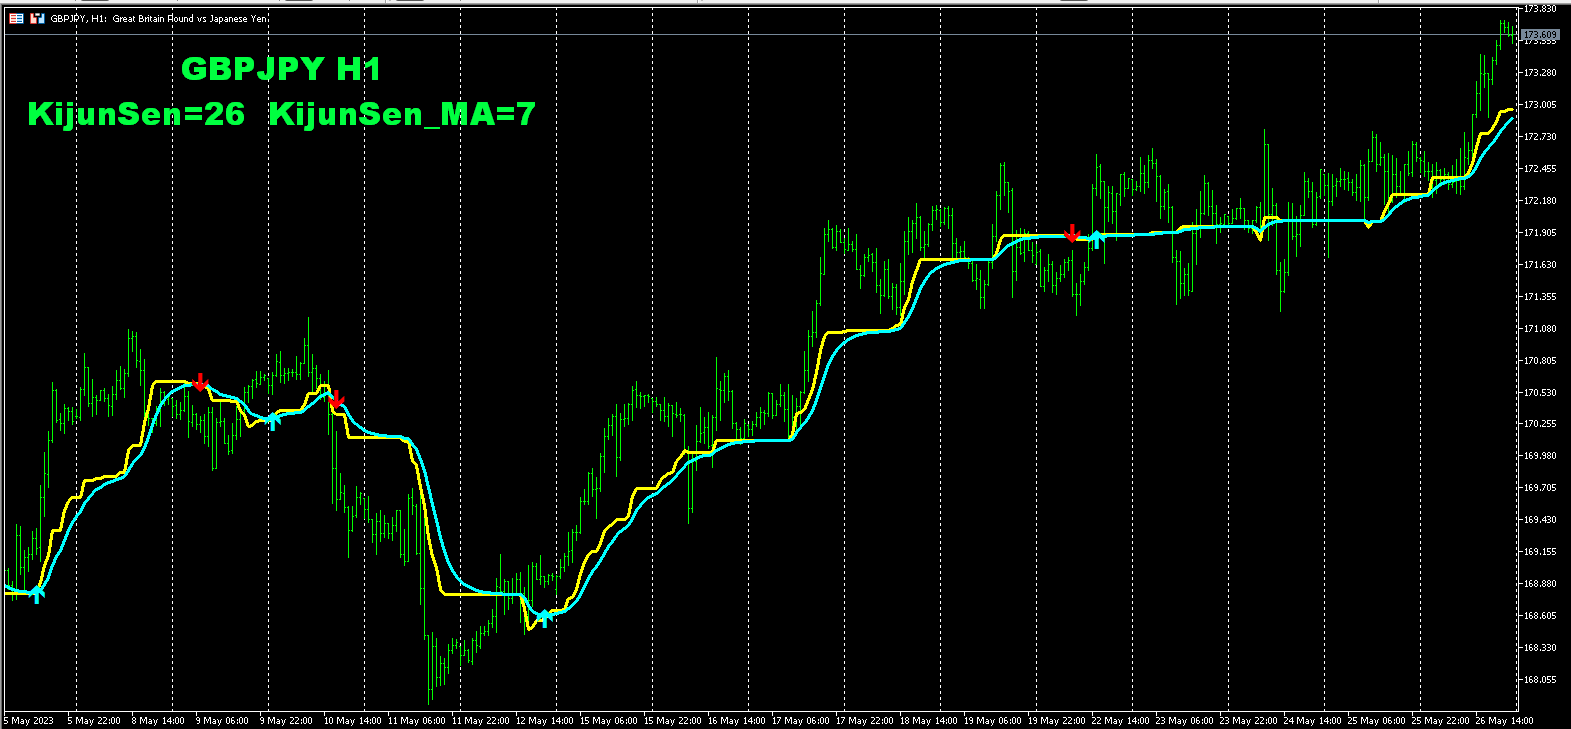
이는 이동 평균 MA가 구성되는 Ichimoku 지표의 KijunSen 라인을 기반으로 합니다. 이 두 선이 교차할 때 매수 또는 매도 신호가 발생합니다. 나는 거래할 때 KijunSen 표시선을 자주 사용합니다. 가격이 이 선보다 높으면 매수에만 집중하고, 이 선보다 낮으면 매도에 집중합니다.
또한, 기준선을 평균화하고 기준선 이동평균을 생성한 후 이러한 선의 주요 교차점이 중요해지면서 더욱 밝고 신뢰할 수 있는 거래 신호를 제공합니다. 이러한 교차점은 기회를 나타낼 뿐만 아니라 시장에서 현명한 결정을 내리는 촉매제 역할을 하여 거래자가 변화를 명확하고 자신감 있게 인식할 수 있도록 해줍니다. 결과적으로 KijunSen은 도구일 뿐만 아니라 금융 변동의 바다에서 길잡이 역할을 하는 별이 됩니다.
MT4 버전 지표 링크:
https://www.mql5.com/ru/market/product/96120
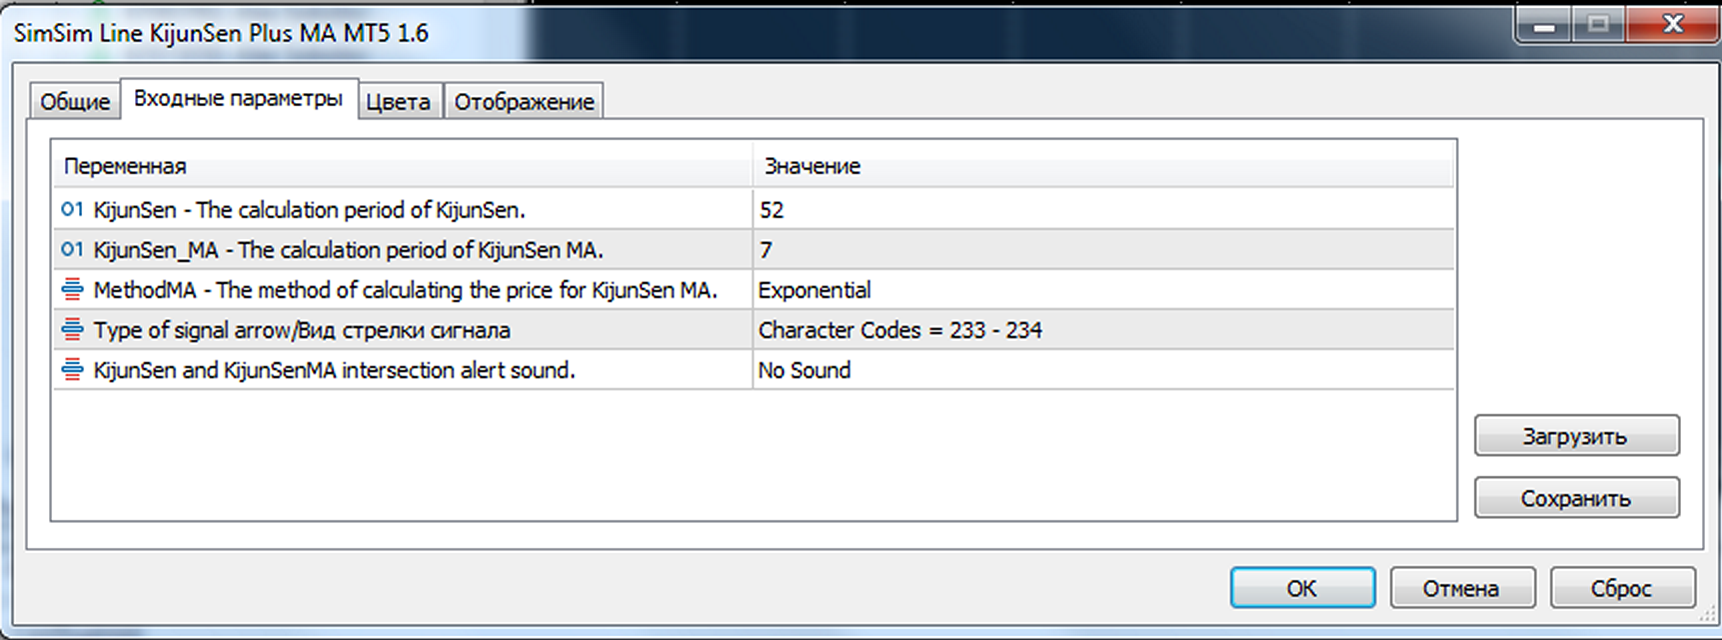
지표 매개변수:
KijunSen - KijunSen의 계산 기간입니다.
KijunSen_MA - KijunSen MA의 계산 기간입니다.
MethodMA - KijunSen MA의 가격을 계산하는 방법입니다.
ArroyBuySell - 신호 화살표 유형
소리 - 소리 알림.
조언자와의 통신을 위한 표시기 버퍼입니다.
버퍼 번호 0 - KijunSen 표시 라인. 버퍼 번호 0은 지표의 Kijun Sen 선입니다.
버퍼 1번 - 지표의 KijunSen MA 라인. 버퍼 번호 1은 지표의 Kijun Sen MA선이다.
버퍼 2번 - 버퍼가 비어 있지 않음 = 구매. 버퍼가 비어 있지 않음 = 구매.
버퍼 번호 3 - 버퍼가 비어 있지 않음 = 판매. 버퍼가 비어 있지 않음 = 판매.
이는 이동 평균 MA가 구성되는 Ichimoku 지표의 KijunSen 라인을 기반으로 합니다. 이 두 선이 교차할 때 매수 또는 매도 신호가 발생합니다. 나는 거래할 때 KijunSen 표시선을 자주 사용합니다. 가격이 이 선보다 높으면 매수에만 집중하고, 이 선보다 낮으면 매도에 집중합니다.
또한, 기준선을 평균화하고 기준선 이동평균을 생성한 후 이러한 선의 주요 교차점이 중요해지면서 더욱 밝고 신뢰할 수 있는 거래 신호를 제공합니다. 이러한 교차점은 기회를 나타낼 뿐만 아니라 시장에서 현명한 결정을 내리는 촉매제 역할을 하여 거래자가 변화를 명확하고 자신감 있게 인식할 수 있도록 해줍니다. 결과적으로 KijunSen은 도구일 뿐만 아니라 금융 변동의 바다에서 길잡이 역할을 하는 별이 됩니다.
MT4 버전 지표 링크:
https://www.mql5.com/ru/market/product/96120
지표 매개변수:
KijunSen - KijunSen의 계산 기간입니다.
KijunSen_MA - KijunSen MA의 계산 기간입니다.
MethodMA - KijunSen MA의 가격을 계산하는 방법입니다.
ArroyBuySell - 신호 화살표 유형
소리 - 소리 알림.
조언자와의 통신을 위한 표시기 버퍼입니다.
버퍼 번호 0 - KijunSen 표시 라인. 버퍼 번호 0은 지표의 Kijun Sen 선입니다.
버퍼 1번 - 지표의 KijunSen MA 라인. 버퍼 번호 1은 지표의 Kijun Sen MA선이다.
버퍼 2번 - 버퍼가 비어 있지 않음 = 구매. 버퍼가 비어 있지 않음 = 구매.
버퍼 번호 3 - 버퍼가 비어 있지 않음 = 판매. 버퍼가 비어 있지 않음 = 판매.

Good indicator and simple idea.