Doteki Heikin Ashi for MT4
- 지표
- Fernando Carreiro
- 버전: 1.1
(Google 번역)
표준 Heikin Ashi 캔들 표현에는 지수 총 가격의 이동 평균(EMA)이며, EMA의 알파 값은 고정되어 있습니다. 0.5에서(EMA 기간 3.0에 해당)
이 동적 버전에서 기간은 사용하려는 값으로 변경할 수 있으며 이를 통해 다음을 수행할 수도 있습니다. 대략적인 다중 시간 프레임 분석 또는 일종의 후행 손절매로 낮은 값 또는 높은 값을 사용합니다. 의 교차점 Heikin Ashi 시가에 대한 실제 종가 가격은 또한 추세 방향.
또한 표준 EMA 외에도 이 버전에는 거의 제로 지연 EMA를 사용할 수 있는 옵션도 있습니다. 대신, 특히 더 긴 기간을 사용할 때 추세 방향의 변화를 더 빠르게 감지할 수 있습니다. 평균.
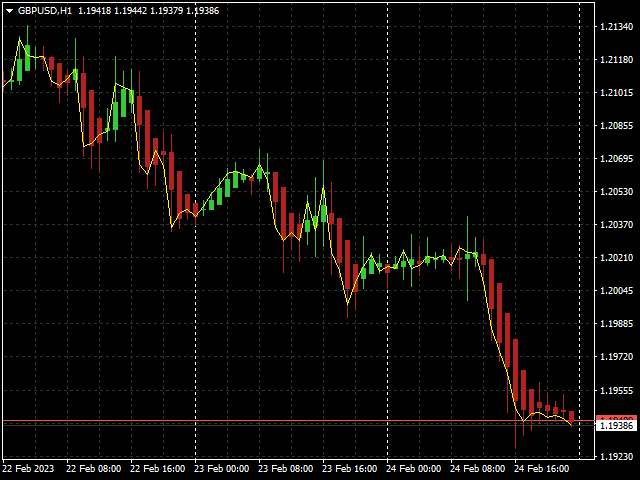
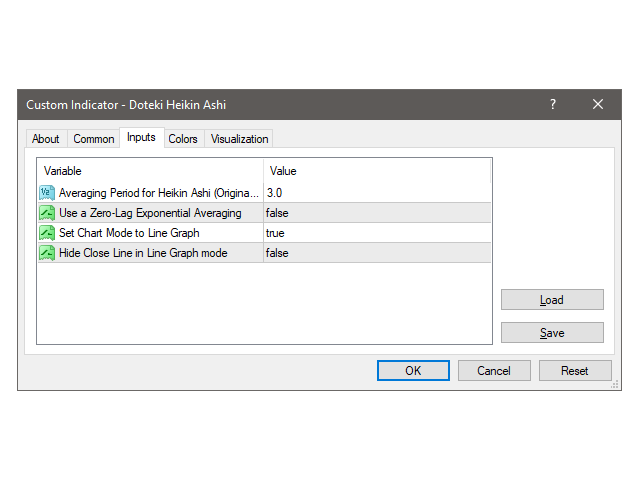
지표를 차트에 첨부할 때 차트를 차트로 자동 전환하는 옵션도 있습니다. 선 그래프 모드와 선택적으로 선 그래프에서 실제 종가를 숨길 수 있습니다. 그렇지 않으면 실제 종가 가격과 Heikin Ashi 열린 가치.
(Original text)
The standard Heikin Ashi candle representation has an open value that is equivalent to an Exponential Moving Average (EMA) of the Total Price, of which the alpha value of the EMA is fixed at 0.5 (equivalent to an EMA period of 3.0).
In this dynamic version, the period can be changed to whatever value one wishes to use, which also allows one to approximate multi-time-frame analysis, or use the low or high value as a sort of trailing stop-loss. The crossing of the real Close price over the Heikin Ashi open value can also be used as a signal for a change in trend direction.
Also, besides the standard EMA, this version also has the option of using an Almost Zero-Lag EMA instead, which can detect changes in trend direction more quickly, especially when using longer periods of averaging.
When attaching the indicator to the chart, you also have the option of automatically switching the Chart into the Line Graph Mode and optionally hiding the real Close prices from the Line Graph, however, without it, you will not be able to see the cross-over signals between the real Close prices and the Heikin Ashi open values.













Very responsive. Helps you get in the trade early.