ZigZag with Extras for MT4
- 지표
- Fernando Carreiro
- 버전: 2.0
- 활성화: 20
(Google 번역)
이 지표는 MetaTrader 설치와 함께 소스 코드 예제로 제공된 원본 지그재그를 기반으로 합니다.
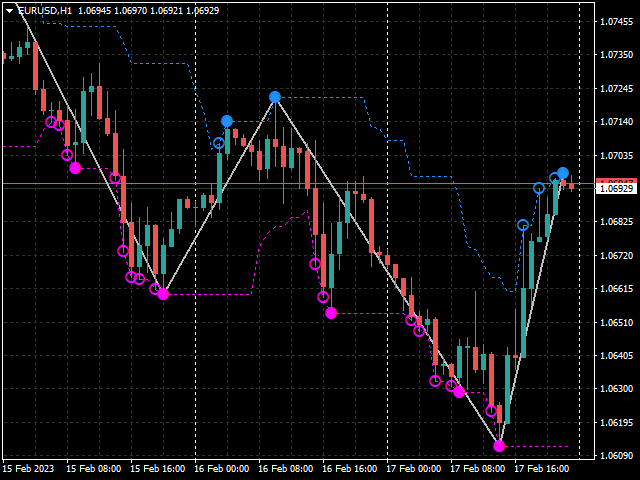
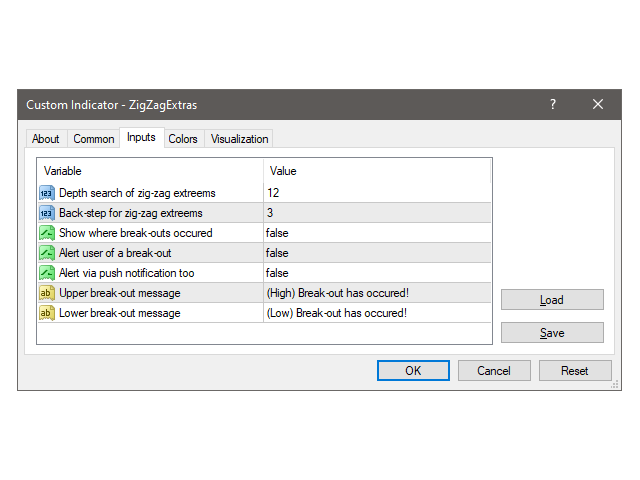
"깊이" 채널과 해당 브레이크 아웃을 표시하기 위한 몇 가지 추가 기능으로 다시 작성했습니다. 또한 이전 지그재그 지점을 관찰할 수 있습니다.
선택적으로 탈주 발생 시 사용자에게 경고할 수 있습니다. 알림은 단순히 단말기에 있을 수도 있고 모바일 기기의 푸시 알림을 통해 나만의 맞춤 텍스트로 보낼 수도 있습니다.
(Original text)
This indicator is based on the original ZigZag provided as a source code example with MetaTrader installations.
I rewrote it with some extra features for displaying the “depth” channel and the respective break-outs. It also allows one to observe prior zig-zag points.
Optionally, it can alert the user when break-outs occur. The alerts can be simply on the terminal or also via push notifications on a mobile device, with your own custom text.