• 미리보기
  • 리뷰
  • 코멘트

Exponential Range Average Deviation Offset MT5

(Google 번역)

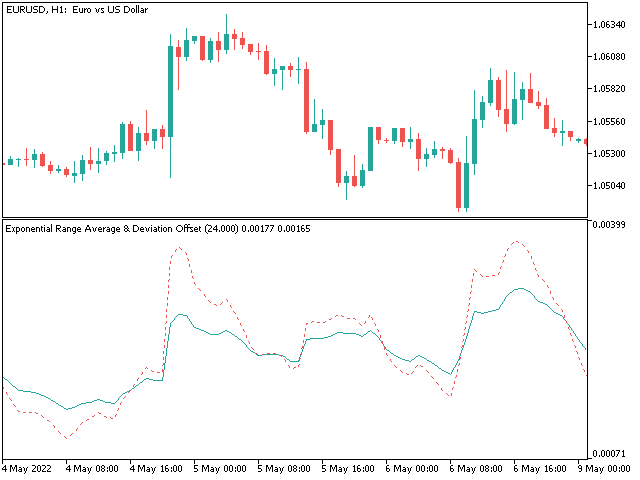
이 지표는 John Welles Wilder의 ATR(Average True Range)에서 영감을 받았지만 몇 가지 추가 정보가 있습니다. 마찬가지로 실제 범위의 지수 이동 평균을 계산하지만 와일더 대신 표준 알파 가중치를 사용합니다. 또한 범위 평균의 평균 편차를 계산하여 오프셋으로 표시합니다. 이렇게 하면 변경 사항을 더 빠르게 식별할 수 있을 뿐만 아니라 그 영향도 파악할 수 있습니다.

(Original text)

This indicator was inspired by John Welles Wilder's average true range (ATR), but with some extra information. Similarly, it calculates the exponential moving average of the true range, but using the standard alpha weight instead of Wilder's. It also calculates the average deviation of the range average, and displays it as an offset. This helps not only identify a change more quickly, but also its impact.

추천 제품
Doteki Heikin Ashi for MT5
Fernando Carreiro
4 (6)
(Google 번역) 표준 Heikin Ashi 캔들 표현에는 지수 총 가격 의 이동 평균(EMA) 이며, EMA 의 알파 값은 고정되어 있습니다. 0.5에서( EMA 기간 3.0에 해당) 이 동적 버전에서 기간은 사용하려는 값으로 변경할 수 있으며 이를 통해 다음을 수행할 수도 있습니다. 대략적인 다중 시간 프레임 분석 또는 일종의 후행 손절매로 낮은 값 또는 높은 값을 사용합니다. 의 교차점 Heikin Ashi 시가에 대한 실제 종가 가격은 또한 추세 방향. 또한 표준 EMA 외에도 이 버전에는 거의 제로 지연 EMA 를 사용할 수 있는 옵션도 있습니다. 대신, 특히 더 긴 기간을 사용할 때 추세 방향의 변화를 더 빠르게 감지할 수 있습니다. 평균. 지표를 차트에 첨부할 때 차트를 차트로 자동 전환하는 옵션도 있습니다. 선 그래프 모드 와 선택적으로 선 그래프 에서 실제 종가 를 숨길 수 있습니다. 그렇지 않으면 실제 종가 가격과 Heikin Ashi 열린 가치. (Ori
FREE
Leave a comment if you would like me to write an EA to trade these trendlines... if enough interest, will write an EA. Automatic Trendlines, updated automatically. To Set up 3 different (or mroe) Trendlines on chart, simply load the indicator as many times and name it differntly.. the example in the picture below is indicator 1 (loaded 1st time): Name: Long, StartBar: 50, BarCount: 500, Color: Pink indicator 2 (loaded 2nd time): Name: Short, StartBar: 20, BarCount: 200, Color: Green indicator 3
FREE
Reversal Composite Candles
MetaQuotes Ltd.
3.5 (24)
The idea of the system is to indentify the reversal patterns using the calculation of the composite candle. The reversal patterns is similar to the "Hammer" and "Hanging Man" patterns in Japanese candlestick analysis. But it uses the composite candle instead the single candle and doesn't need the small body of the composite candle to confirm the reversal. Input parameters: Range - maximal number of bars, used in the calculation of the composite candle. Minimum - minimal size of the composite can
FREE
ATR Moving Average
David Gitau Gakunga
5 (3)
ATR Moving Average draws a moving average of the standard Average True Range( ATR ) in the same window. Settings Name Description ATR period Set Price per iod for ATR calculation ATR level Set ATR value for thresholding( only whole number, ignore leading zeros e.g. 0.00089 = 89 ) MA Period Set moving Average Period MA Method Set moving average method( Simple, Exponential, Smoothed and Linear Weighted ) MA Shift Set moving average shift Enable Alerts ? Generate Alert when ATR crosses
FREE
Donchian Pro
Paulo Henrique Faquineli Garcia
5 (2)
The Donchian Channel Channels are among the most popular tools of technical analysis, as they visually convey to the analyst the limits within which most price movement tends to occur. Channel users know that valuable information can be obtained at any time, whether prices are in the central region of a band or close to one of the border lines. One of the best known techniques to explore these concepts is Bollinger Bands. However, John Bollinger was not the only one to research the applicatio
FREE
Value Chart Candlesticks
Flavio Javier Jarabeck
4.7 (10)
The idea of a Value Chart indicator was presented in the very good book I read back in 2020 , " Dynamic Trading Indicators: Winning with Value Charts and Price Action Profile ", from the authors Mark Helweg and David Stendahl. The idea is simple and the result is pure genius: Present candlestick Price analysis in a detrended way! HOW TO READ THIS INDICATOR Look for Overbought and Oversold levels. Of course, you will need to test the settings a lot to find the "correct" one for your approach.
FREE
Follow The Line MT5
Oliver Gideon Amofa Appiah
4.42 (31)
This indicator obeys the popular maxim that: "THE TREND IS YOUR FRIEND" It paints a GREEN line for BUY and also paints a RED line for SELL. (you can change the colors). It gives alarms and alerts of all kinds. IT DOES NOT REPAINT and can be used for all currency pairs and timeframes. Yes, as easy and simple as that. Even a newbie can use it to make great and reliable trades. NB: For best results, get my other premium indicators for more powerful and reliable signals. Get them here: https://www.m
FREE
VolumeSpreadtompson
Vasilii Luchnikov
5 (1)
hello. The indicator shows the levels of change in the spread per unit of time when its values are higher. Practice shows that the change in volumes is associated with the warning and advance of speculative activity, especially at key moments: Fed news, oil news, speeches by leaders of the IDR countries.   We are very happy to present new developments. Thanks. 
FREE
Market Profile 3 ForexArby com
Hussien Abdeltwab Hussien Ryad
4.17 (12)
Market Profile 3 MetaTrader 5 indicator  version 4.70— is a classic Market Profile implementation that can show the price density over time, outlining the most important price levels, value area, and control value of a given trading session. This indicator can be attached to timeframes between M1 and D1 and will show the Market Profile for daily, weekly, monthly, or even intraday sessions. Lower timeframes offer higher precision. Higher timeframes are recommended for better visibility. It is als
FREE
PZ The Zone MT5
PZ TRADING SLU
5 (1)
This indicator displays buy or sell signals according to Bill Williams' definition of the Trading Zone. [ Installation Guide | Update Guide | Troubleshooting | FAQ | All Products ] Easy to use and understand Avoid trading flat markets Deterministic indicator with clear rules The indicator is non-repainting It implements alerts of all kinds It has straightforward trading implications. A blue arrow is a buy signal A red arrow is a sell signal According to Bill Williams trading in the zone helps t
FREE
Bar Color Trend
Germano Chagas
4.5 (10)
Combining the best of Price Action , Directional Movement , and Divergence/Convergence analysis, Candle Color Trend is a easy and reliable way to identify trend direction. The indicator automatically paints the candles according to the assumption that an uptrend is defined by prices that form a series of higher highs and higher lows. In contrast, a downtrend is defined by prices that form a series of lower highs and lower lows. Additionally, ADX Wilder indicator is used to measure trend weakness
FREE
Free automatic Fibonacci is an indicator that automatically plots a Fibonacci retracement based on the number of bars you select on the BarsToScan setting in the indicator. The Fibonacci is automatically updated in real time as new highest and lowest values appears amongst the selected bars. You can select which level values to be displayed in the indicator settings. You can also select the color of the levels thus enabling the trader to be able to attach the indicator several times with differe
FREE
무한대에서 통화의 강도를 측정하는이 혁신적인 지표는 오랫동안 거래하는 암표 및 거래자에게 없어서는 안될 조수입니다. 통화의 강도/약점을 분석하는 시스템은 오랫동안 알려져 있으며 세계 최고의 거래자들에 의해 시장에서 사용되었습니다. 이 분석 없이는 차익 거래가 완료되지 않습니다. 우리의 지표는 서로 관련하여 기본 통화의 강도를 쉽게 결정합니다. 표시 라인에 차트에 대한 모든 또는 현재 통화 쌍의 수 있도록 즉각적인 분석 및 검색에 대한 강한 진입 점. 표시등,직관적 인 사용하면 신속하게 찾아와 스위치는 모든 쌍,모바일 패널 배치할 수 있는 모두에서 지하실에는 기본 차트. 통화의 강도의 변화의 통지의 타이머 모드는 상인에게 전화로 알림을받을 수있는 기회를 제공합니다.  통화 전력계 무한대 표시기를 사용하기위한 몇 가지 전략: 1. 신흥 추세에 대한 신호로 교차점을 검색 할 통화의 강도의 선형 표시의 차트를 사용하여 2. 추세 반전 신호가 나타난 후 강한 통화 방향으로 두피
FREE
Trend Catcher with Alert MT5
Issam Kassas
4.62 (76)
트렌드 캐쳐: 알림 인디케이터와 함께 하는 트렌드 캐쳐 전략은 시장 트렌드와 잠재적인 진입 및 체크 포인트를 식별하는 데 도움이 되는 다목적 기술 분석 도구입니다. 이는 시장 상황에 적응하여 트렌드 방향을 명확하게 시각적으로 표현하는 동적 트렌드 캐쳐 전략을 제공합니다. 트레이더는 선호도와 위험 허용도에 맞게 매개변수를 사용자 정의할 수 있습니다. 이 인디케이터는 트렌드 식별을 지원하고 잠재적인 반전을 신호로 제공하며 트레일링 스탑 메커니즘으로 작동하며 실시간 경고를 제공하여 신속한 시장 대응을 돕습니다. 특징: - 트렌드 식별: 상승 트렌드와 하락 트렌드를 신호합니다. - 트렌드 반전: 양봉 색상이 상승에서 하락으로 변경되거나 그 반대의 경우 잠재적인 반전을 경고합니다. - 실시간 경고: 새로운 트렌드 식별을 위한 경고를 생성합니다. 추천사항: - 통화 및 페어: EURUSD, AUDUSD, XAUUSD 등... - 시간 프레임: H1. - 계정 유형: 모든 E
FREE
Important Lines
Terence Gronowski
4.88 (26)
This indicator displays Pivot-Lines, preday high and low, preday close and the minimum and maximum of the previous hour. You just have to put this single indicator to the chart to have all these important lines, no need to setup many single indicators. Why certain lines are important Preday high and low : These are watched by traders who trade in a daily chart. Very often, if price climbs over or falls under a preday low/high there is an acceleration in buying/selling. It is a breakout out of
FREE
MACD Crossover Lines
Alexis Brian Luna
What is MACD? MACD is an acronym for Moving Average Convergence Divergence . This technical indicator is a tool that’s used to identify moving averages that are indicating a new trend, whether it’s bullish or bearish. There is a common misconception when it comes to the lines of the MACD. There are two lines: The " MACD Line " The " Signal Line " The two lines that are drawn are NOT moving averages of the price. The MACD Line is the difference (or distance) between two moving
FREE
Spike Catch Pro
Amani Fungo
4 (6)
Spike Catch Pro 22:03 release updates Advanced engine for searching trade entries in all Boom and Crash pairs (300,500 and 1000) Programmed strategies improvements Mx_Spikes (to combine Mxd,Mxc and Mxe), Tx_Spikes,   RegularSpikes,   Litho_System,   Dx_System,   Md_System,   MaCross,   Omx_Entry(OP),  Atx1_Spikes(OP),   Oxc_Retracement (AT),M_PullBack(AT) we have added an arrow on strategy identification, this will help also in the visual manual backtesting of the included strategies and see h
FREE
Weis Waves
Flavio Javier Jarabeck
3.15 (26)
The original author is David Weis, an expert in the Wyckoff Method. The Weis Wave is a modern adaptation of the 1930's Wyckoff Method, another expert in Tape Reading techniques and Chart Analysis. Weis Waves takes market volume and stacks it into waves according to price conditions giving the trader valuable insights about the market conditions. If you want to learn more about this subject you can find tons of videos in YouTube. Just look for "The Wickoff Method", "Weis Wave" and "Volume Spread
FREE
Trendline mt5 indicator
David Muriithi
3 (1)
Are you tired of drawing trendlines every time you're analyzing charts? Or perhaps you would like more consistency in your technical analysis. Then this is for you. This indicator will draw trend lines automatically when dropped on a chart. How it works Works similar to standard deviation channel found on mt4 and mt5. It has 2 parameters: 1. Starting Bar 2. Number of bars for calculation The   starting bar   is the bar which drawing of the trend lines will begin, while the   number of bars for c
FREE
FRB Support and Resistance
Fernando Baratieri
5 (2)
FRB Trader - Our mission is to provide the best support to customers through conted and tools so that they can achieve the expected results FRB Support and Resistance - Indicator places lines on the chart to show Support and Resistance regions. - You can choose the timeframe you want to calculate, as well as the colors of the lines. - Algorithm calculates the points where the strengths of the asset are considered and are extremely important for decision making.
FREE
LT Donchian Channel
Thiago Duarte
4.75 (4)
Donchian Channel is an indicator created by Richard Donchian. It is formed by taking the highest high and the lowest low of the last specified period in candles. The area between high and low is the channel for the chosen period. Its configuration is simple. It is possible to have the average between the upper and lower lines, plus you have alerts when price hits one side. If you have any questions or find any bugs, please contact me. Enjoy!
FREE
This EA is named Dinosaur Hunter(DH) because it can capture very large trend, such as 5000-10000 pips. DH trades infrequently as it patiently waits for the right market conditions. DH can load multiple currency pairs on a single chart to increase the number of trades. Live Signal This is a demo version that only for fixed lot size of 0.01. To obtain the full version, please purchase Dinosaur Hunter Pro . This EA has been tested from 2015 to the present. The test used data from Dukascopy. If
FREE
Free version. Only works on EURUSD Do you want to always know in a quick glance where price is going? Are you tired of looking back and forth between different timeframes to understand that? This indicator might just be what you were looking for. Trend Signal Multitimeframe shows you if the current price is higher or lower than N. candles ago, on the various timeframes. It also displays how many pips higher or lower current price is compared to N. candles ago. Number N. is customizable The data
FREE
PZ Penta O MT5
PZ TRADING SLU
4 (6)
The Penta-O is a 6-point retracement harmonacci pattern which usually precedes big market movements. Penta-O patterns can expand and repaint quite a bit. To make things easier this indicator implements a twist: it waits for a donchian breakout in the right direction before signaling the trade. The end result is an otherwise repainting indicator with a very reliable trading signal. The donchian breakout period is entered as an input. [ Installation Guide | Update Guide | Troubleshooting | FAQ | A
FREE
CAP Channel Trading MT5
MEETALGO LLC
4.09 (58)
The   CAP Channel Trading   is a volatility-based indicator that makes use of the “advanced envelope theory”. These envelopes consist of two outer lines. Envelope theory states that the market price will generally fall between the boundaries of the envelope (or channel). If prices move outside the envelope, it is a trading signal or trading opportunity. Benefits of the Channel Trading Indicator CAP Channel Trading works with any asset It can be applied to any financial assets: forex, cryptoc
FREE
Automatic Trendlines
Pasi Hakamaki
4.65 (51)
The indicator draws trendlines on chart. This indicator has six inputs. User can specify alternative labels for both lines. If multiple instances of the indicator are used, the labels must differ. User can set width and color of the lines and depth which specifies what significant peaks should be used. For example, Depth=10 sets trendlines using the current peaks and valleys that have at least 10 bars to the right and to the left and that have highs/lows less/greater than the peak's high/low. In
FREE
GT Indicator
Alexander Martin Koenig
This indicator helps to trade price action and momentum strategies like Guerrilla Trading or similar strategies. The indicator displays: most recent highs and lows number of consecutive breaks past breaks of most recent highs and lows retest lines flag formations Please watch out for my Expert Advisors that will allow trade/pending order placement automated trade management alarm setting for flag formations dashboards for market conditions excessive backtesting features
FREE
WH Price Wave Pattern MT5
Wissam Hussein
3.82 (11)
FREE
This indicator is a zero-lag indicator and displays  strength of trend change . True Trend  Oscillator Pro works best in combination with True Trend Moving Average Pro that displays exact trend as is. Oscillator value is exact price change in given direction of the trend. True Trend Moving Average Pro: https://www.mql5.com/en/market/product/103586 If you set PERIOD input parameter to 1 this indicator becomes a sharpshooter for binary options. Developers can use True Trend Oscillator in E
FREE
RSI Chart Levels
Nikolay Mitrofanov
5 (6)
The indicator draws levels based on the overbought and oversold values ​​of the RSI indicator. The maximum values ​​are taken into account, which are equal to or exceeded certain limits. That is, for example, when the price has gone into the overbought zone, the highest price is selected from all prices in this zone for this period of time, and as soon as the indicator value returns to a value below the overbought value, the level is fixed and the calculation of new values ​​begins. The sam
FREE
이 제품의 구매자들이 또한 구매함
Atomic Analyst MT5
Issam Kassas
4.78 (18)
우선적으로 언급할 점은이 거래 지표가 다시 그리지 않고 지연되지 않으며 이를 통해 수동 및 로봇 거래 모두에 이상적이라는 점입니다. 사용자 매뉴얼: 설정, 입력 및 전략. Atomic Analyst는 가격의 강도와 모멘텀을 활용하여 시장에서 더 나은 이점을 찾는 PA Price Action Indicator입니다. 고급 필터를 장착하여 잡음과 거짓 신호를 제거하고 거래 잠재력을 높이는 데 도움이 됩니다. 복잡한 지표의 다중 레이어를 사용하여 Atomic Analyst는 차트를 스캔하고 복잡한 수학적 계산을 간단한 신호와 색상으로 변환하여 초보 트레이더가 이해하고 일관된 거래 결정을 내릴 수 있도록합니다. "Atomic Analyst"는 새로운 및 경험이 풍부한 트레이더를위한 종합적인 거래 솔루션입니다. 프리미엄 지표와 최고 수준의 기능을 하나의 거래 전략에 결합하여 모든 종류의 트레이더에 대한 다재다능한 선택지가되었습니다. 인트라데이 거래 및 스캘핑 전략 : 빠르고 정확한
Gold Stuff mt5
Vasiliy Strukov
4.9 (182)
Gold Stuff mt5는 금을 위해 특별히 설계된 추세 지표이며 모든 금융 상품에서도 사용할 수 있습니다. 표시기가 다시 그려지지 않고 지연되지 않습니다. 권장 기간 H1. 설정 및 개인 보너스를 받으려면 구매 후 즉시 저에게 연락하십시오!     강력한 지원 및 트렌드 스캐너 표시기의 무료 사본을 받으실 수 있습니다. 메시지를 보내주세요. 나!   설정 화살표 그리기 - 켜기 끄기. 차트에 화살표 그리기. 경고 - 가청 경고를 끕니다. 이메일 알림 - 켜기 끄기. 이메일 알림. Puch-notification - 켜기 끄기. 푸시 알림. 다음으로 색 영역을 조정합니다. Gold Stuff mt5는 금을 위해 특별히 설계된 추세 지표이며 모든 금융 상품에서도 사용할 수 있습니다. 표시기가 다시 그려지지 않고 지연되지 않습니다. 권장 기간 H1. 설정 및 개인 보너스를 받으려면 구매 후 즉시 저에게 연락하십시오!   설정 화살표 그리기 - 켜기 끄기. 차트에
우선 이 거래 시스템이 리페인팅, 리드로잉 및 레이그 인디케이터가 아니라는 점을 강조하는 것이 중요합니다. 이는 수동 및 로봇 거래 모두에 이상적인 것으로 만듭니다. 온라인 강좌, 설명서 및 프리셋 다운로드. "스마트 트렌드 트레이딩 시스템 MT5"은 새로운 및 경험이 풍부한 트레이더를 위해 맞춤형으로 제작된 종합적인 거래 솔루션입니다. 10개 이상의 프리미엄 인디케이터를 결합하고 7개 이상의 견고한 거래 전략을 특징으로 하여 다양한 시장 조건에 대한 다목적 선택이 가능합니다. 트렌드 추종 전략: 효과적인 트렌드 추이를 타기 위한 정확한 진입 및 손절 관리를 제공합니다. 반전 전략: 잠재적인 트렌드 반전을 식별하여 트레이더가 범위 시장을 활용할 수 있게 합니다. 스캘핑 전략: 빠르고 정확한 데이 트레이딩 및 단기 거래를 위해 설계되었습니다. 안정성: 모든 인디케이터가 리페인팅, 리드로잉 및 레이그가 아니므로 신뢰할 수 있는 신호를 보장합니다. 맞춤화: 개별 거래 선호도를 고려한 맞춤
Quantum Trend Sniper
Bogdan Ion Puscasu
4.92 (48)
소개       Quantum Trend Sniper Indicator는   추세 반전을 식별하고 거래하는 방식을 변화시키는 획기적인 MQL5 지표입니다! 13년 이상의 거래 경험을 가진 숙련된 트레이더 팀이 개발한       Quantum Trend Sniper 표시기       매우 높은 정확도로 추세 반전을 식별하는 혁신적인 방법으로 거래 여정을 새로운 차원으로 끌어올리도록 설계되었습니다. ***Quantum Trend Sniper Indicator를 구입하면 Quantum Breakout Indicator를 무료로 받을 수 있습니다!*** Quantum Trend Sniper Indicator는 추세 반전을 식별하고 세 가지 이익실현 수준을 제안할 때 경고, 신호 화살표를 제공합니다. 초보자 거래자와 전문 거래자 모두에게 적합합니다. Quantum EA 채널:       여기를 클릭하세요 MT4 버전:       여기를 클릭하세요
TPSproTREND PrO MT5
Roman Podpora
4.89 (9)
TPSpro TRENDPRO  - is a trend indicator that automatically analyzes the market and provides information about the trend and each of its changes, as well as giving signals for entering trades without redrawing! The indicator uses each candle, analyzing them separately. referring to different impulses - up or down impulse. Exact entry points into transactions for currencies, crypto, metals, stocks, indices!  -  Version MT4               DETAILED DESCRIPTION               R ecommended to use with
Trend Screener Pro MT5
STE S.S.COMPANY
4.88 (66)
트렌드 표시기, 트렌드 트레이딩 및 필터링을 위한 획기적인 고유 솔루션, 하나의 도구 안에 내장된 모든 중요한 트렌드 기능! Forex, 상품, 암호 화폐, 지수 및 주식과 같은 모든 기호/도구에 사용할 수 있는 100% 다시 칠하지 않는 다중 시간 프레임 및 다중 통화 표시기입니다. Trend Screener는 차트에 점이 있는 화살표 추세 신호를 제공하는 효율적인 지표 추세 추종 지표입니다. 추세 분석기 표시기에서 사용할 수 있는 기능: 1. 트렌드 스캐너. 2. 최대 이익 분석이 있는 추세선. 3. 추세 통화 강도 측정기. 4. 경고가 있는 추세 반전 점. 5. 경고가 있는 강력한 추세 점. 6. 추세 화살표 Trend Screener Indicator가 있는 일일 분석 예, 일일 신호 성능...등은 여기에서 찾을 수 있습니다. 여기를 클릭하십시오. LIMITED TIME OFFER : Trend Screener Indicator는 50$ 및 평생 동안만 사용할 수 있습니다
Entry Points Pro for MT5
Yury Orlov
4.55 (161)
다시 색을 칠하지 않고 거래에 진입할 수 있는 정확한 신호를 제공하는 MT5용 지표입니다. 외환, 암호화폐, 금속, 주식, 지수 등 모든 금융 자산에 적용할 수 있습니다. 매우 정확한 추정값을 제공하고 매수와 매도의 가장 좋은 시점을 알려줍니다. 하나의 시그널로 수익을 내는 지표의 예와 함께 비디오 (6:22)시청하십시오! 대부분의 거래자는 Entry Points Pro 지표의 도움으로 첫 거래 주 동안 트레이딩 결과를 개선합니다. 저희의   Telegram Group 을 구독하세요! Entry Points Pro 지표의 좋은점. 재도색이 없는 진입 신호 신호가 나타나고 확인되면(시그널 캔들이 완성된 경우) 신호는 더 이상 사라지지 않습니다. 여타 보조지표의 경우 신호를 표시한 다음 제거되기 때문에 큰 재정적 손실로 이어집니다. 오류 없는 거래 게시 알고리즘을 통해 트레이드(진입 또는 청산)를 할 이상적인 순간을 찾을 수 있으며, 이를 통해 이를 사용하는 모든 거래자의
우선적으로, 이 거래 도구는 전문적인 거래에 이상적인 비-다시 그리기 및 지연되지 않는 지표입니다.  온라인 강좌, 사용자 매뉴얼 및 데모. 스마트 가격 액션 컨셉트 인디케이터는 신규 및 경험 많은 트레이더 모두에게 매우 강력한 도구입니다. Inner Circle Trader Analysis 및 Smart Money Concepts Trading Strategies와 같은 고급 거래 아이디어를 결합하여 20가지 이상의 유용한 지표를 하나로 결합합니다. 이 인디케이터는 스마트 머니 컨셉트에 중점을 두어 대형 기관의 거래 방식을 제공하고 이동을 예측하는 데 도움을 줍니다.  특히 유동성 분석에 뛰어나 기관이 어떻게 거래하는지 이해하는 데 도움을 줍니다. 시장 트렌드를 예측하고 가격 변동을 신중하게 분석하는 데 탁월합니다. 귀하의 거래를 기관 전략에 맞추어 시장의 동향에 대해 더 정확한 예측을 할 수 있습니다. 이 인디케이터는 시장 구조를 분석하고 중요한 주문 블록을 식별하
FX Volume MT5
Daniel Stein
4.94 (17)
모닝 브리핑을 통해 세부 정보와 스크린샷으로 매일 시장 업데이트를 받으세요 여기 mql5 및 텔레그램에서 FX 거래량은 브로커의 관점에서 시장 심리에 대한 실제 통찰력을 제공하는 최초이자 유일한 거래량 지표입니다. 브로커와 같은 기관 시장 참여자가 외환 시장에서 어떤 포지션을 취하고 있는지에 대한 훌륭한 통찰력을 COT 보고서보다 훨씬 빠르게 제공합니다. 차트에서 이 정보를 직접 확인하는 것은 트레이딩의 진정한 판도를 바꾸고 획기적인 솔루션입니다. 다음과 같은 고유한 시장 데이터 인사이트의 이점 비율 는 통화의 매수/매도 포지션 비율을 백분율로 표시 비율 변화 는 선택한 기간 내 매수 비율과 비율 변화를 표시 총 거래량 는 해당 통화의 총 거래량(롱 및 숏)을 로트 단위로 보여줍니다 Volumes Long 는 해당 통화의 모든 롱 포지션의 거래량을 보여줍니다 Volumes Short 는 해당 통화의 모든 숏 포지션의 거래량을 보여줍니다 Net Long 는 순 롱 포지션의 거래량
FX Power MT5 NG
Daniel Stein
5 (6)
모닝 브리핑 여기 mql5 와 텔레그램에서 FX Power MT5 NG 는 오랫동안 인기 있는 통화 강도 측정기인 FX Power의 차세대 버전입니다. 이 차세대 강도 측정기는 무엇을 제공합니까? 기존 FX Power에서 좋아했던 모든 것 PLUS GOLD/XAU 강도 분석 더욱 정밀한 계산 결과 개별 구성 가능한 분석 기간 더 나은 성능을 위한 사용자 정의 가능한 계산 한도 특별 멀티더 많은 것을보고 싶은 사람들을위한 특별한 다중 인스턴스 설정 모든 차트에서 좋아하는 색상을위한 끝없는 그래픽 설정 수많은 알림 옵션, 중요한 것을 다시는 놓치지 않도록 Windows 11 및 macOS 스타일의 둥근 모서리가 있는 새로운 디자인 마법처럼 움직이는 인디케이터 패널 FX 파워 키 특징 모든 주요 통화의 완전한 강세 이력 모든 시간대에 걸친 통화 강세 이력 모든 브로커 및 차트에서 고유 계산 결과 100% 신뢰할 수있는 실시간100 % 신뢰할 수있는 실시간 계산-> 다시 칠하지 않음
이 대시보드는 선택한 심볼에 대해 사용 가능한 최신 고조파 패턴을 표시하므로 시간을 절약하고 더 효율적으로 사용할 수 있습니다 /   MT4 버전 . 무료 인디케이터:   Basic Harmonic Pattern 인디케이터 열 Symbol :   선택한 심볼이 나타납니다 Trend :   강세 또는 약세 Pattern :   패턴 유형(가틀리, 나비, 박쥐, 게, 상어, 사이퍼 또는 ABCD) Entry :   진입 가격 SL:   스톱로스 가격 TP1:   1차 테이크프로핏 가격 TP2:   2차 테이크프로핏 가격 TP3:   3차 테이크프로핏 가격 Current price:   현재 가격 Age (in bars):   마지막으로 그려진 패턴의 나이 주요 입력 Symbols :   "28개 주요 통화쌍" 또는 "선택한 심볼" 중에서 선택합니다. Selected Symbols :   쉼표로 구분하여 모니터링하려는 원하는 심볼("EURUSD,GBPUSD,XAUUSD")
TPSpro RFI Levels MT5
Roman Podpora
5 (8)
Reversal First Impulse levels (RFI)      INSTRUCTIONS        RUS       -       ENG              R ecommended to use with an indicator   -   TPSpro  TREND PRO -  Version MT4                 A key element in trading is zones or levels from which decisions to buy or sell a trading instrument are made. Despite attempts by major players to conceal their presence in the market, they inevitably leave traces. Our task was to learn how to identify these traces and interpret them correctly. Main functi
AT Forex Indicator MT5
Marzena Maria Szmit
5 (4)
The AT Forex Indicator MT5 is a sophisticated trading tool designed to provide traders with a comprehensive analysis of multiple currency pairs. This powerful indicator simplifies the complex nature of the forex market, making it accessible for both novice and experienced traders. AT Forex Indicator uses advanced algorithms to detect trends, patterns and is an essential tool for traders aiming to enhance their forex trading performance. With its robust features, ease of use, and reliable signal
소개       Quantum Breakout PRO   , 브레이크아웃 존 거래 방식을 변화시키는 획기적인 MQL5 지표! 13년 이상의 거래 경험을 가진 숙련된 트레이더 팀이 개발한       퀀텀 브레이크아웃 PRO       혁신적이고 역동적인 브레이크아웃 존 전략으로 거래 여정을 새로운 차원으로 끌어올리도록 설계되었습니다. Quantum Breakout Indicator는 5개의 이익 목표 영역이 있는 브레이크아웃 영역의 신호 화살표와 브레이크아웃 상자를 기반으로 한 손절 제안을 제공합니다. 초보자 거래자와 전문 거래자 모두에게 적합합니다. Quantum EA 채널:       여기를 클릭하세요 중요한! 구매 후 설치 매뉴얼을 받으려면 개인 메시지를 보내주십시오. 추천: 기간: M15 통화쌍: GBPJPY, EURJPY, USDJPY,NZDUSD, XAUUSD 계정 유형: 스프레드가 매우 낮은 ECN, Raw 또는 Razor 브로커 시간: GM
IX Power MT5
Daniel Stein
4.17 (6)
IX Power는   마침내 FX Power의 탁월한 정밀도를 외환이 아닌 기호에도 적용했습니다. 좋아하는 지수, 주식, 원자재, ETF, 심지어 암호화폐까지 단기, 중기, 장기 추세의 강도를 정확하게 파악할 수 있습니다. 단말기가 제공하는   모든 것을 분석할   수 있습니다. 사용해 보고 트레이딩   타이밍이 크게 향상되는   것을 경험해 보세요. IX Power 주요 특징 단말기에서 사용 가능한 모든 거래 심볼에 대해 100% 정확한 비재도장 계산 결과 제공 사전 구성 및 추가적으로 개별 구성 가능한 강도 분석 기간의 드롭다운 선택 가능 이메일, 메시지, 모바일 알림을 통한 다양한 알림 옵션 제공 EA 요청을 위한 액세스 가능한 버퍼 더 나은 성능을 위한 사용자 지정 가능한 계산 한도 더 많은 것을 보고 싶은 사용자를 위한 특별 다중 인스턴스 설정 모든 차트에서 좋아하는 색상을 위한 무한한 그래픽 설정 가능 Windows 11 및 macOS 스타일의 둥
Matrix Arrow Indicator MT5
Juvenille Emperor Limited
5 (14)
매트릭스 화살표 표시기 MT5 는 외환, 상품, 암호 화폐, 지수, 주식과 같은 모든 기호/도구에 사용할 수 있는 100% 다시 칠하지 않는 다중 기간 표시기를 따르는 고유한 10 in 1 추세입니다.  Matrix Arrow Indicator MT5 는 다음과 같은 최대 10개의 표준 지표에서 정보와 데이터를 수집하여 초기 단계에서 현재 추세를 결정합니다. 평균 방향 이동 지수(ADX) 상품 채널 지수(CCI) 클래식 하이켄 아시 캔들 이동 평균 이동 평균 수렴 발산(MACD) 상대 활력 지수(RVI) 상대 강도 지수(RSI) 포물선 SAR 스토캐스틱 오실레이터 윌리엄스의 백분율 범위 모든 지표가 유효한 매수 또는 매도 신호를 제공하면 강력한 상승/하락 추세를 나타내는 다음 캔들/막대가 시작될 때 해당 화살표가 차트에 인쇄됩니다. 사용자는 사용할 표시기를 선택하고 각 표시기의 매개변수를 개별적으로 조정할 수 있습니다. 매트릭스 화살표 표시기 MT5는 선택한 표시기에서만 정보를 수
Trend Sensor MT5
Yuriy Lyachshenko
인디케이터는 가장 적절한 진입 및 청산 지점을 보여줍니다. 또한 더 나은 거래 분석을 위해 모든 신호에 대한 통계 데이터를 표시합니다. 이 지표의 도움으로 시장을 더 잘 이해할 수 있습니다. 추세의 힘이 약해지기 시작하면 (패널에 표시됨) 추세선이 수평 위치로 끌리게되며 이것이 거래를 종료하라는 신호입니다. 또는 평균 / 중간 수익 수준에 도달하면 종료 할 수 있습니다. 이 인디케이터는 2010년 이후 제 트레이딩 경험의 결과입니다. MT4용 인디케이터 버전 특징 이 인디케이터는 다시 그려지지 않습니다. 과거 차트에 인쇄된 내용도 실시간으로 인쇄됩니다. 암호화폐, 주식, 금속, 지수, 원자재, 통화 등 모든 자산 거래에 사용할 수 있습니다. 모든 차트주기에 사용할 수 있습니다. 진입 신호는 새 캔들이 열릴 때 나타납니다. 거래 종료 신호는 더 큰 수익으로 거래를 종료할 수 있는 경우가 많기 때문에 잠정적으로 제공됩니다. 왼쪽 상단에는 최소화 할 수있는 자세한 거래 통
PZ Day Trading MT5
PZ TRADING SLU
2.83 (6)
This indicator detects price reversals in a zig-zag fashion, using only price action analysis and a donchian channel. It has been specifically designed for short-term trading, without repainting or backpainting at all. It is a fantastic tool for shrewd traders aiming to increase the timing of their operations. [ Installation Guide | Update Guide | Troubleshooting | FAQ | All Products ] Amazingly easy to trade It provides value on every timeframe It displays suitable SL and TP levels It impl
PZ Trend Trading MT5
PZ TRADING SLU
3.67 (3)
Trend Trading is an indicator designed to profit as much as possible from trends taking place in the market, by timing pullbacks and breakouts. It finds trading opportunities by analyzing what the price is doing during established trends. [ Installation Guide | Update Guide | Troubleshooting | FAQ | All Products ] Trade financial markets with confidence and efficiency Profit from established trends without getting whipsawed Recognize profitable pullbacks, breakouts and early reversals The ind
이 대시보드는 선택한 기호에 대한 거래 전략에 따라 스캘핑 모드와 장기 모드 모두에서 차트의 공급 및 수요 영역을 검색하고 표시합니다. 또한 대시보드의 스캐너 모드를 통해 원하는 모든 기호를 한눈에 확인하고 적합한 위치를 놓치지 않도록 도와줍니다 / MT4 버전 . 무료 보조지표:   Basic Supply Demand 특징 여러 통화쌍에 대한 거래 기회를 볼 수 있으며, 공급 및 수요 영역에 대한 근접성에 따라 순위가 매겨진 모든 쌍을 명확하고 간결하게 볼 수 있습니다. 색상부터 감지 매개변수까지 특정 요구에 맞게 사용자 지정 설정 가능 주요 입력 Indicator mode :   표시기 모드 또는 새로운 기능이 포함된 패널 모드 중에서 선택 가능 Symbols :   "28개 주요 통화쌍" 또는 "선택한 심볼" 중에서 선택 Selected Symbols :   쉼표로 구분하여 모니터링하려는 원하는 심볼("EURUSD, GBPUSD, XAUUSD")을 선택합
Blahtech Supply Demand MT5
Blahtech Limited
4.54 (13)
Was: $299  Now: $99   Supply Demand uses previous price action to identify potential imbalances between buyers and sellers. The key is to identify the better odds zones, not just the untouched ones. Blahtech Supply Demand indicator delivers functionality previously unavailable on any trading platform. This 4-in-1 indicator not only highlights the higher probability zones using a multi-criteria strength engine, but also combines it with multi-timeframe trend analysis, previously confirmed swings
Auto Order Block with break of structure based on ICT and Smart Money Concepts (SMC) Futures Break of Structure ( BoS )             Order block ( OB )            Higher time frame Order block / Point of Interest ( POI )    shown on current chart           Fair value Gap ( FVG ) / Imbalance   -  MTF      ( Multi Time Frame )    HH/LL/HL/LH  -  MTF      ( Multi Time Frame )  Choch  MTF      ( Multi Time Frame )  Volume Imbalance     ,  MTF          vIMB Gap’s Power of 3 Equal High
ICT, SMC, SMART MONEY CONCEPTS, SMART MONEY, Smart Money Concept, Support and Resistance, Trend Analysis, Price Action, Market Structure, Order Blocks, BOS/CHoCH,   Breaker Blocks ,  Momentum Shift,   Supply&Demand Zone/Order Blocks , Strong Imbalance,   HH/LL/HL/LH,    Fair Value Gap, FVG,  Premium  &   Discount   Zones, Fibonacci Retracement, OTE, Buy Side Liquidity, Sell Side Liquidity, BSL/SSL Taken, Equal Highs & Lows, MTF Dashboard, Multiple Time Frame, BigBar, HTF OB, HTF Market Structure
Easy Buy Sell Signal Alert
Franck Martin
4.86 (7)
Easy By Sell is a market indicator for opening and closing positions. It becomes easy to track market entries with alerts. It indicates trend reversal points when a price reaches extreme values ​​and the most favorable time to enter the market. it is as effective as a Fibonacci to find a level but it uses different tools such as an algorithm based on ATR indicators and Stochastic Oscillator. You can modify these two parameters as you wish to adapt the settings to the desired period. My othe
Dark Absolute Trend MT5
Marco Solito
5 (11)
Dark Absolute Trend   is an Indicator for intraday trading. This Indicator is based on   Trend Following  strategy but use also candlestick patterns and Volatility. We can enter in good price with this Indicator, in order to follow the main trend on the current instrument. It is advised to use low spread ECN brokers. This Indicator does   Not repaint   and   N ot lag . Recommended timeframes are M5, M15 and H1. Recommended working pairs: All. I nstallation and  Update Guide   -  Troubleshooting
MTF Supply Demand Zones MT5
Georgios Kalomoiropoulos
자동화된 수요 및 공급 구역의 차세대. 모든 차트에서 작동하는 새롭고 혁신적인 알고리즘. 모든 구역은 시장의 가격 움직임에 따라 동적으로 생성됩니다. 두 가지 유형의 경고 --> 1)가격이 영역에 도달할 때 2)새로운 영역이 형성될 때 당신은 더 이상 쓸모없는 지표를 얻을 수 없습니다. 입증된 결과로 완벽한 거래 전략을 얻을 수 있습니다.     새로운 기능:     가격이 공급/수요 영역에 도달하면 경고     새로운 공급/수요 구역이 생성되면 알림     푸시 알림 알림     핍의 영역 너비 레이블     기동특무부대에 한 번 더 시간이 주어집니다. 따라서 현재보다 위의 2개의 시간 프레임 대신 현재보다 높은 3개의 시간 프레임을 볼 수 있습니다.     Alerts/Zones/MTF 기능을 활성화/비활성화하는 버튼 당신이 얻는 이점:     거래에서 감정을 제거하십시오.     거래 항목을 객
Blahtech Market Profile MT5
Blahtech Limited
5 (9)
Was: $249  Now: $99   Market Profile defines a number of day types that can help the trader to determine market behaviour. A key feature is the Value Area, representing the range of price action where 70% of trading took place. Understanding the Value Area can give traders valuable insight into market direction and establish the higher odds trade. It is an excellent addition to any system you may be using. Inspired by Jim Dalton’s book “Mind Over Markets”, this indicator is designed to suit the
가격이 역전되고 후퇴함에 따라 시장 구조가 변경됩니다. 시장 구조 반전 경고 표시기는 추세 또는 가격 움직임이 고갈에 가까워지고 반전할 준비가 되었음을 식별합니다. 일반적으로 반전이나 큰 하락이 일어나려고 할 때 발생하는 시장 구조의 변화를 알려줍니다. 지표는 가능한 고갈 지점 근처에서 새로운 고점 또는 저점이 형성될 때마다 초기에 돌파와 가격 모멘텀을 식별합니다. 표시기는 반대쪽에 있는 마지막 촛불에 직사각형을 그립니다. 그런 다음 현재의 단기 추세에서 계속 움직이기 때문에 가격과 함께 직사각형을 따라갈 것입니다. 가격이 사각형 위나 아래로 다시 닫힐 정도로 약해지면 시장 구조에 잠재적인 변화가 일어나고 있음을 나타냅니다. 그런 다음 표시기는 방향의 잠재적인 이동과 추세 또는 주요 하락의 가능한 반전 시작에 대해 경고합니다. 작동 방식을 보려면 아래의 작동 표시기를 참조하십시오! 모든 쌍 및 주요 기간을 모니터링하는 대시보드: https://www.mql5.com/
[ MT4 Version ] Only the next 10 units at current price! Final price: $299 Are you tired of spending months on demo or live accounts to test your trading strategies? The Backtesting Simulator is the ultimate tool designed to elevate your backtesting experience to new heights. Utilizing Metatrader historical symbol information, it offers an unparalleled simulation of real market conditions. Take control of your testing speed, test ideas quickly or at a slower pace, and witness remarkable improve
Volume by Price MT5
Brian Collard
3.6 (5)
The Volumebyprice.com Indicator for MetaTrader 5 features Volume Profile and Market Profile TPO (Time Price Opportunity). Volume and TPO histogram bar and line charts. Volume Footprint charts. TPO letter and block marker collapsed and split structure charts. Static, dynamic and flexible range segmentation and compositing methods with relative and absolute visualizations. Session hours filtering and segment concatenation with Market Watch and custom user specifications. Graphical layering, posit
제작자의 제품 더 보기
Doteki Heikin Ashi for MT5
Fernando Carreiro
4 (6)
(Google 번역) 표준 Heikin Ashi 캔들 표현에는 지수 총 가격 의 이동 평균(EMA) 이며, EMA 의 알파 값은 고정되어 있습니다. 0.5에서( EMA 기간 3.0에 해당) 이 동적 버전에서 기간은 사용하려는 값으로 변경할 수 있으며 이를 통해 다음을 수행할 수도 있습니다. 대략적인 다중 시간 프레임 분석 또는 일종의 후행 손절매로 낮은 값 또는 높은 값을 사용합니다. 의 교차점 Heikin Ashi 시가에 대한 실제 종가 가격은 또한 추세 방향. 또한 표준 EMA 외에도 이 버전에는 거의 제로 지연 EMA 를 사용할 수 있는 옵션도 있습니다. 대신, 특히 더 긴 기간을 사용할 때 추세 방향의 변화를 더 빠르게 감지할 수 있습니다. 평균. 지표를 차트에 첨부할 때 차트를 차트로 자동 전환하는 옵션도 있습니다. 선 그래프 모드 와 선택적으로 선 그래프 에서 실제 종가 를 숨길 수 있습니다. 그렇지 않으면 실제 종가 가격과 Heikin Ashi 열린 가치. (Ori
FREE
Time Segmented Volume for MT5
Fernando Carreiro
5 (1)
(Google 번역) 이 지표는 Worden Brothers, Inc 에서 개발한 원본 " TSV(Time Segmented Volume) "를 기반으로 합니다. 그러나 여기에 몇 가지 기능을 추가했습니다. 원본에서 사용하는 기본 종가만 사용하는 대신 적용할 가격을 선택할 수 있습니다. 실제 범위를 기반으로 하는 가상 볼륨을 포함하거나 볼륨 가중치를 전혀 적용하지 않는 등 사용할 볼륨 가중치를 선택할 수도 있습니다. (Original text) This indicator is based on the original “ Time Segmented Volume (TSV) ” developed by Worden Brothers, Inc . However, I added an extra few features to this one. One can choose the price to be applied, instead of only having the default close price us
FREE
Doteki Heikin Ashi for MT4
Fernando Carreiro
5 (1)
(Google 번역) 표준 Heikin Ashi 캔들 표현에는 지수 총 가격 의 이동 평균(EMA) 이며, EMA 의 알파 값은 고정되어 있습니다. 0.5에서( EMA 기간 3.0에 해당) 이 동적 버전에서 기간은 사용하려는 값으로 변경할 수 있으며 이를 통해 다음을 수행할 수도 있습니다. 대략적인 다중 시간 프레임 분석 또는 일종의 후행 손절매로 낮은 값 또는 높은 값을 사용합니다. 의 교차점 Heikin Ashi 시가에 대한 실제 종가 가격은 또한 추세 방향. 또한 표준 EMA 외에도 이 버전에는 거의 제로 지연 EMA 를 사용할 수 있는 옵션도 있습니다. 대신, 특히 더 긴 기간을 사용할 때 추세 방향의 변화를 더 빠르게 감지할 수 있습니다. 평균. 지표를 차트에 첨부할 때 차트를 차트로 자동 전환하는 옵션도 있습니다. 선 그래프 모드 와 선택적으로 선 그래프 에서 실제 종가 를 숨길 수 있습니다. 그렇지 않으면 실제 종가 가격과 Heikin Ashi 열린 가치. (Ori
FREE
(Google 번역) 이 지표는 John Welles Wilder Jr. 가 개발한 원래의 " Average True Range (ATR) "를 구현합니다. 기술 거래 시스템의 새로운 개념[1978] . 단순 이동 평균(SMA) 대신 SMMA(Smoothed 이동 평균) 라고도 하는 Wilder의 이동 평균 을 사용합니다. MetaTrader의 내장 ATR 지표에 사용됩니다. 적용되는 기본 기간은 책의 설명에 따라 14가 아닌 7입니다. (Original text) This indicator implements the original “ Average True Range (ATR) ” developed by John Welles Wilder Jr. , as described in his book— New Concepts in Technical Trading Systems [1978] . It uses Wilder’s moving average , also known as the sm
FREE
(Google 번역) 이 지표는 Worden Brothers, Inc 에서 개발한 원본 " TSV(Time Segmented Volume) "를 기반으로 합니다. 그러나 여기에 몇 가지 기능을 추가했습니다. 원본에서 사용하는 기본 종가만 사용하는 대신 적용할 가격을 선택할 수 있습니다. 실제 범위를 기반으로 하는 가상 볼륨을 포함하거나 볼륨 가중치를 전혀 적용하지 않는 등 사용할 볼륨 가중치를 선택할 수도 있습니다. (Original text) This indicator is based on the original “ Time Segmented Volume (TSV) ” developed by Worden Brothers, Inc . However, I added an extra few features to this one. One can choose the price to be applied, instead of only having the default close price us
FREE
(Google 번역) 이 지표는 John Welles Wilder의 ATR(Average True Range) 에서 영감을 받았지만 몇 가지 추가 정보가 있습니다. 마찬가지로 실제 범위의 지수 이동 평균을 계산하지만 와일더 대신 표준 알파 가중치를 사용합니다. 또한 범위 평균의 평균 편차를 계산하여 오프셋으로 표시합니다. 이렇게 하면 변경 사항을 더 빠르게 식별할 수 있을 뿐만 아니라 그 영향도 파악할 수 있습니다. (Original text) This indicator was inspired by John Welles Wilder's average true range (ATR) , but with some extra information. Similarly, it calculates the exponential moving average of the true range, but using the standard alpha weight instead of Wilder's . It a
FREE
(자동번역) 대부분의 거래자들은 1700년대 혼마 무네히사(Munehisa Homma) 가 창안한 일본의 유명한 하이킨 아시(Heikin-Ashi) 지표를 알고 있습니다. 때때로 Heiken-Ashi 로 표기되지만 그 의미는 동일하게 유지됩니다. 즉 일본어에서는 "평균 막대"입니다. 이는 매우 잘 알려진 Heikin Ashi 표시기의 구현이지만 몇 가지 기능이 추가되었습니다. 우선, 틱 카운트 볼륨, 실제 볼륨 또는 실제 범위를 기반으로 한 의사 볼륨 등 해당 값에 볼륨 에 따라 가중치 를 부여할 수 있습니다. 주요 이점은 특히 거래량이 적은 기간 동안 잘못된 반전의 수를 줄이는 것입니다. 또한 최고점과 최저점의 추적을 늦추는 데 도움이 됩니다. 옵션으로 막대의 실제 범위를 기반으로 의사 볼륨을 사용할 수 있습니다. 이는 실제 거래량이나 틱 카운트 거래량 데이터가 없는 기호에 유용합니다. 추가 기능으로 이 표시기는 정지에 사용할 수 있는 최대 이동 수준도 표시합니다. 계산의 기초를
(Google 번역) 이 지표는 MetaTrader 설치와 함께 소스 코드 예제로 제공된 원본 지그재그 를 기반으로 합니다. "깊이" 채널과 해당 브레이크 아웃을 표시하기 위한 몇 가지 추가 기능으로 다시 작성했습니다. 또한 이전 지그재그 지점을 관찰할 수 있습니다. 선택적으로 탈주 발생 시 사용자에게 경고할 수 있습니다. 알림은 단순히 단말기에 있을 수도 있고 모바일 기기의 푸시 알림을 통해 나만의 맞춤 텍스트로 보낼 수도 있습니다. (Original text) This indicator is based on the original ZigZag provided as a source code example with MetaTrader installations. I rewrote it with some extra features for displaying the “depth” channel and the respective break-outs. It also allows one to
(자동번역) 대부분의 거래자들은 1700년대 혼마 무네히사(Munehisa Homma) 가 창안한 일본의 유명한 하이킨 아시(Heikin-Ashi) 지표를 알고 있습니다. 때때로 Heiken-Ashi 로 표기되지만 그 의미는 동일하게 유지됩니다. 즉 일본어에서는 "평균 막대"입니다. 이는 매우 잘 알려진 Heikin Ashi 표시기의 구현이지만 몇 가지 기능이 추가되었습니다. 우선, 틱 카운트 볼륨, 실제 볼륨 또는 실제 범위를 기반으로 한 의사 볼륨 등 해당 값에 볼륨 에 따라 가중치 를 부여할 수 있습니다. 주요 이점은 특히 거래량이 적은 기간 동안 잘못된 반전의 수를 줄이는 것입니다. 또한 최고점과 최저점의 추적을 늦추는 데 도움이 됩니다. 옵션으로 막대의 실제 범위를 기반으로 의사 볼륨을 사용할 수 있습니다. 이는 실제 거래량이나 틱 카운트 거래량 데이터가 없는 기호에 유용합니다. 추가 기능으로 이 표시기는 정지에 사용할 수 있는 최대 이동 수준도 표시합니다. 계산의 기초를
ZigZag with Extras for MT5
Fernando Carreiro
5 (1)
(Google 번역) 이 지표는 MetaTrader 설치와 함께 소스 코드 예제로 제공된 원본 지그재그 를 기반으로 합니다. "깊이" 채널과 해당 브레이크 아웃을 표시하기 위한 몇 가지 추가 기능으로 다시 작성했습니다. 또한 이전 지그재그 지점을 관찰할 수 있습니다. 선택적으로 탈주 발생 시 사용자에게 경고할 수 있습니다. 알림은 단순히 단말기에 있을 수도 있고 모바일 기기의 푸시 알림을 통해 나만의 맞춤 텍스트로 보낼 수도 있습니다. (Original text) This indicator is based on the original ZigZag provided as a source code example with MetaTrader installations. I rewrote it with some extra features for displaying the “depth” channel and the respective break-outs. It also allows one to
필터:
리뷰 없음
리뷰 답변