OrderCalc
- 지표
- Thomas Quester
- 버전: 1.30
- 업데이트됨: 20 8월 2024
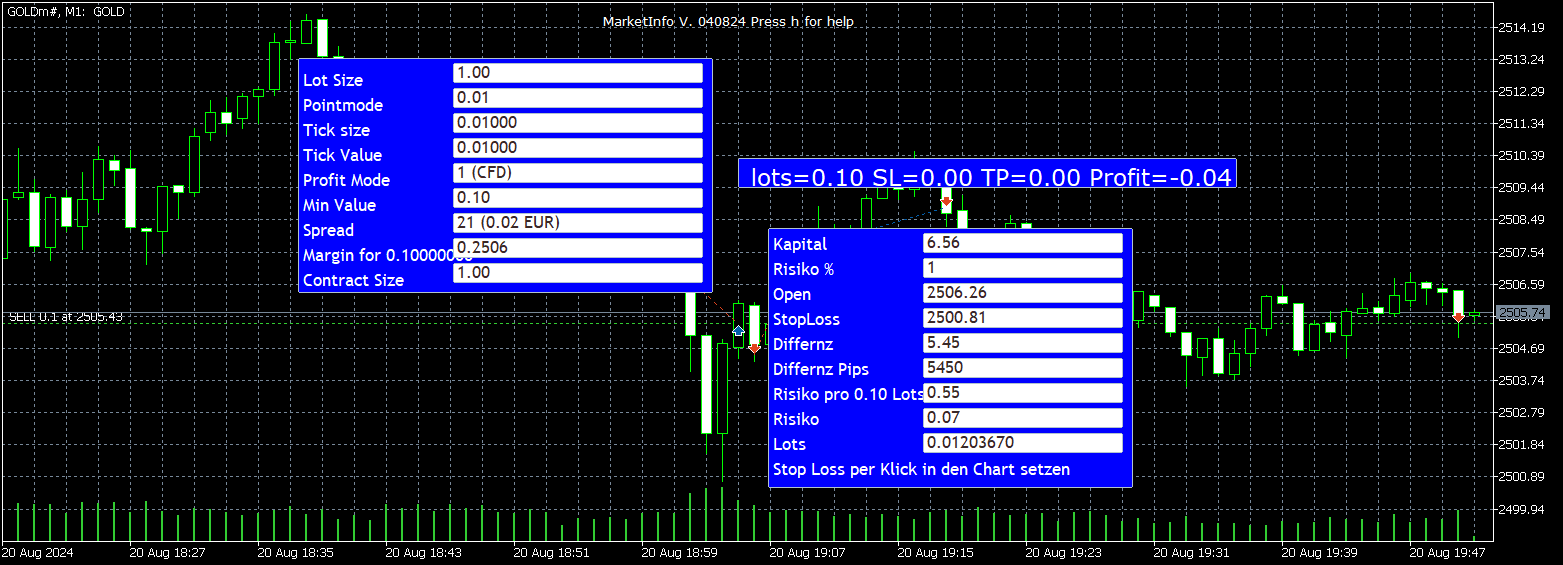
OrderCalc opens a window in the chart with the data of your orders:
Position size, stop loss, take profit, profit/loss
Only the positions for this symbol are displayed. If several positions exist, these are totalled and displayed in the last line.
If you work with pyramids, you can see at a glance how big the total profit or loss is.
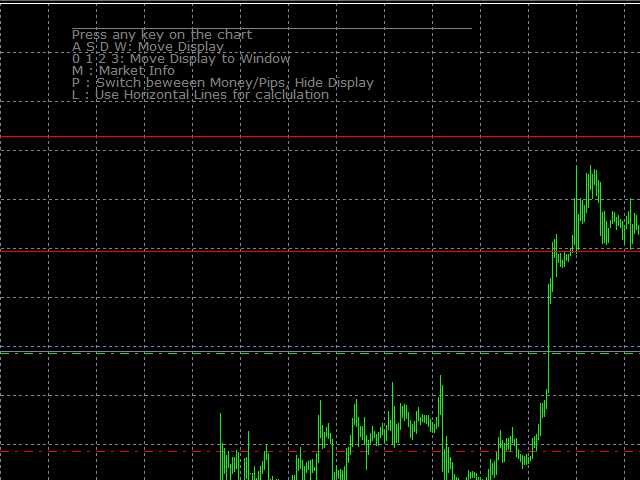
The indicator is invisible at the beginning, only when a position is opened does a window open containing the data for the order. In some cases the content is empty, in which case you can press the U button to update it.
The following buttons control the indicator when the button is pressed in the chart:
M can be used to display information about the symbol: Margin, spread, minimum order size, increment etc.
R opens the risk calculator. A click in the chart calculates the risk or profit for the minimum order size when the point at which the click is made is reached.
With X a file is created which contains the minimum lot size and the margin (if available) for all symbols, the file can be opened in Excel (CSAV format)
All windows can be moved with A S W D (the same keys used in video games).
H displays the help.
Translated with DeepL.com (free version)
No guarantee, the calculations may differ from the actual values. Trade at your own risk.