Previous Period High Low
- 지표
- Jake Mccallum Evans
- 버전: 1.0
- 활성화: 5
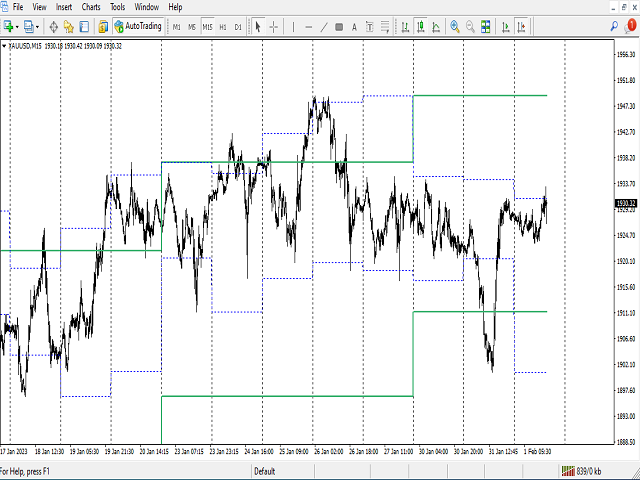
Previous Period High Low.
This indicator shows the previous Day, Week, Month and Years High and Low.
It's great for price action strategies.
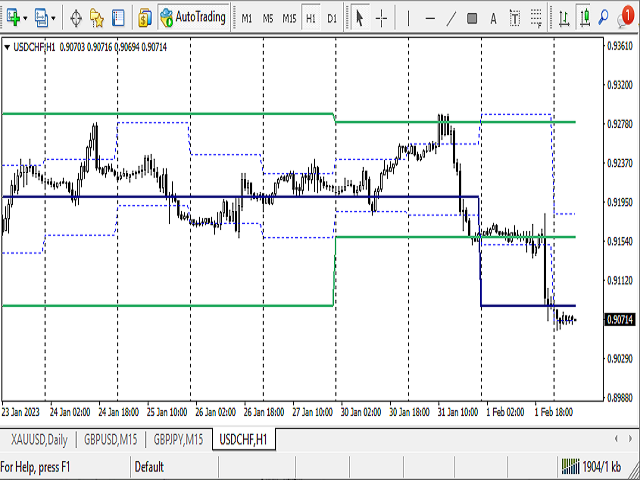
: Provides clear and visible breaks in structure.
: Easy to see breakout levels.
: Easy to see gaps between previous high, low levels after breakouts have occurred.
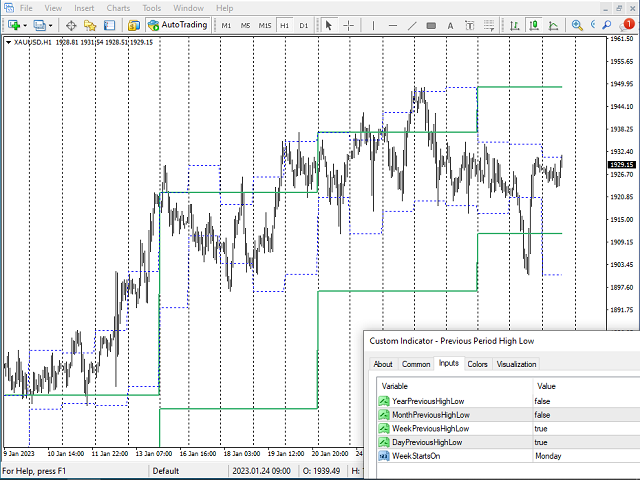
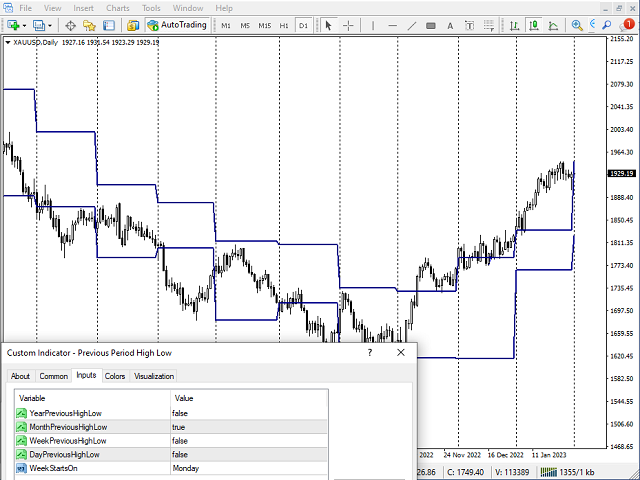
The indicator works on every time frame. Multiple periods can be selected and be seen on the same chart.
Every line can be customized to Your liking. Color, style and thickness.
Enjoy!