UR Gamma
- 지표
- Krzysztof Jan Debski
- 버전: 1.15
- 업데이트됨: 15 5월 2024
- 활성화: 5
UR 감마
(머신 러닝 시스템에서 발견되는 유사한 계산으로 구동됨)
UR Gamma는 기존 WaveTrend 지표에 새롭고 향상된 기능을 제공하는 최첨단 재무 분석 도구입니다. 고급 디지털 신호 처리 기술을 통합함으로써 UR 감마는 기존 WaveTrend 알고리즘의 일부 제한 사항을 해결하고 가격 움직임의 추세를 식별하고 측정하기 위한 보다 정확하고 강력하며 역동적인 접근 방식을 제공합니다.
UR 감마 사용의 이점:
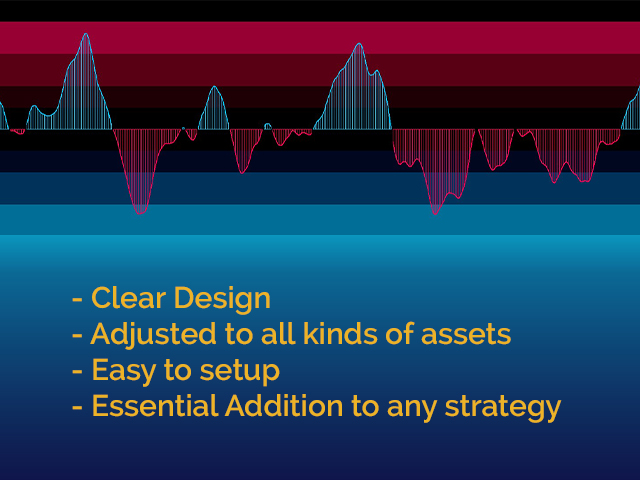
최소한의 설정
모든 데이터는 백그라운드에서 계산되고 있으며 사용자를 위한 출력은 단 1개로 명확하고 깔끔합니다.
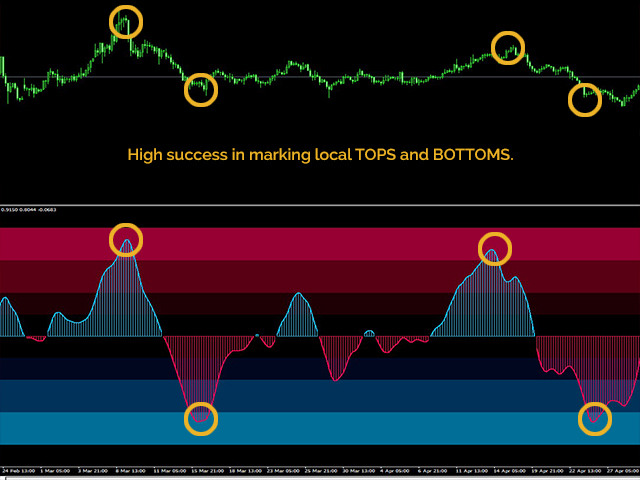
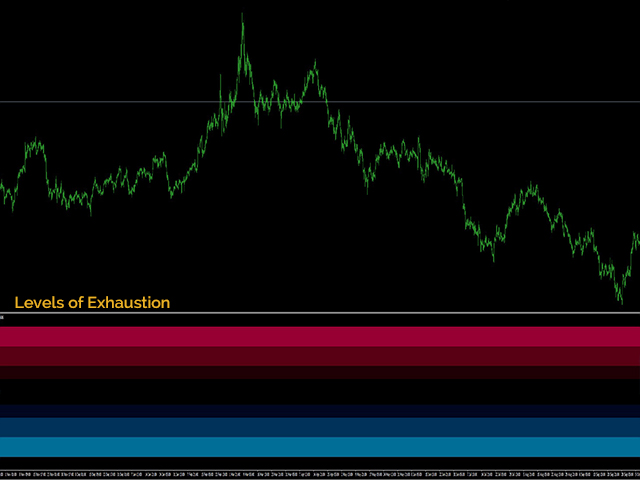
피로를 암시하는 배경 수준
모든 종류의 자산에 맞게 조정됩니다.
도구 업데이트를 최신 상태로 유지하고 빠진 것이 있다고 생각되면 요청을 보낼 수 있는 특별한 텔레그램 채팅이 있습니다!
왜 UR 감마인가?
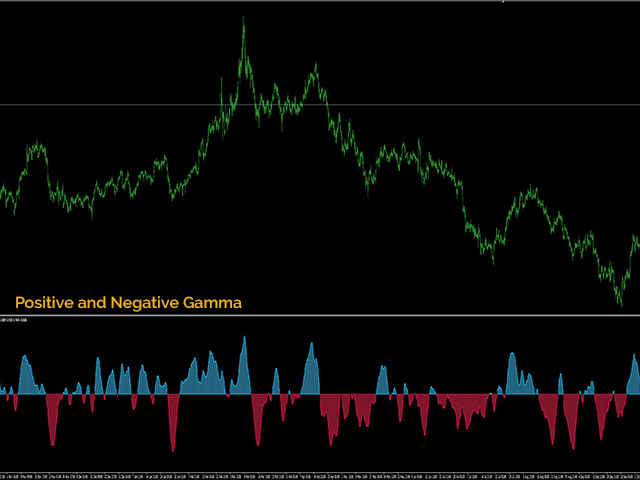
목표는 확률 분포가 -1과 1 사이에서 진동하도록 하고 0을 중간 지점으로 하는 것입니다. 이를 달성하기 위해 활성화 함수라고 하는 기계 학습의 기술을 사용하여 데이터를 변환합니다. 그러한 함수 중 하나는 -1과 1 사이의 값을 유지하기 때문에 신경망에서 자주 사용되는 하이퍼볼릭 탄젠트 함수입니다. -1에서 1 사이의 원하는 범위로 신호를 보냅니다.
UR 감마는 트레이더와 투자자를 위한 강력한 도구로서 시장 동향과 가격 움직임에 대한 보다 포괄적이고 신뢰할 수 있으며 실행 가능한 통찰력을 제공합니다. 이 알고리즘은 또한 여러 시간 프레임과 시장에 걸쳐 사용할 수 있도록 적응할 수 있으므로 모든 재무 분석 요구에 맞는 다재다능하고 유연한 솔루션입니다. 고유한 접근 방식과 고급 기능을 갖춘 UR 감마는 금융 시장에서 우위를 점하려는 전문 트레이더 또는 진지한 트레이더에게 꼭 필요한 도구입니다.
UR 감마를 사용하는 방법?
UR 감마는 트레이더가 가격 움직임의 추세를 식별하고 측정할 수 있도록 설계된 단선 오실레이터입니다. 오실레이터는 사용하기 쉽고 가격의 고갈 지점을 보여주는 배경 레벨과 함께 시장 동향을 명확하게 시각적으로 보여줍니다. UR 감마를 사용하려면 차트에 지표를 추가하고 선의 진동을 관찰하기만 하면 됩니다. 오실레이터는 -1과 1 사이에서 진동하며 중앙값은 0입니다. 선이 0 위에 있으면 시장이 상승 추세에 있음을 나타내고 0 아래에 있으면 하락 추세를 나타냅니다. 배경 수준은 가능한 가격 소진 지점을 명확하게 표시하므로 거래자는 그에 따라 조치를 취할 수 있습니다. 분석을 더욱 향상시키기 위해 사용자는 선호도 및 요구 사항에 맞게 설정을 조정할 수 있습니다.
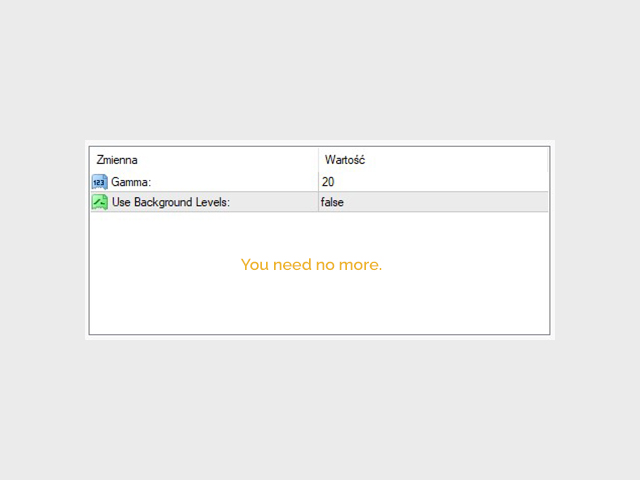
설정
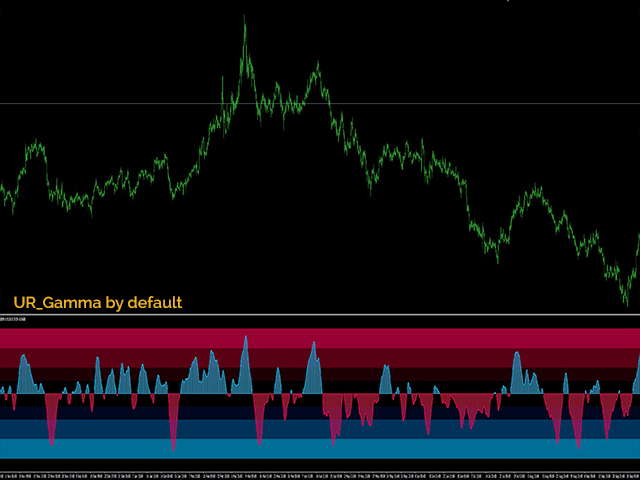
감마: 기본적으로 파도의 길이에 영향을 미치는 "룩백" 값 - 사용 중인 기간에 따라 조정하십시오.
배경 수준 사용: 버퍼 뒤의 고갈 시각화
표시하다
감마선: 가격의 고갈과 고점과 저점을 표시하는 재분배 수준을 보여줍니다.
배경 수준: 기본 설정으로 조정된 다양한 소모 수준을 표시합니다.