Equal Highs and Lows mt4
- 지표
- Barend Paul Stander
- 버전: 1.2
- 업데이트됨: 5 6월 2024
- 활성화: 10
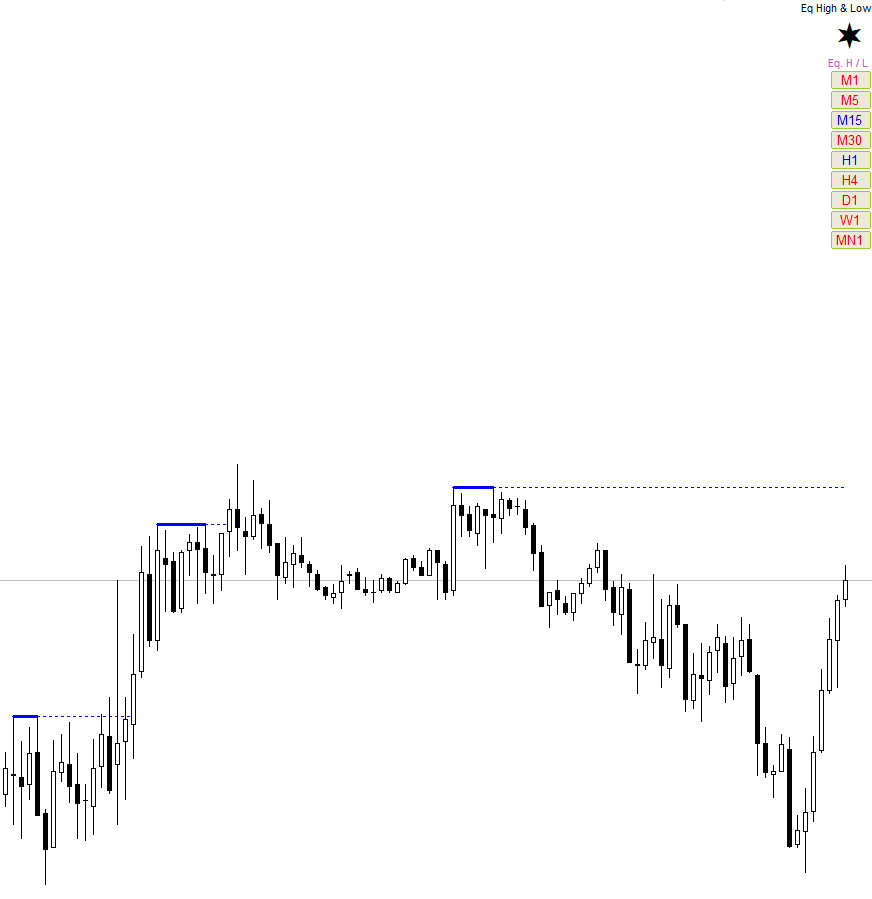
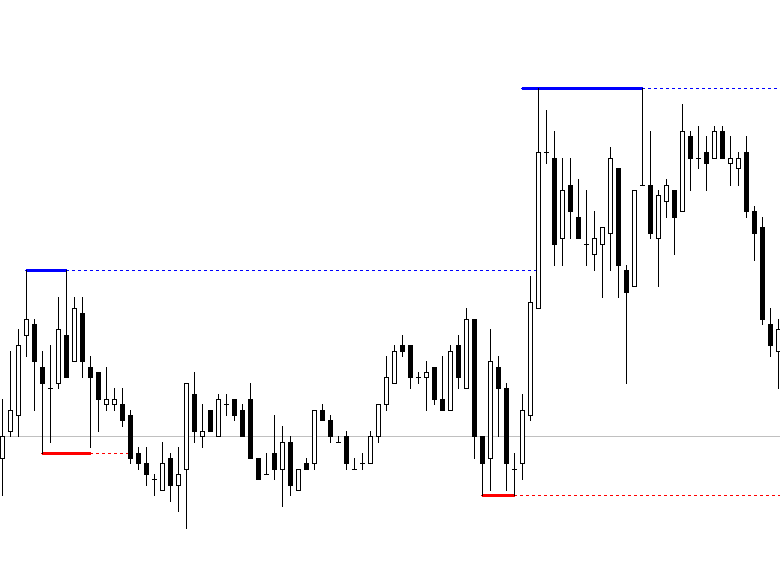
Equal Highs and Lows Indicator
Find and Mark Equal Highs and Lows on chart of Selected Multi Time frames.
Options:
- set min and max bars between Equal High's / Low's bars
- set max points difference between High's / Low's ( Sensitivity )
- Select time frames by buttons on chart
- Select / Filter only High's or Low's by a button
- Extend Equal High's / Low's line forward for chart reference

It works nicely. It would be possible to add an option that alerts when a new equal high/low is formed? Thanks!