Magic EMA MT5
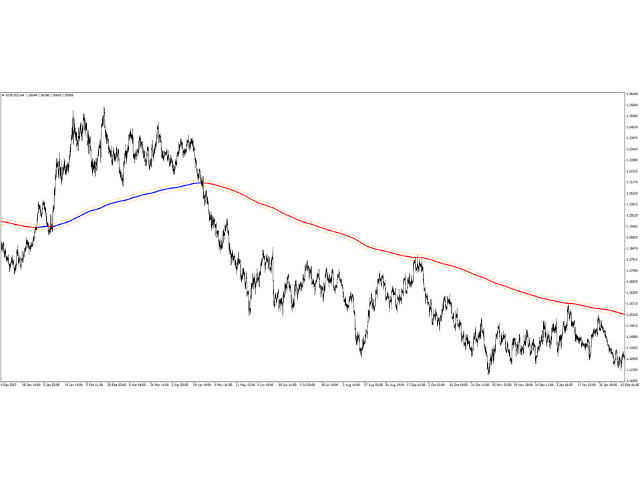
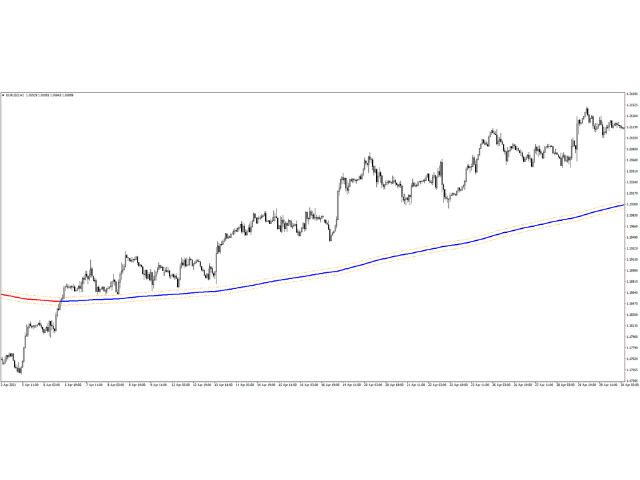
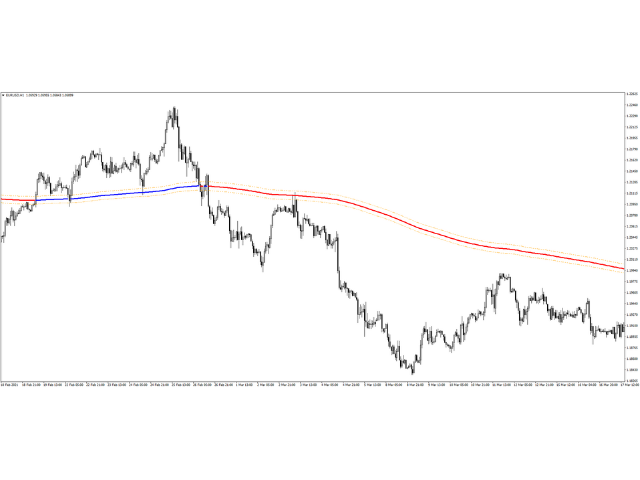
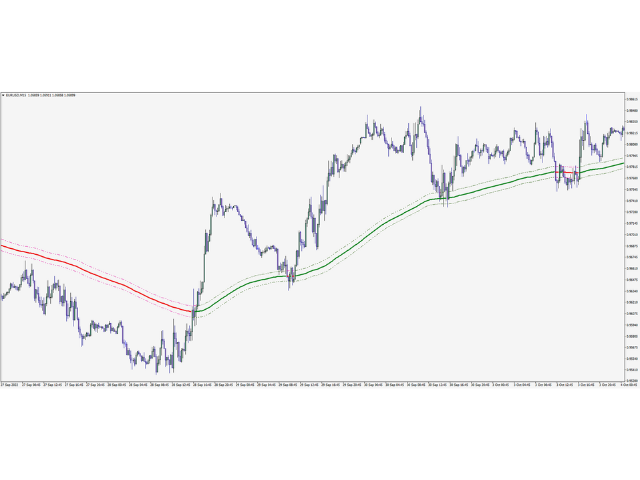
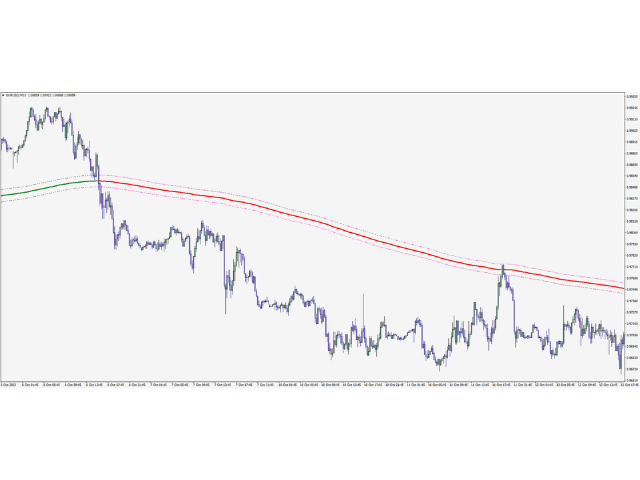
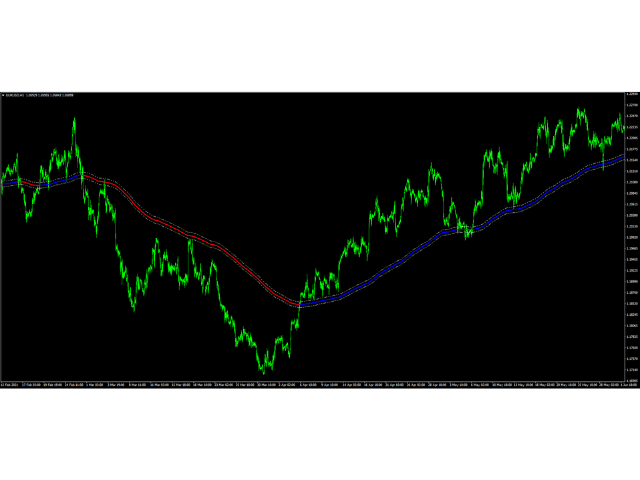
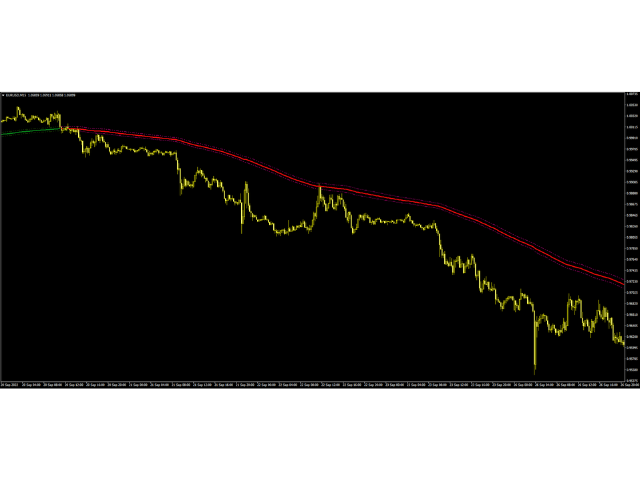
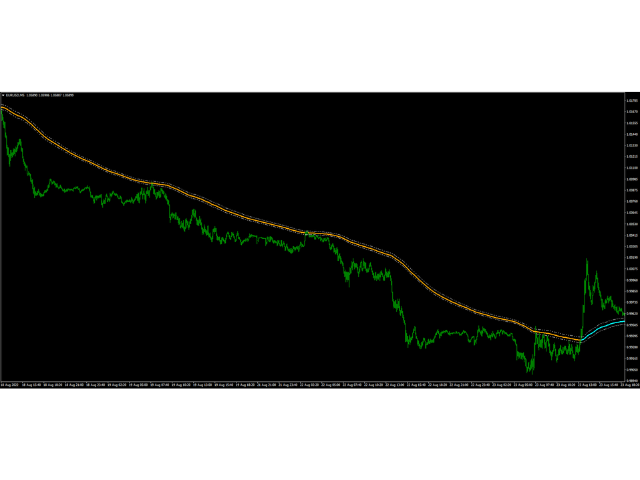
The Magic EMA indicator is of great help in determining trend direction. It can be an excellent addition to your existing strategy or the basis of a new one. We humans can make better decisions when we see better visually. So we designed it to show a different color for rising and falling trends. Everyone can customize this in the way that suits them best. By setting the Trend Period, we can optimize it for longer or shorter trends for our strategy. It is great for all time frames.
IF YOU NEED THE SOURCE CODE FOR YOUR PROJECT CONTACT ME. IT'S ONLY $50