DR and IDR mt5
- 지표
- Barend Paul Stander
- 버전: 1.4
- 업데이트됨: 20 3월 2023
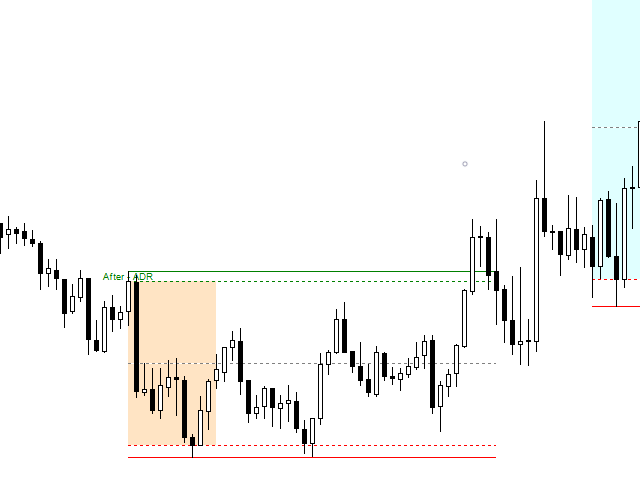
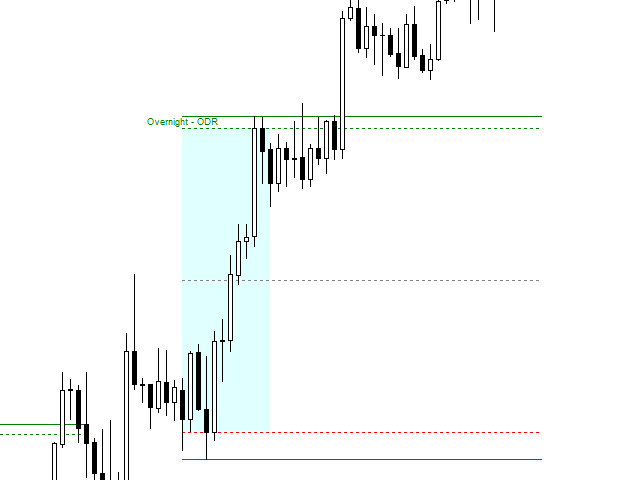
Defining Range ( DR ) and Implied Defining Range ( IDR ) indicator
New Pro version here :
https://www.mql5.com/en/market/product/91851?source=Site+Profile+Seller
Show DR and IDR ranges on the chart for Regular , Overnight and After Sessions
for more information how DR and IDR work and the high probability watch : https://www.youtube.com/@themas7er
or https://twitter.com/IamMas7er
Remember to set set your chart TimeZone when you attach indicator to the chart under indicator settings / inputs
...


super power full.thanks